. 2021 May 4;13(9):12865-12895.
doi: 10.18632/aging.202957. Epub 2021 May 4.

Integrative analysis identifies key mRNA biomarkers for diagnosis, prognosis, and therapeutic targets of HCV-associated hepatocellular carcinoma

Affiliations

Integrative analysis identifies key mRNA biomarkers for diagnosis, prognosis, and therapeutic targets of HCV-associated hepatocellular carcinoma

Yongqiang Zhang et al. Aging (Albany NY). .

Abstract

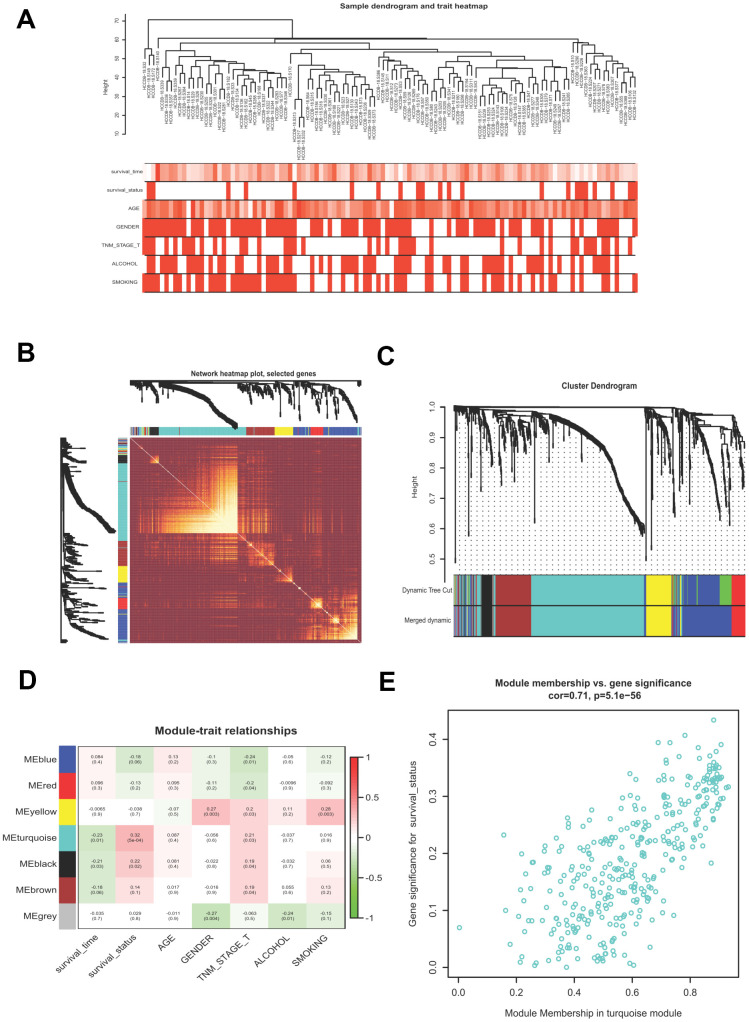
Hepatitis C virus-associated HCC (HCV-HCC) is a prevalent malignancy worldwide and the molecular mechanisms are still elusive. Here, we screened 240 differentially expressed genes (DEGs) of HCV-HCC from Gene expression omnibus (GEO) and the Cancer Genome Atlas (TCGA), followed by weighted gene coexpression network analysis (WGCNA) to identify the most significant module correlated with the overall survival. 10 hub genes (CCNB1, AURKA, TOP2A, NEK2, CENPF, NUF2, CDKN3, PRC1, ASPM, RACGAP1) were identified by four approaches (Protein-protein interaction networks of the DEGs and of the significant module by WGCNA, and diagnostic and prognostic values), and their abnormal expressions, diagnostic values, and prognostic values were successfully verified. A four hub gene-based prognostic signature was built using the least absolute shrinkage and selection operator (LASSO) algorithm and a multivariate Cox regression model with the ICGC-LIRI-JP cohort (N =112). Kaplan-Meier survival plots (P = 0.0003) and Receiver Operating Characteristic curves (ROC = 0.778) demonstrated the excellent predictive potential for the prognosis of HCV-HCC. Additionally, upstream regulators including transcription factors and miRNAs of hub genes were predicted, and candidate drugs or herbs were identified. These findings provide a firm basis for the exploration of the molecular mechanism and further clinical biomarkers development of HCV-HCC.

Keywords: WGCNA; biomarkers; differentially expressed genes; hepatitis C virus; hepatocellular carcinomas.


Conflict of interest statement

CONFLICTS OF INTEREST: The authors declare that they have no conflicts of interest.

Figures

Figure 1
Figure 1
Flowchart of this study.
Figure 2
Figure 2
Differential gene expression between HCV-HCC tumor and adjacent normal tissues. (A, B) The combination of Venn plot and Upset plot showing the common upregulated genes (A) and the common downregulated genes (B) in HCV-HCC according to five public datasets. The screening criteria was set as |log Fold change (FC)| > 1 and FDR (adj.P.Val) <0.05. (C, D) Principal component analysis (PCA) for the gene expression profiles from four microarray datasets before (C) and after (D) batch effect removal. The colors represent different datasets. (E) scatter plots visualizing the identified clusters of the tumor and normal samples based on the combined dataset. (F) Heatmap of the 240 DEGs showing their expression values for each patient. The scale bar indicates the gene expression value. Red indicates high expression level, and blue indicates low expression level. HCV-HCC, HCV- associated HCC. DEGs, differentially expressed genes.
Figure 3
Figure 3
Building a WGCNA network to identify the most significant module correlated with survival status. (A) Sample clustering tree with clinical traits. (B) Heatmap showing the eigengene networks according to the topological overlap matrix (TOM) based dissimilarity. (C) Gene clustering dendrogram, with each color corresponding to an individual gene module. (D) Pearson correlation analysis between module eigengenes and clinical traits. (E) scatter plot showing the gene significance (GS) vs module membership (MM) for the turquoise module. WGCNA, Weight Gene Co-expression Network Analysis.
Figure 4
Figure 4
Identification of hub genes in HCV-HCC. (A) The most significant cluster identified from the DEGs-PPI network. (B) The WGCNA-PPI network constructed by the turquoise module. (C, D) ROC curves showing the AUROC scores and AUC (95%CI) of the 10 hub genes for discriminating tumor from normal samples based on the ICGC-LIRI-JP dataset. Colored lines indicate the ROC curve for each hub gene, and the grey line indicates the reference line. (E) Forest plot presenting the results of the univariate Cox regression analysis for the 10 hub genes. HCV-HCC, HCV- associated HCC. DEGs, differentially expressed genes. PPI, protein-protein interaction. WGCNA, Weight Gene Co-expression Network Analysis. ROC, receiver operating characteristic. 95%CI, 95% confidence interval.
Figure 5
Figure 5
GO and KEGG analysis of the 240 common DEGs and the turquoise module. (AC) GO enrichment analysis for the upregulated genes (A), downregulated genes (B), and the turquoise module (C) (Top 20 are shown). (DF) Enrichment of KEGG pathways for the upregulated genes (D), downregulated genes (E), and the turquoise module (F). GO, gene ontology. KEGG, Kyoto Encyclopedia of Genes and Genomes. DEGs, differentially expressed genes.
Figure 6
Figure 6
Confirmation of the abnormal expression of the 10 selected hub genes and their expression correlations. (A, B) Two external datasets (GSE69715 and GSE12941) to validate the increased expression levels of the hub genes in tumors compared with adjacent normal tissues. (C) Internal validation by ICGC-LIRI-JP dataset to verify the elevated levels of the hub genes concerning tumor stage. (D, E) Strong correlations among all of the hub genes according to the ICGC-LIRI-JP and TCGA-LIHC datasets. *P < 0.05, **P < 0.01, ***P < 0.001, ****P < 0.0001.
Figure 7
Figure 7
Validation of the diagnostic efficiency for each of the 10 hub genes. (AF) Performance of the 10 hub genes in discriminating HCV-HCC from normal control based on GSE69715 (A, B), GSE107170 (C, D), and TCGA-LIHC (E, F). (G, H) Potential utilities of the hub genes for early tumor detection based on ICGC-LIRI-JP. HCV-HCC, HCV- associated HCC.
Figure 8
Figure 8
Kaplan–Meier curves for overall survival of the 10 selected hub genes and construction of a prognostic signature using LASSO Cox regression. (A) OS Kaplan–Meier curves of the 10 hub genes based on ICGC-LIRI-JP. (B) 10-fold cross-validation to select the optimal tuning parameter. The λ value of 0.015 was chosen with the lambda.min method. (C) LASSO coefficient profiles of the 10 hub genes. (D) Forest plot presenting the hazard ratio and 95% CI by multivariate Cox regression analysis for the four selected hub genes. OS, overall survival. LASSO, Least absolute shrinkage and selection operator. 95% CI, 95% confidence interval.
Figure 9
Figure 9
Performance of the defined four mRNA-based risk signature with ICGC-LIRI-JP. (A) Gene expression, risk score, and clinical outcome for all the patients in distinctive risk groups. (B) differential risk scores between high- and low-risk groups. (C) ROC plot at 3 years OS showing the AUROC score of 0.778. (D) OS Kaplan-Meier survival curves for high- and low-risk patients. (E, F) OS Kaplan-Meier survival curves for different risk groups of early stage (E) and advanced stage patients (F). ****, P < 0.0001. OS, overall survival. ROC, receiver operating characteristic. AUROC, the area under the receiver operating characteristic curve.
Figure 10
Figure 10
Relationship between the identified risk signature and tumor immune cell infiltration based on the ICGC-LIRI-JP cohort. (A) The landscape of immune infiltration in each of the tumor samples of low- and high-risk groups. (B) Heatmap representing the correlation matrix of the four signature genes, risk score, and relative abundance of 22 immune cell types. Red indicates the positive correlation, while green indicates the negative correlation. * P < 0.05, ** P < 0.01.
Figure 11
Figure 11
Upstream regulations of the ten hub genes and GO semantic similarities analysis. (A) The transcription factor-hub gene network predicted by miRNet. (B) 10 function MTIs predicted through miRTarBase 8.0. (C) Raincloud plot showing the ranking list of function semantic similarities for the 10 hub genes using the ICGC-LIRI-JP dataset. ASPM, CENPF, and PRC1 were the top three hub genes with the highest scores. (DF) GSEA results of ASPM, CENPF, and PRC1 based on the hallmark gene set. (GI) GSEA results of ASPM, CENPF, and PRC1 based on the KEGG database. GO, gene ontology. MTIs, miRNA-target interactions. KEGG, Kyoto Encyclopedia of Genes and Genomes.
Figure 12
Figure 12
Network pharmacological analysis to identify candidate drugs and effective compounds for therapeutic targets of HCV-HCC. (A) Drug-hub gene network identified from the DGIdb. Green nodes indicate the predictive miRNAs and red nodes indicate the targeted hub genes. (B) Herb-compounds-hub gene network predicted by TCM-MESH and TCM-ID. red nodes indicate hub genes, blue nodes indicate the active compounds and green nodes indicate the putative herbs containing these compounds.

References

    1. Bray F, Ferlay J, Soerjomataram I, Siegel RL, Torre LA, Jemal A. Global cancer statistics 2018: GLOBOCAN estimates of incidence and mortality worldwide for 36 cancers in 185 countries. CA Cancer J Clin. 2018; 68:394–424. 10.3322/caac.21492 - DOI - PubMed
    1. Zhang Q, Qi W, Wang X, Zhang Y, Xu Y, Qin S, Zhao P, Guo H, Jiao J, Zhou C, Ji S, Wang J. Epidemiology of Hepatitis B and Hepatitis C Infections and Benefits of Programs for Hepatitis Prevention in Northeastern China: A Cross-Sectional Study. Clin Infect Dis. 2016; 62:305–12. 10.1093/cid/civ859 - DOI - PubMed
    1. Liu GM, Zeng HD, Zhang CY, Xu JW. Identification of a six-gene signature predicting overall survival for hepatocellular carcinoma. Cancer Cell Int. 2019; 19:138. 10.1186/s12935-019-0858-2 - DOI - PMC - PubMed
    1. Huang YL, Ning G, Chen LB, Lian YF, Gu YR, Wang JL, Chen DM, Wei H, Huang YH. Promising diagnostic and prognostic value of E2Fs in human hepatocellular carcinoma. Cancer Manag Res. 2019; 11:1725–40. 10.2147/CMAR.S182001 - DOI - PMC - PubMed
    1. Wu F, Chen Q, Liu C, Duan X, Hu J, Liu J, Cao H, Li W, Li H. Profiles of prognostic alternative splicing signature in hepatocellular carcinoma. Cancer Med. 2020; 9:2171–80. 10.1002/cam4.2875 - DOI - PMC - PubMed

MeSH terms