. 2021 Apr 30;22(9):4767.
doi: 10.3390/ijms22094767.

Electrophysiological Properties of Endogenous Single Ca2+ Activated Cl- Channels Induced by Local Ca2+ Entry in HEK293

Affiliations

Electrophysiological Properties of Endogenous Single Ca2+ Activated Cl- Channels Induced by Local Ca2+ Entry in HEK293

Dmitrii Kolesnikov et al. Int J Mol Sci. .

Abstract

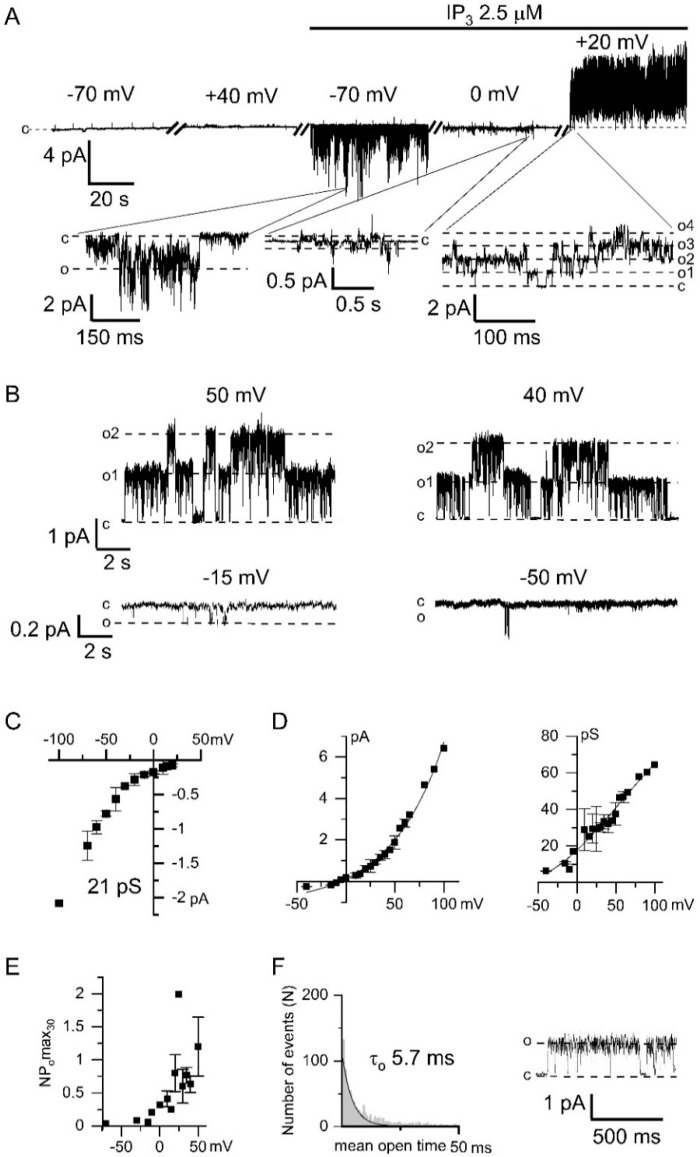
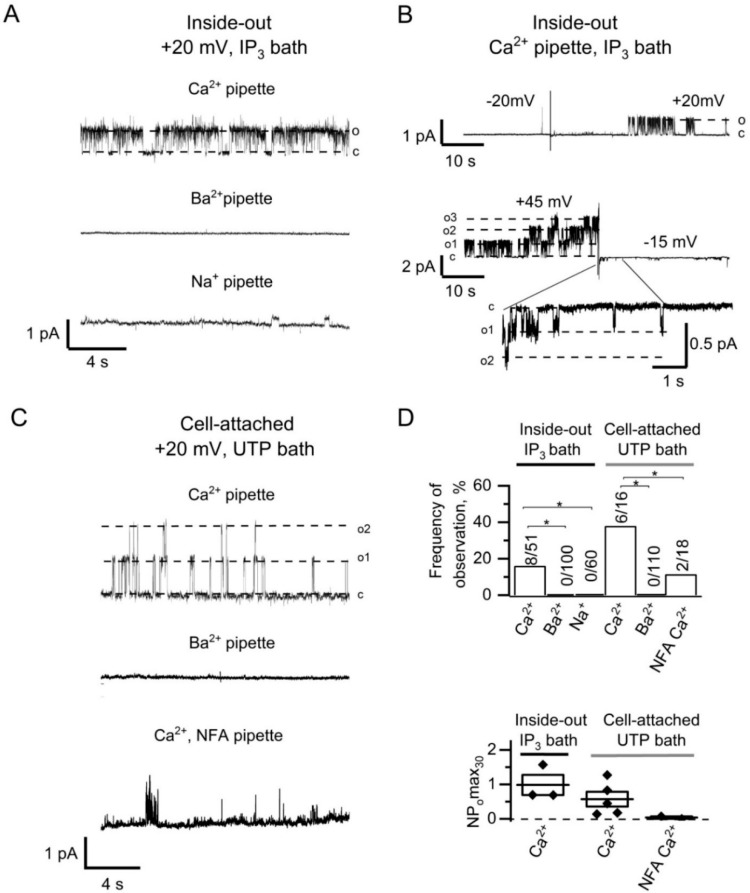
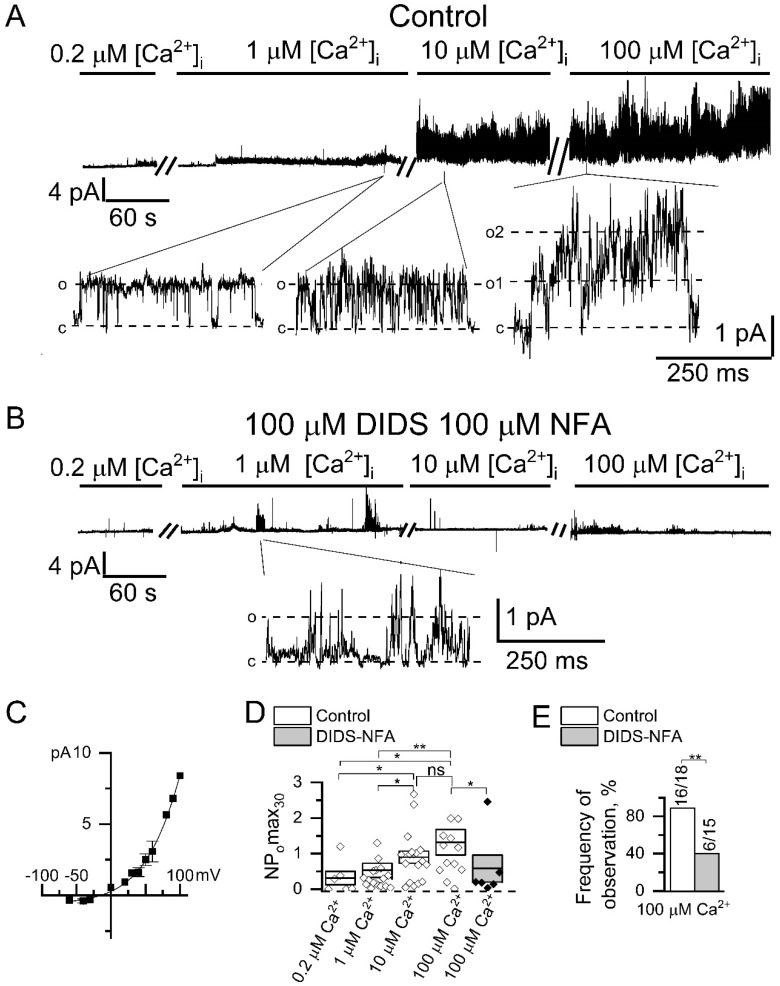
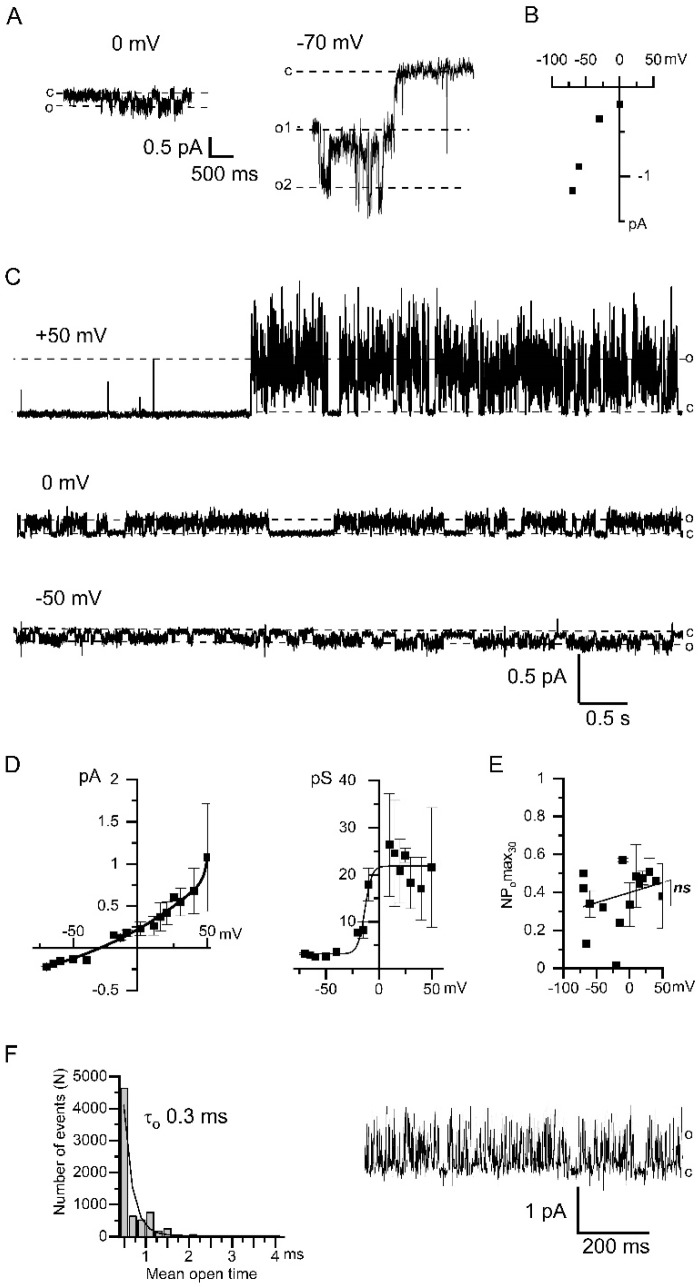
Microdomains formed by proteins of endoplasmic reticulum and plasma membrane play a key role in store-operated Ca2+ entry (SOCE). Ca2+ release through inositol 1,4,5-trisphosphate receptor (IP3R) and subsequent Ca2+ store depletion activate STIM (stromal interaction molecules) proteins, sensors of intraluminal Ca2+, which, in turn, open the Orai channels in plasma membrane. Downstream to this process could be activated TRPC (transient receptor potential-canonical) calcium permeable channels. Using single channel patch-clamp technique we found that a local Ca2+ entry through TRPC1 channels activated endogenous Ca2+-activated chloride channels (CaCCs) with properties similar to Anoctamin6 (TMEM16F). Our data suggest that their outward rectification is based on the dependence from membrane potential of both the channel conductance and the channel activity: (1) The conductance of active CaCCs highly depends on the transmembrane potential (from 3 pS at negative potentials till 60 pS at positive potentials); (2) their activity (NPo) is enhanced with increasing Ca2+ concentration and/or transmembrane potential, conversely lowering of intracellular Ca2+ concentration reduced the open state dwell time; (3) CaCC amplitude is only slightly increased by intracellular Ca2+ concentration. Experiments with Ca2+ buffering by EGTA or BAPTA suggest close local arrangement of functional CaCCs and TRPC1 channels. It is supposed that Ca2+-activated chloride channels are involved in Ca2+ entry microdomains.

Keywords: CaCC; HEK293; IP3R; SOCE; TMEM16; TRPC1; anoctamin; single channel.


Conflict of interest statement

The authors declare no conflict of interest.

Figures

Figure 1
Figure 1
Electrophysiological properties of endogenous Ca2+-activated chloride channels (CaCC) in HEK293 cells. (A) Representative recording of currents, registered at different membrane potentials, within one experiment before and after bath application of 2.5 μM IP3 (inositol 1,4,5-trisphosphate). The expanded panels depict inward IP3-induced Ca2+ currents followed by Ca2+-activated outward currents. The baseline was appropriately adjusted for voltage switches. (B) Examples of CaCC current recordings obtained after IP3-induced Ca2+ entry at different membrane potentials. (C) Current–voltage relationship of IP3-induced TRPC1 (transient receptor potential-canonical) Ca2+ currents (n = 3–11). The linear fit to the data points from −100 to −40 mV yielded single channel conductance (γ) of 21 pS. (D) Left: Current–voltage relationship of Ca2+-activated chloride channels recorded in panel B (n = 3–4). Right: The dependence of the conductance of Ca2+-activated chloride channels on the membrane potential. (E) The dependence of the activity of Ca2+-activated chloride channels, expressed as NPomax30, on the membrane potential (n = 4). (F) An open-time histogram of CaCC channel was constructed from 2563 single-channel opening events. Single exponential fit (solid line) corresponds to a time constant of 5.7 ± 0.3 ms. The current trace demonstrates a typical fragment of the current recording used for the histogram at +30 mV and filtered at 1 kHz.
Figure 2
Figure 2
Induction of CaCCs activity by IP3-mediated Ca2+ entry in HEK293 cells. (A) Current recordings after bath application of 2.5 µM IP3 to inside-out patches with 105 Ca2+ in pipette solution (top), 105 Ba2+ in pipette solution (middle), and 140 Na+ in pipette solution (bottom). Patches were held at +20 mV membrane potential. (B) IP3-induced CaCC currents in inside-out patches after switching to positive (top) or to negative (bottom) potential. (C) Current recordings after bath application of 100 µM UTP to cell-attached patches with 105 Ca2+ in pipette solution (top), 105 Ba2+ in pipette solution (middle), and 105 Ca2+ in the presence of 100 µM NFA in pipette solution (bottom). (D) The summary plot of the frequency of CaCCs observation (top) and the CaCC open channel probability (bottom) for series from the panels A–C. The frequency of CaCCs observation reflects a proportion of positive experiments to the total number of experiments. Differences are considered significant when p values are <0.05 (*).
Figure 3
Figure 3
Endogenous CaCCs activated by direct Ca2+ application in HEK293 cells. (A) Representative recordings of channels activated by the increase in intracellular Ca2+ concentration. Shown are traces at compressed and expanded scale recorded in inside-out configuration at holding potential of +40 mV. (B) Representative traces of channels activated by the increase in intracellular Ca2+ concentration recorded at the same conditions as in panel A but in the presence of 100 µM NFA and 100 µM DIDS in the recording pipette. (C) Current–voltage relationship for CaCCs activated by direct 100 µM Ca2+ application (n = 3). (D) A summary plot of the CaCCs open channel probability in inside-out recordings at holding potential of +40 mV. The data are presented for different cytoplasmic Ca2+ concentration, and with or without chloride channel blockers NFA (100 µM) and DIDS (100 µM). (E) The frequency of CaCC observation in patches is plotted as a proportion of positive experiments to the number of experiments in the series. The data are presented for experiments with bath application of 100 µM Ca2+ with or without 100 µM NFA and 100 µM DIDS in the pipette. Data are shown as means ± S.E. Differences are considered significant when p values are <0.05 (*), and <0.01 (**).
Figure 4
Figure 4
Properties of Ca2+-activated chloride channels upon using fast Ca2+ chelator 10 mM BAPTA. (A) Examples of single channel recordings through the TRPC1 channels induced by the bath application of 2.5 μM IP3 in inside-out patches. Membrane potentials were held at 0 mV (left) and −70 mV (right). (B) Current–voltage relationship of store-operated TRPC1 channels is induced by 2.5 µM IP3 application. Approximation of conductance gives 21 pS (n = 3–7). (C) Current recordings of CaCCs-activated following IP3-induced Ca2+ entry registered at different membrane potentials +50 mV, 0 mV, −50 mV (top to bottom). (D) Left: The current–voltage relationship of CaCCs in the BAPTA containing bath solution (n = 4–8). Right: The dependence of the CaCC conductance on the membrane potential (n = 4–8). (E) The dependence of the CaCC activity, expressed as NPomax30, on the membrane potential (n = 4). (F) Histogram of the open state lifetime distribution of the CaCCs. The membrane potential is +30 mV. An exponential fit gives an average lifetime of 0.3 ± 0.1 ms. The total number of events is n = 7946. Typical fragment of the current used for the histogram, monitored at +30 mV and filtered at 1 kHz.

Similar articles

Cited by

References

    1. Barak P., Parekh A.B. Signaling through Ca2+ Microdomains from Store-Operated CRAC Channels. Cold Spring Harb. Perspect. Biol. 2020;12:1–18. doi: 10.1101/cshperspect.a035097. - DOI - PMC - PubMed
    1. Parekh A.B., Putney J.W. Store-Operated Calcium Channels. Physiol. Rev. 2005;85:757–810. doi: 10.1152/physrev.00057.2003. - DOI - PubMed
    1. Gudlur A., Quintana A., Zhou Y., Hirve N., Mahapatra S., Hogan P.G. STIM1 triggers a gating rearrangement at the extracellular mouth of the ORAI1 channel. Nat. Commun. 2014;5:1–11. doi: 10.1038/ncomms6164. - DOI - PMC - PubMed
    1. Saul S., Stanisz H., Backes C.S., Schwarz E.C., Hoth M. How ORAI and TRP channels interfere with each other: Interaction models and examples from the immune system and the skin. Eur. J. Pharmacol. 2014;739:49–59. doi: 10.1016/j.ejphar.2013.10.071. - DOI - PubMed
    1. Ong H.L., Jang S.-I., Ambudkar I.S. Distinct Contributions of Orai1 and TRPC1 to Agonist-Induced [Ca2+]i Signals Determine Specificity of Ca2+-Dependent Gene Expression. PLoS ONE. 2012;7:e47146. doi: 10.1371/journal.pone.0047146. - DOI - PMC - PubMed

LinkOut - more resources