Review
. 2021 Apr 29;10(5):1056.
doi: 10.3390/cells10051056.

Mechanisms of Metabolic Reprogramming in Cancer Cells Supporting Enhanced Growth and Proliferation

Affiliations
Review

Mechanisms of Metabolic Reprogramming in Cancer Cells Supporting Enhanced Growth and Proliferation

Chelsea Schiliro et al. Cells. .

Erratum in

Abstract

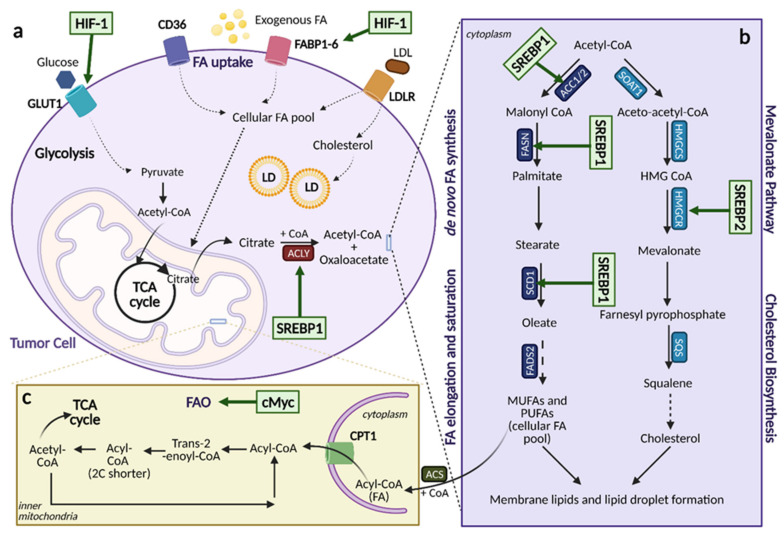
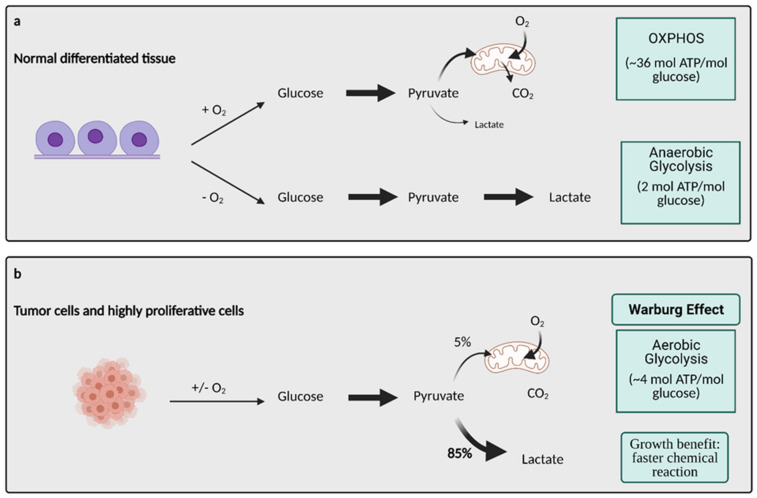
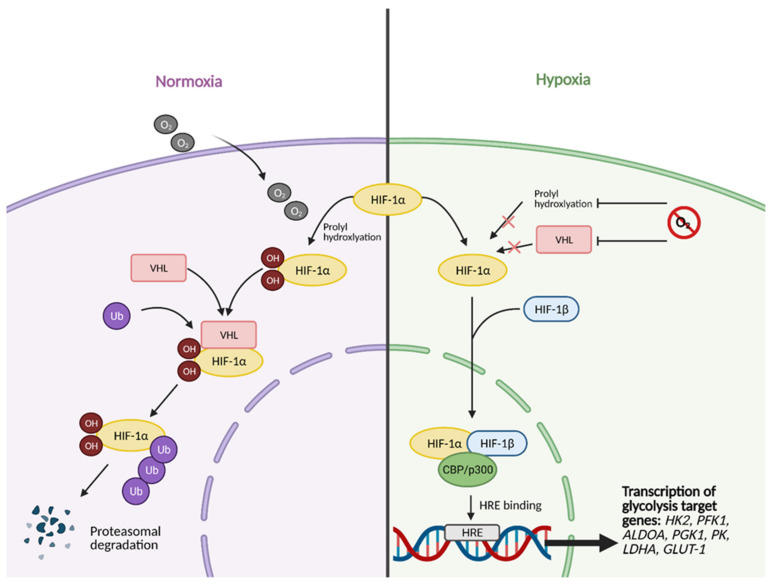
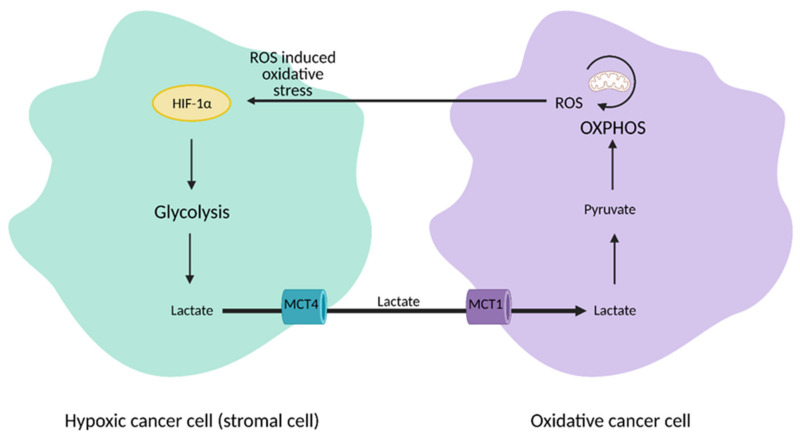
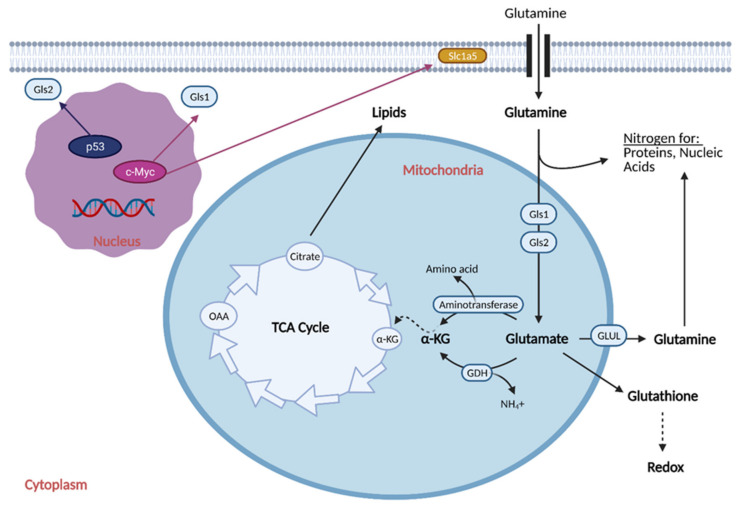
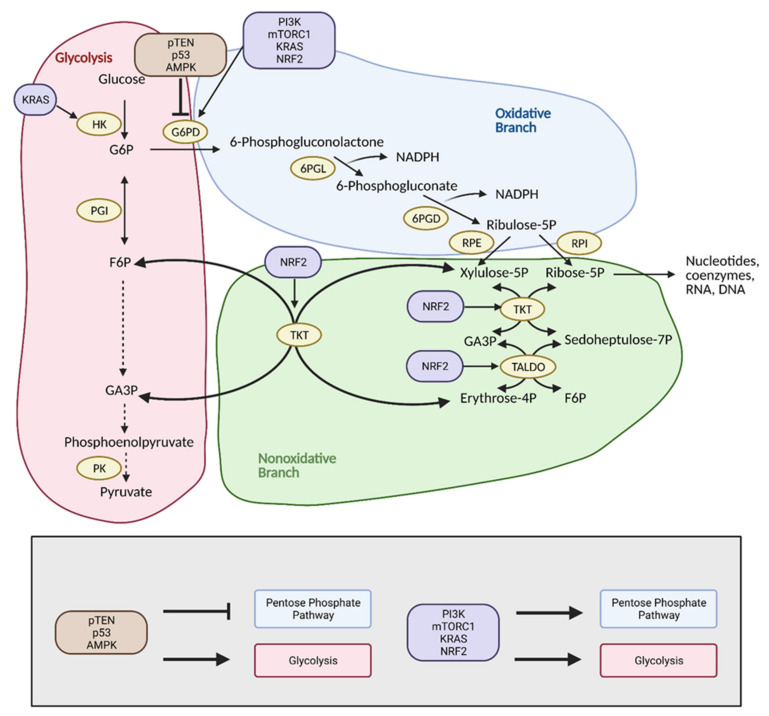
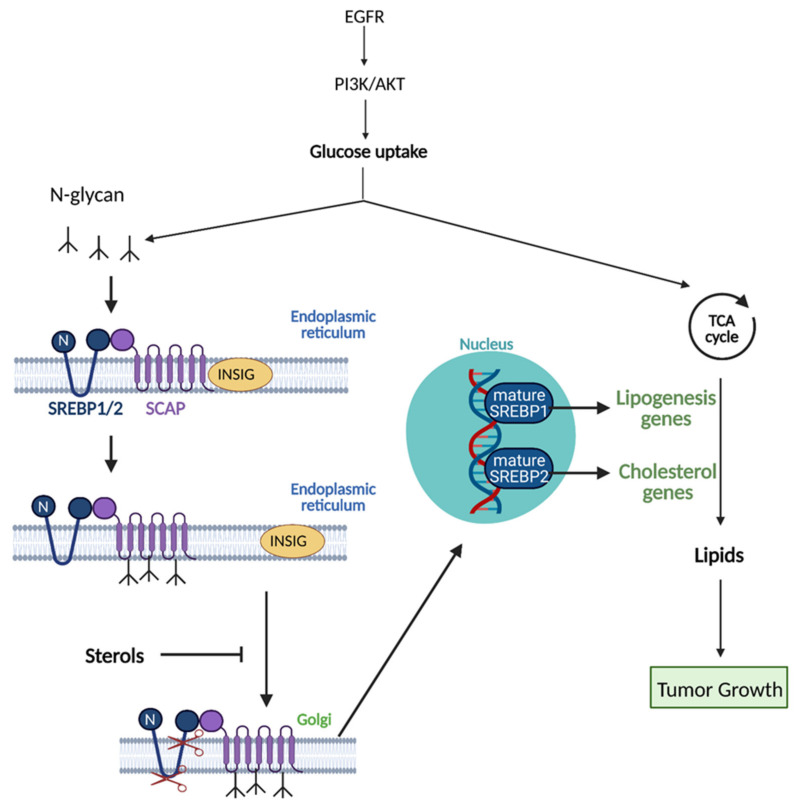
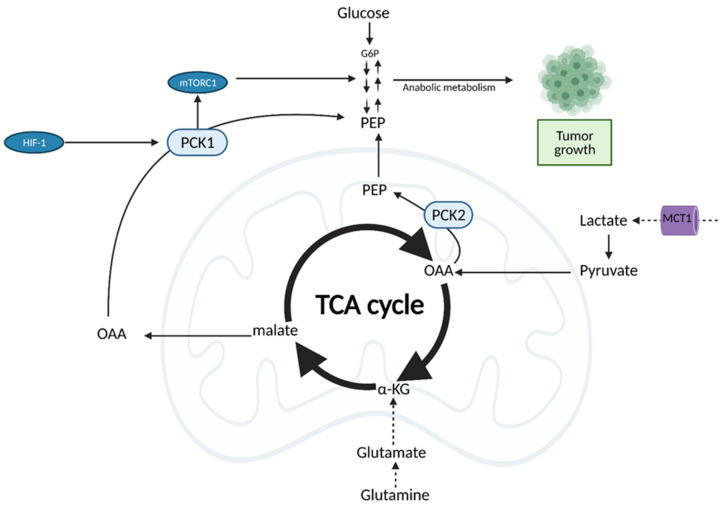
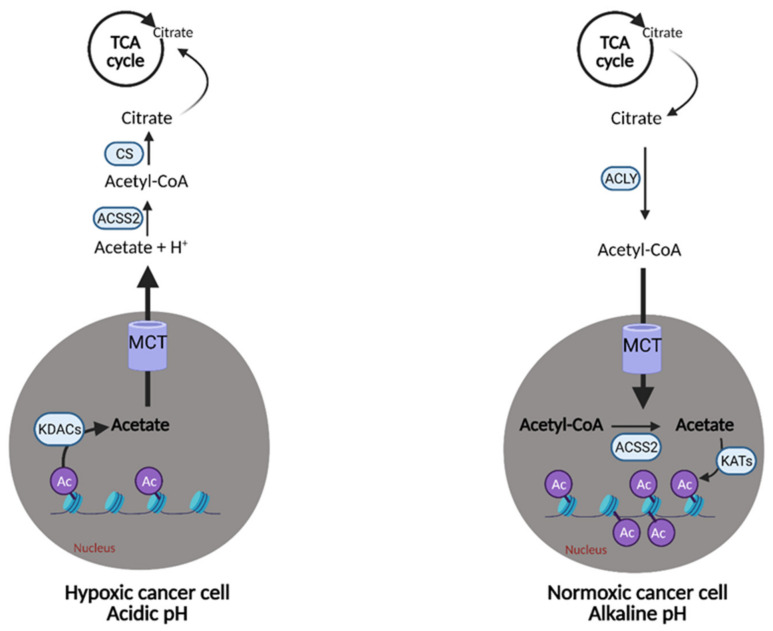
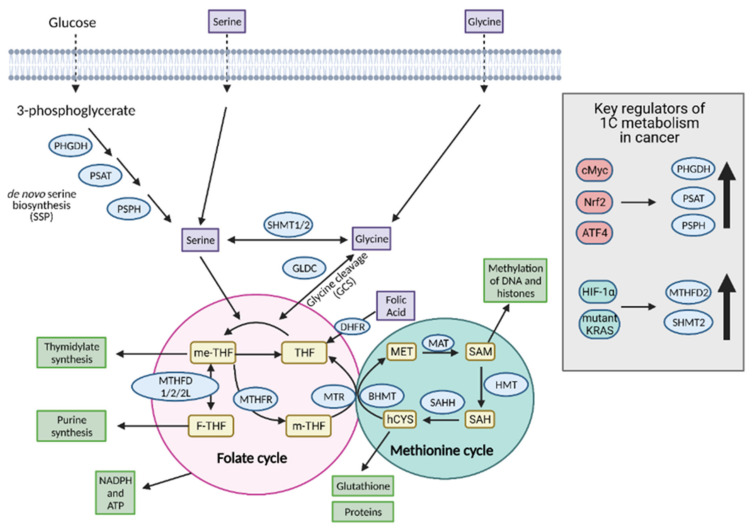
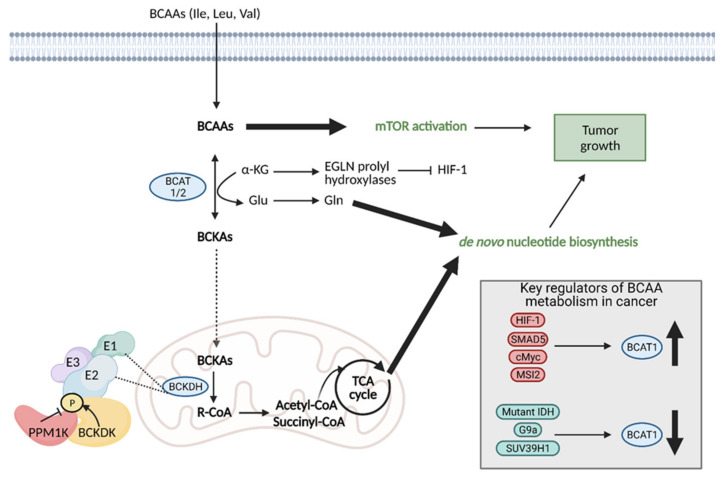
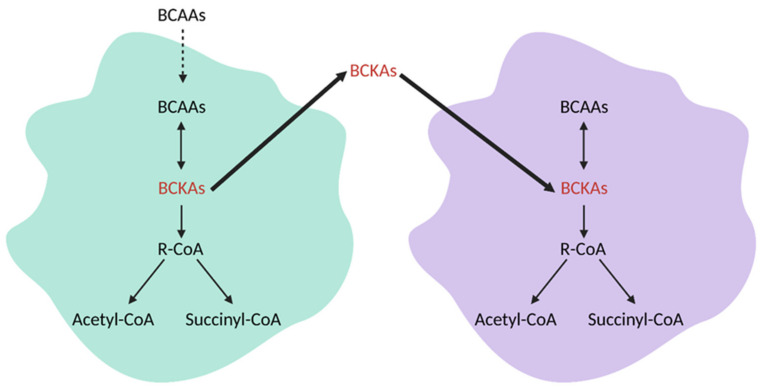
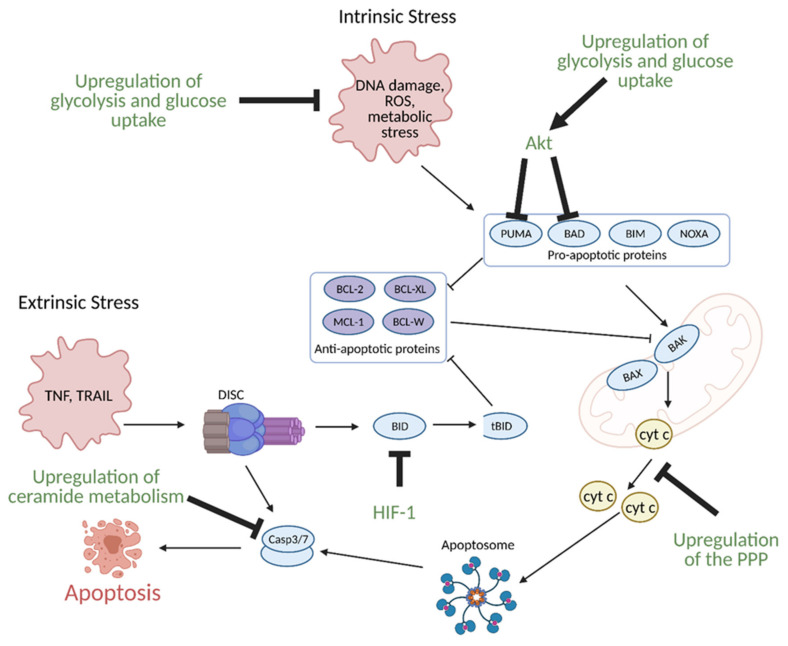
Cancer cells alter metabolic processes to sustain their characteristic uncontrolled growth and proliferation. These metabolic alterations include (1) a shift from oxidative phosphorylation to aerobic glycolysis to support the increased need for ATP, (2) increased glutaminolysis for NADPH regeneration, (3) altered flux through the pentose phosphate pathway and the tricarboxylic acid cycle for macromolecule generation, (4) increased lipid uptake, lipogenesis, and cholesterol synthesis, (5) upregulation of one-carbon metabolism for the production of ATP, NADH/NADPH, nucleotides, and glutathione, (6) altered amino acid metabolism, (7) metabolism-based regulation of apoptosis, and (8) the utilization of alternative substrates, such as lactate and acetate. Altered metabolic flux in cancer is controlled by tumor-host cell interactions, key oncogenes, tumor suppressors, and other regulatory molecules, including non-coding RNAs. Changes to metabolic pathways in cancer are dynamic, exhibit plasticity, and are often dependent on the type of tumor and the tumor microenvironment, leading in a shift of thought from the Warburg Effect and the "reverse Warburg Effect" to metabolic plasticity. Understanding the complex nature of altered flux through these multiple pathways in cancer cells can support the development of new therapies.

Keywords: Warburg Effect; aerobic glycolysis; cancer; one-carbon metabolism; oxidative phosphorylation; pentose phosphate pathway.


Conflict of interest statement

The authors declare no conflict of interest.

Figures

Figure 6
Figure 6
Lipid metabolic reprogramming in Cancer. An overview of lipid metabolic pathways and how they are modified in cancer. (a). Tumor cells take up fatty acids (FAs) using multiple trans-porters, including CD36, FA binding proteins 1-6 (FABP1-6), and a low-density lipoprotein receptor (LDLR) for low-density lipoproteins (LDL). These free FAs then become a part of the cellular FA pool where they can enter the citric acid (TCA) cycle and contribute to lipid formation. The upregulation of FA uptake in cancer occurs through hypoxia-inducible factor (HIF-1)-induced FABP1-6 over-expression. (b). The upregulation of lipogenesis and cholesterol biosynthesis is achieved through sterol regulatory element binding protein (SREBP) activation. SREBP1 activation induces the ex-pression of lipogenesis genes, while SREBP2 activation induces the expression of cholesterol bio-synthesis genes. (c). Fatty acid oxidation (FAO) can be upregulated by cMyc, depending on the cancer type as a means to counteract oxidative stress. ACC1/2: acetyl-CoA carboxylase 1/2, ACLY: ATP citrate lyase, ACS: acyl-CoA synthetase, α-KG: alpha-ketoglutarate, CoA: coenzyme A, CPT1: carnitine palmitoyltransferase 1, FADS: FA desaturases, FASN: fatty acid synthase, FPP: farne-syl-pyrophosphate, GLUT1: glucose transporter 1, HMG-CoA: hydroxy-methylglutaryl-CoA, HMGCS: hydroxy-methylglutaryl-CoA synthase, HMGCR: hydroxy-methylglutaryl-CoA reduc-tase, LD: lipid droplets, MUFA: monounsaturated fatty acids, PUFA: polyunsaturated fatty acids, SCD1: stearoyl-CoA desaturase 1, SOAT: sterol O-acyltransferase. The figure is created with Bio-Render.com (accessed on 26 March 2021). This figure is modified from Figure 1 in [78].
Figure 1
Figure 1
Glucose metabolism in normal differentiated tissue vs. tumor cells. (a) In normal differentiated tissues, one of two pathways is utilized. When oxygen is present, glucose is metabolized to pyruvate, which later enters OXPHOS to produce ~36 mol ATP/mol glucose. When no oxygen is present, glucose is metabolized to lactate, which yields 2 mol ATP/mol glucose. (b) Tumors and other highly proliferative cells prefer to convert the majority of their glucose to lactate to yield ~4 mol ATP/mol glucose, even in the presence of oxygen. This is called the Warburg Effect, and while it produces less ATP/mol glucose, it is a much faster chemical reaction than OXPHOS, conferring a major growth benefit to cancer cells. ATP; adenosine triphosphate, CO2; carbon dioxide, O2; oxygen, mol; mole. Figure created with BioRender.com (accessed on 26 March 2021).
Figure 2
Figure 2
HIF-1α activation in normal vs. hypoxic conditions. Under normal conditions, in the presence of oxygen, the regulatory subunit of master transcription factor hypoxia-inducible factor (HIF-1), HIF-1α, undergoes prolyl hydroxylation, which induces HIF-1α binding to von Hippel-Lindau (VHL) tumor suppressor protein. This results in HIF-1α being tagged with Ubiquitin (Ub) to undergo proteasomal degradation. In hypoxic conditions, HIF-1α cannot undergo prolyl hydroxylation and subsequent binding to VHL. This allows it to bind to its partner, HIF-1β, and translocate to the nucleus. In the nucleus, fully functional HIF then forms a complex with transcriptional co-activators CBP/p300. The complex then binds to hypoxia response element (HRE) domains of the DNA, resulting in the transcription of several genes involved in glycolysis, such as HK2 (hexokinase 2), PFK1 (phosphofructokinase 1), ALDOA (aldolase A), PGK1 (phosphoglycerate kinase 1), PK (pyruvate kinase), LDHA (lactate dehydrogenase A), and GLUT-1 (glucose transporter 1). O2; oxygen, OH; hydroxyl group. Figure created with BioRender.com (accessed on 26 March 2021).
Figure 3
Figure 3
Reverse Warburg Effect. In the reverse Warburg Effect, substrates from different populations of cancer cells can be shared between each other and utilized. Oxidative cancer cells can take up lactate from hypoxic cancer cells that perform aerobic glycolysis to fuel oxidative phosphorylation (OXPHOS). Hypoxic cancer cells can also take up reactive oxygen species (ROS) from oxidative cancer cells to induce hypoxia-inducible factor 1α (HIF-1α) activation and aerobic glycolysis. This affords cancer cells an additional mechanism that enhances proliferation and survival. MCT1; monocarboxylate transporter 1, MCT4; monocarboxylate transporter 4. Figure created with BioRender.com (accessed on 26 March 2021).
Figure 4
Figure 4
Glutamine Metabolic Reprogramming in Cancer. Cancer cells exhibit increased glutaminolysis, which is the conversion of glutamine to glutamate. This occurs as a result of upregulation of an isoform of glutaminase (Gls1) and glutamine transporter, Slc1a5, by oncogenic c-Myc. Increased glutamine uptake provides nitrogen for proteins and nucleic acids, while increased glutaminolysis provides α-ketoglutarate (α-KG) for the citric acid (TCA) cycle, resulting in increased production of lipids. Increased glutamine uptake also results in the production of glutathione, which regulates redox and helps the cell attenuate oxidative damage. Cancer cells typically exhibit downregulation of a second isoform of glutaminase, Gls2, as induction of its expression by p53 generally leads to tumor suppression. GDH; glutamate dehydrogenase, GLUL; glutamine synthetase, NH4+; ammonium, OAA; oxaloacetate. Figure created with BioRender.com (accessed on 26 March 2021).
Figure 5
Figure 5
Reprogramming of the pentose phosphate pathway (PPP) in cancer. Upregulation of the PPP is achieved primarily through upregulation of glucose-6-phosphate dehydrogenase (G6PD) by PI3K, mTORC1, KRAS, and NRF2. This shunts glucose into the oxidative branch of the PPP instead of into glycolysis. Inhibitors of G6PD, pTEN, p53, and AMPK are often found mutated in cancer. Upregulation of the nonoxidative branch of the PPP in cancer occurs via NRF2, which increases transketolase (TKT) and transaldolase (TALDO) expression. There is also crosstalk between glycolysis and the PPP via KRAS, which increases hexokinase (HK) expression to upregulate glycolytic intermediates for progression into the PPP. Modulation of the PPP in this manner results in the production of energy and substrates necessary for tumor growth. F6P; fructose 6-phosphate, G3P; glyceraldehyde 3-phosphate, G6P; glucose 6-phosphate, NADPH; nicotinamide adenine dinucleotide phosphate, 6PGD; 6-phosphogluconate dehydrogenase, 6PGL; 6-phosphogluconolactonase, PK; pyruvate kinase, PGI; phosphoglucoisomerase, RPE; ribulose 5-phosphate 3-epimerase, RPI; ribose-5-phosphate isomerase. Figure created with BioRender.com (accessed on 26 March 2021).
Figure 7
Figure 7
Activation of sterol regulatory element binding proteins (SREBPs) in cancer. SREBPs are the main transcription factors that regulate expression of genes involved in lipogenesis that are translated as inactive precursors in the endoplasmic reticulum associated with SREBP cleavage activating protein (SCAP) and insulin induced gene protein (INSIG). PI3K/AKT and glucose uptake results in the N-glycosylation of SREBPs, which separates the complex from INSIG and allows it to translocate to the Golgi and become proteolytically activated. Mature SREBPs bind to genes in the nucleus to induce their transcription. Mature SREBP1 preferentially binds genes involved in fatty acid (FA) synthesis while mature SREBP2 preferentially binds genes involved in cholesterol biosynthesis. The upregulation of these genes results in tumor growth. High concentrations of sterols inhibit SREBP activation. EGFR; epidermal growth factor receptor, TCA cycle; the citric acid cycle. Figure created with BioRender.com (accessed on 26 March 2021).
Figure 8
Figure 8
Oncogenic Regulation of the citric acid (TCA) cycle to support tumor growth. Unlike normal cells which primarily utilize glucose for input into the TCA cycle, cancer cells rely on alternative substrates, such as glutamate produced via glutaminolysis and lactate. TCA cycle flux is modulated by phosphoenolpyruvate carboxykinase (PEPCK), which has both cytosolic and mitochondrial isoforms (PCK1/2). PEPCK is overexpressed via hypoxia-inducible factor (HIF-1) and preferentially uses OAA derived from lactate as a substrate. Increased anaplerosis into the TCA cycle is compensated by the cataplerotic conversion of oxaloacetate (OAA) to phosphoenolpyruvate (PEP) via PEPCK. Overexpression of PEPCK promotes cancer cell growth via a truncated form of gluconeogenesis to glycolytic intermediates. These intermediates can be used for anabolic metabolism to support tumor growth. α-KG; alpha-ketoglutarate, G6P; glucose 6-phosphate, MCT1; monocarboxylate transporter 1. Figure created with BioRender.com (accessed on 26 March 2021).
Figure 9
Figure 9
Metabolic plasticity of acetate in cancer. Cancer cells can alter the concentration of free acetate based on conditions in the tumor microenvironment. In hypoxic/acidic conditions, when oxidative phosphorylation (OXPHOS) is compromised or when there is low availability of exogenous fatty acids (FAs), cancer cells can release free acetate to raise the pH inside of the cell or convert it into acetyl-CoA for use in the citric acid (TCA) cycle. This is accomplished via the release of acetate from acetylated histones in the nucleus by lysine deacetylases (KDACs). Alternatively, cancer cells with functional OXPHOS or an excess of free FAs, can uptake free acetate via the acetylation of histones in the nucleus by lysine acetyltransferases (KATs). This buffering system provides cancer cells with another survival and growth mechanism. Ac; acetyl group, Acetyl-CoA; acetyl-coenzyme A, ACLY; adenosine triphosphate (ATP) citrate lyase, ACSS2; acetyl-CoA synthetase 2, CS; citrate synthase, H+; hydrogen, MCT; monocarboxylate transporter. Figure created with BioRender.com (accessed on 26 March 2021).
Figure 10
Figure 10
Regulation of one-carbon (1C) metabolism in cancer. Serine and glycine are transported into the cell or synthesized in the cell and serve as input molecules for 1C metabolism. Serine is synthesized from the glycolytic intermediate, 3-phosphoglycerate, via the de novo serine biosynthetic pathway (SSP) and glycine can be synthesized from serine via serine hydroxymethyltransferase 1 (SHMT1) in the cytoplasm or SHMT2 in the mitochondria. Upregulation of the SSP in cancer occurs via cMyc, Nrf2, and ATF4. Upregulation of the mitochondrial isoform SHMT2 occurs in cancer via hypoxia-inducible factor 1α (HIF-1α) and mutant KRAS-dependent pathways. Serine and glycine can both enter the early part of 1C metabolism, the folate cycle, although cancer cells tend to preferentially utilize serine over glycine. Upon entering the folate cycle, serine and glycine can donate 1C units to tetrahydrofolate (THF) to form 5,10-methylenetetrahydrofolate (me-THF). From there, one of three transformations can occur that lead to thymidylate synthesis, purine synthesis, or methionine synthesis via the coupling of the methionine synthase (MTR) reaction to conversion of homocysteine (hCYS) to form methionine (MET). The latter connects the folate cycle to the methionine cycle. The methionine cycle can be used to generate glutathione, proteins, and S-adenosylmethionine (SAM), all of which are important for cancer cell growth. ATP; adenosine tripihosphate, BHMT; betaine-homocysteine S-methyltransferase, DHFR; dihydrofolate reductase, F-THF; 10-formyltetrahydrofolate, GLDC; glycine dehydrogenase, HMT; histone methyl transferase, MAT; methionine adenosyltransferase, m-THF; 5-methyl-tetrahydrofolate, MTHFD 1/2/2L; methyltetrahydrofolate dehydrogenase 1/2/2L, MTHFR; methylenetetrahydrofolate reductase, NADPH; nicotinamide adenine dinucleotide phosphate, PHGDH; phosphoglycerate dehydrogenase, PSAT; phosphoserine aminotransferase; PSPH; phosphoserine phosphatase, SAH; S-adenosyl homocysteine, SAHH; SAH hydrolase. Figure created with BioRender.com (accessed on 26 March 2021).
Figure 11
Figure 11
Reprogramming of branched chain amino acid (BCAA) metabolism in cancer. Branched chain amino acids (BCAAs), including isoleucine (Ile), leucine (Leu), and valine (Val), can be transported into the cell where they can directly activate mTOR signaling for tumor growth. They can also be converted to branched chain α-keto acids (BCKAs) via cytosolic branched chain amino acid transaminase 1 (BCAT1) or mitochondrial BCAT2 in a reversible reaction. BCAT1 overexpression results in increased BCAA catabolism, which is typical in cancer and is upregulated by several molecules (HIF-1, SMAD5, cMyc, MSI2), although some cancers favor the reverse reaction. The conversion of BCAAs to BCKAs generates glutamate, which can be used for de novo nucleotide biosynthesis. BCKAs can be further degraded in the mitochondria to acetyl CoA and succinyl CoA to power the TCA cycle and de novo nucleotide biosynthesis to support cancer proliferation. α-KG; alpha-ketoglutarate, BCKDH; branched-chain alpha-keto acid dehydrogenase complex, Glu; glutamate, Gln; glutamine, HIF-1; hypoxia-inducible factor 1, IDH; isocitrate dehydrogenase, MSI2; Musashi2, mTOR; mammalian target of rapamycin; PPM1K; Mg2+/Mn2+- dependent 1 K protein phosphatase, R-CoA; R-coenzyme A. Figure created with BioRender.com (accessed on 26 March 2021).
Figure 12
Figure 12
Branched chain amino acid (BCAA) metabolism intercommunication in the tumor microenvironment. Branched chain α-keto acids (BCKAs) produced by one cell in the tumor microenvironment can be taken up and utilized by a neighboring cell. The neighboring cell can then degrade the BCKAs to acetyl-CoA or succinyl CoA or convert them back to BCAAs depending on metabolic needs. R-CoA; R-coenzyme A. Figure created with BioRender.com (accessed on 26 March 2021).
Figure 13
Figure 13
Regulation of apoptosis through metabolism in cancer. Apoptosis can be induced via intrinsic or extrinsic stress. Intrinsic stress results in the activation of pro-apoptotic proteins that then activate B-cell lymphoma 2 (Bcl-2)-associated X protein (BAX) and Bcl-2-homologous antagonist killer (BAK) in the mitochondria to facilitate cytochrome c (cyt c) release via mitochondrial outer membrane polarization. Cytochrome c release results in the formation of the apoptosome, which leads to the activation of caspase 3 (Casp3) and caspase 7 (Casp7). Casp3 and Casp7 then induce apoptosis. Extrinsic stress results in the formation of the Death Inducing Signaling Complex (DISC), which can directly activate apoptosis or trigger intrinsic apoptosis via BH3 interacting-domain death agonist (BID) cleavage to truncated BID (tBID). Cancer avoids apoptosis through multiple metabolism-mediated mechanisms, including reduction of reactive oxygen species (ROS) via the upregulation of glycolysis and glucose uptake, inhibition of pro-apoptotic proteins via growth factor signaling, inhibition of cyt c release via upregulation of the pentose phosphate pathway (PPP), inhibition of BID cleavage via hypoxia-inducible factor 1 (HIF-1), and inhibition of effector caspases via the upregulation of ceramide metabolism. Akt; protein kinase B, BAD; Bcl-2 associated death promoter, BIM; Bcl-2-like protein 11, BCL-W; Bcl-like protein 2, BCL-XL; Bcl-extra-large, MCL-1; myeloid-cell leukemia 1, NOXA; phorbol-12-myristate-13-acetate-induced protein 1, PUMA; p53 upregulated modulator of apoptosis. Figure created with BioRender.com (accessed on 26 March 2021).

References

    1. Romero-Garcia S., Lopez-Gonzalez J.S., Báez-Viveros J.L., Aguilar-Cazares D., Prado-Garcia H. Tumor cell metabolism: An integral view. Cancer Biol. Ther. 2011;12:939–948. doi: 10.4161/cbt.12.11.18140. - DOI - PMC - PubMed
    1. Warburg O. The metabolism of carcinoma cells. J. Cancer Res. 1925;9:148–163. doi: 10.1158/jcr.1925.148. - DOI
    1. Pascale R.M., Calvisi D.F., Simile M.M., Feo C.F., Feo F. The Warburg effect 97 years after its discovery. Cancers. 2020;12:2819. doi: 10.3390/cancers12102819. - DOI - PMC - PubMed
    1. Heiden M.G.V., Cantley L.C., Thompson C.B. Understanding the Warburg effect: The metabolic requirements of cell proliferation. Science. 2009;324:1029–1033. doi: 10.1126/science.1160809. - DOI - PMC - PubMed
    1. Läsche M., Emons G., Gründker C. Shedding new light on cancer metabolism: A metabolic tightrope between life and death. Front. Oncol. 2020;10 doi: 10.3389/fonc.2020.00409. - DOI - PMC - PubMed

LinkOut - more resources