. 2021 Apr 29;22(9):4743.
doi: 10.3390/ijms22094743.

Hemistepsin a Induces Apoptosis of Hepatocellular Carcinoma Cells by Downregulating STAT3

Affiliations

Hemistepsin a Induces Apoptosis of Hepatocellular Carcinoma Cells by Downregulating STAT3

Il Je Cho et al. Int J Mol Sci. .

Abstract

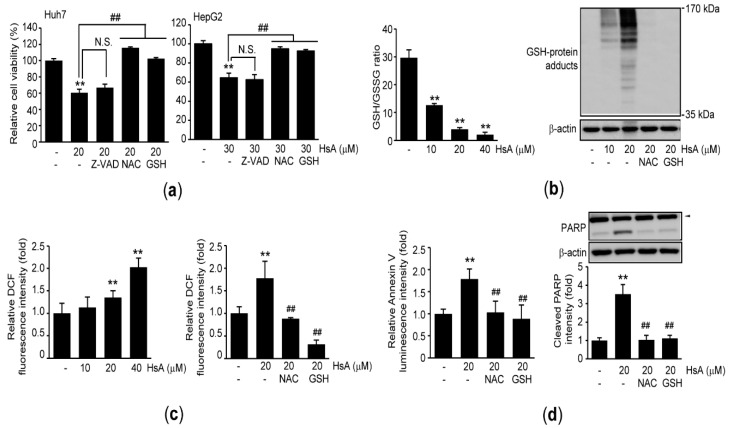
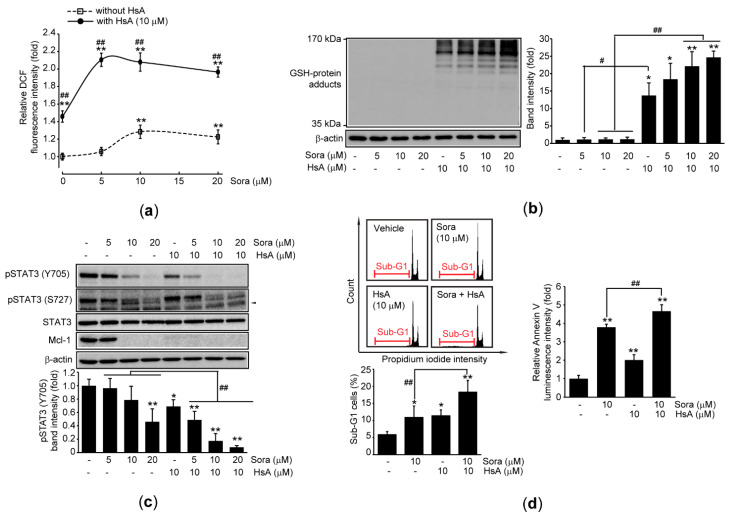
Hemistepta lyrata (Bunge) Bunge is a biennial medicinal plant possessing beneficial effects including anti-inflammation, and hemistepsin A (HsA) isolated from H. lyrata has been known as a hepatoprotective sesquiterpene lactone. In this report, we explored the cytotoxic effects of H. lyrata on hepatocellular carcinoma (HCC) cells and investigated the associated bioactive compounds and their relevant mechanisms. From the viability results of HCC cells treated with various H. lyrata extracts, HsA was identified as the major compound contributing to the H. lyrata-mediated cytotoxicity. HsA increased expression of cleaved PARP and cells with Sub-G1 phase, Annexin V binding, and TUNEL staining, which imply HsA induces apoptosis. In addition, HsA provoked oxidative stress by decreasing the reduced glutathione/oxidized glutathione ratio and accumulating reactive oxygen species and glutathione-protein adducts. Moreover, HsA inhibited the transactivation of signal transducer and activator of transcription 3 (STAT3) by its dephosphorylation at Y705 and glutathione conjugation. Stable expression of a constitutive active mutant of STAT3 prevented the reduction of cell viability by HsA. Finally, HsA enhanced the sensitivity of sorafenib-mediated cytotoxicity by exaggerating oxidative stress and Y705 dephosphorylation of STAT3. Therefore, HsA will be a promising candidate to induce apoptosis of HCC cells via downregulating STAT3 and sensitizing conventional chemotherapeutic agents.

Keywords: Hemistepta lyrata (Bunge) Bunge; apoptosis; hemistepsin A (HsA); hepatocellular carcinoma (HCC) cells; oxidative stress; signal transducer and activator of transcription 3 (STAT3); sorafenib.


Conflict of interest statement

The authors declare no conflict of interest.

Figures

Figure 1
Figure 1
Effects of H. lyrata crude extracts or isolated bioactive compounds on the viability of HepG2 cells. After HpeG2 cells were treated with four H. lyrata crude extracts (left), twelve fractionated H. lyrata chloroform extracts (middle), HsA, or HsB (right) for 24 h, relative cell viability was determined by thiazolyl blue tetrazolium bromide (MTT) assay. ** p < 0.01, * p < 0.05, significance versus vehicle-treated cells: HL-W, H. lyrata water extract; HL-E, H. lyrata ethanol extract; HL-M, H. lyrata methanol extract; HL-C, H. lyrata chloroform extract; FC, fractionated H. lyrata chloroform extract.
Figure 2
Figure 2
HsA activates the apoptosis of HCC cells. Huh7 (for ae) and HepG2 (for a and e) were exposed to 5–40 μM HsA for 24 (for b, d, and e) or 48 h (for a,c): (a) Relative cell viability of HsA-treated cells was determined by MTT assay; (b) Fluorescence intensity of PI-stained cells was monitored using a flow cytometer (left), Sub-G1 cells were expressed as a percentage of the total cell analyzed (right); (c) Annexin V binding activity was determined using a luminometer; (d) Fragmented DNAs were stained by TUNEL, and nuclei were counter-stained by DAPI; (e) Changes of PARP and caspase-3 expression were determined by immunoblotting. Equal protein loading was verified by β-actin immunoblotting. Arrowheads in immunoblot images indicate precursor forms of PARP and caspase-3 (upper). Band intensity of cleaved PARP was quantified by scanning densitometry (lower). ** p < 0.01, * p < 0.05, significance versus vehicle-treated cells.
Figure 3
Figure 3
Oxidative stress contributes to promoting HsA-mediated apoptosis in HCC cells. Huh7 (for ad) and HepG2 (for a) were exposed to 10–40 μM HsA for 6 (for c), 24 (for b and d-right), or 48 h (for a and d-left). Z-VAD (20 μM), NAC (1 mM), or GSH (2 mM) was pre-incubated for 1 h prior to HsA treatment: (a) MTT assay; (b) The GSH/GSSG ratio was calculated after quantifying reduced and oxidized glutathione in HsA-treated cells (left). GSH-protein adducts ranging from 35 to 170 kDa were determined by GSH immunoblotting (right); (c) ROS was monitored after incubating cells with 2′,7′-dichlorofluorescein diacetate (DCFH-DA); (d) Annexin V binding activity (left) and expression level of cleaved PARP (right). Arrowhead in immunoblot image indicates PARP precursor (upper right). Band intensity of cleaved PARP was quantified by densitometry (lower right). ** p < 0.01, significance versus vehicle-treated cells; ## p < 0.01, significance among HsA-treated cells; N.S., not significant; DCF, dichlorofluorescein.
Figure 4
Figure 4
HsA inhibits STAT3 in HCC cells. Huh7 (for ae), HepG2 (for a and c), and recombinant Huh7 cells (for f) were exposed to 5–20 μM HsA for 18 (for b), 24 (for a, ce), or 6–24 h (for f): (a) Immunoblot analysis for phosphorylated STAT3 in HsA-treated HCC cells. Arrowhead in immunoblot image indicates a non-specific band (left). Band intensity of phosphorylated STAT3 in Huh7 (middle) and HepG2 (right) was quantified by densitometry; (b) Reporter gene assay. Huh7 cells were transiently transfected with pGL4.47[luc2P/SIE/Hygro] alone (left) or in combination with CA-STAT3. Equal amount of pCDNA3.2/V5-DEST was used as mock-transfection (middle and right). Expression of CA-STAT3 was verified by Flag immunoblotting (right); (c) Mcl-1 expression in HsA-treated HCC cells (upper). Mcl-1 levels were quantified by densitometry (lower); (d) Effect of antioxidants on HsA-dependent STAT3 inhibition. NAC (1 mM)-, or GSH (2 mM)-pretreated Huh7 cells were exposed to HsA (upper). Levels of phosphorylated STAT3 at Y705 and Mcl-1 expression were quantified by densitometry (lower); (e) Proteins obtained from HsA-treated Huh7 cells were immunoprecipitated using an anti-GSH antibody, followed by STAT3 immunoblotting. 30 μg of proteins was used as input control lysates; (f) MTT assay was conducted after recombinant Huh7 cells were exposed to HsA (left). Stable expression of CA-STAT3 was verified by Flag immunoblotting (right). ** p < 0.01, significance versus vehicle-treated cells (for a,b-left,c,d, f) or mock-transfected cells (for b-middle); ## p < 0.01, # p < 0.05, significance among CA-STAT3-transfected cells (for b-middle), significance among HsA-treated cells (for d), significance between Huh7 [Mock] and Huh7 [CA-STAT3] (for f-left); pSTAT3, phosphorylated STAT3; IgG, immunoglobulin G; IP, immunoprecipitation; Huh7 [Mock], recombinant Huh7 cells which stably transfected with pCDNA3.2/V5-DEST; Huh7 [CA-STAT3], recombinant Huh7 cells which stably transfected with CA-STAT3.
Figure 5
Figure 5
HsA sensitizes sorafenib-mediated cytotoxicity in HCC cells. Huh7 cells were treated with 5–20 μM sorafenib in the presence 10 μM HsA for 6 (for a), 24 (for b, c, and d-left), or 48 h (for d-right): (a) Effect of HsA on sorafenib-mediated ROS production was monitored by reacting the cells with DCFH-DA; (b) Immunoblot analysis using a GSH antibody (left). Intensity of GSH-protein adducts ranging from 35 to 170 kDa was quantified by densitometry (right); (c) Immunoblot analysis for phosphorylated STAT3 and Mcl-1 expression. Arrowhead in immunoblot image indicates a non-specific band (upper). Band intensity of Y705 phosphorylation of STAT3 was quantified by densitometry (lower); (d) Fluorescence intensity of PI-stained cells (upper left) and Sub-G1 cells (lower left) was analyzed using a flow cytometer. Annexin V binding activity was determined using a luminometer (right). ** p < 0.01, * p < 0.05, significance versus vehicle-treated cells; ## p < 0.01, # p < 0.05, significance between sorafenib and sorafenib + HsA; Sora, sorafenib.

References

    1. Torre L.A., Bray F., Siegel R.L., Ferlay J., Lortet-Tieulent J., Jemal A. Global cancer statistics, 2012. CA Cancer J. Clin. 2015;65:87–108. doi: 10.3322/caac.21262. - DOI - PubMed
    1. National Cancer Information Center. [(accessed on 30 March 2021)]; Available online: https://www.cancer.go.kr.
    1. Villanueva A., Hernandez-Gea V., Llovet J.M. Medical therapies for hepatocellular carcinoma: A critical view of the evidence. Nat. Rev. Gastroenterol. Hepatol. 2013;10:34–42. doi: 10.1038/nrgastro.2012.199. - DOI - PubMed
    1. Llovet J.M., Ricci S., Mazzaferro V., Hilgard P., Gane E., Blanc J.F., de Oliveira A.C., Santoro A., Raoul J.L., Forner A., et al. Sorafenib in advanced hepatocellular carcinoma. N. Engl. J. Med. 2008;359:378–390. doi: 10.1056/NEJMoa0708857. - DOI - PubMed
    1. Zhu Y.J., Zheng B., Wang H.Y., Chen L. New knowledge of the mechanisms of sorafenib resistance in liver cancer. Acta Pharmacol. Sin. 2017;38:614–622. doi: 10.1038/aps.2017.5. - DOI - PMC - PubMed

MeSH terms