

ZFP90 drives the initiation of colitis-associated colorectal cancer via a microbiota-dependent strategy
- PMID: 33947304
- PMCID: PMC8115455
- DOI: 10.1080/19490976.2021.1917269
ZFP90 drives the initiation of colitis-associated colorectal cancer via a microbiota-dependent strategy
Abstract
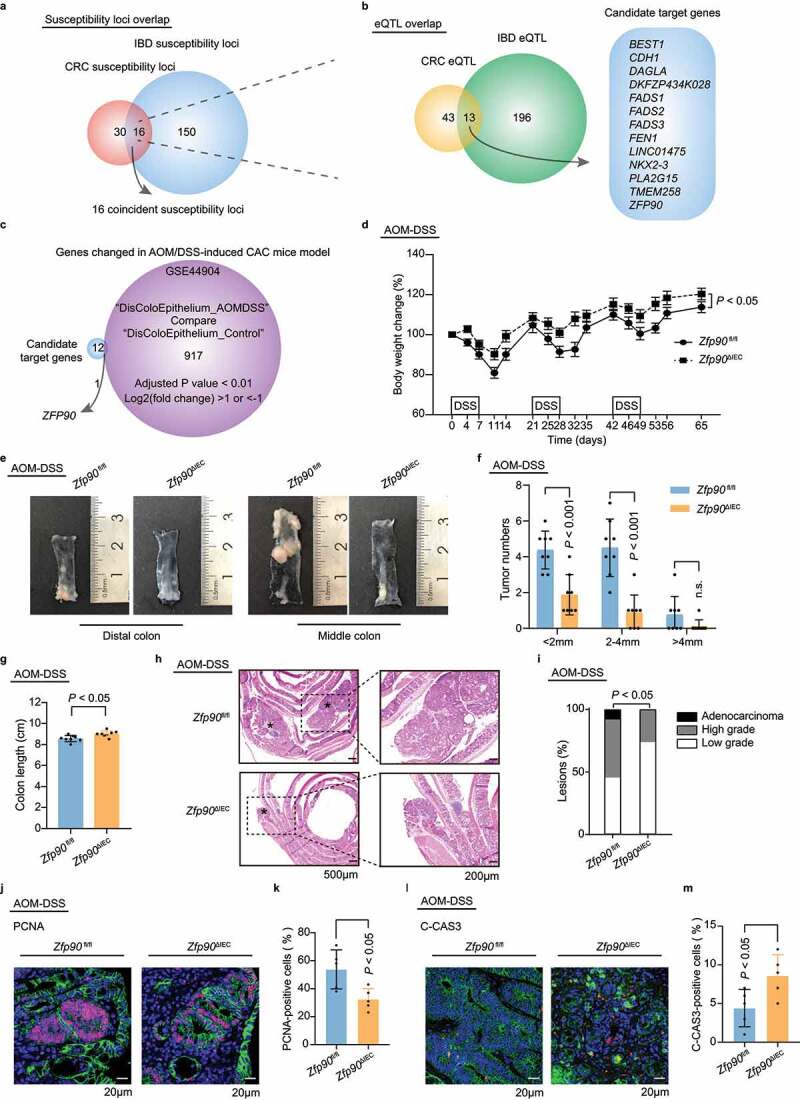
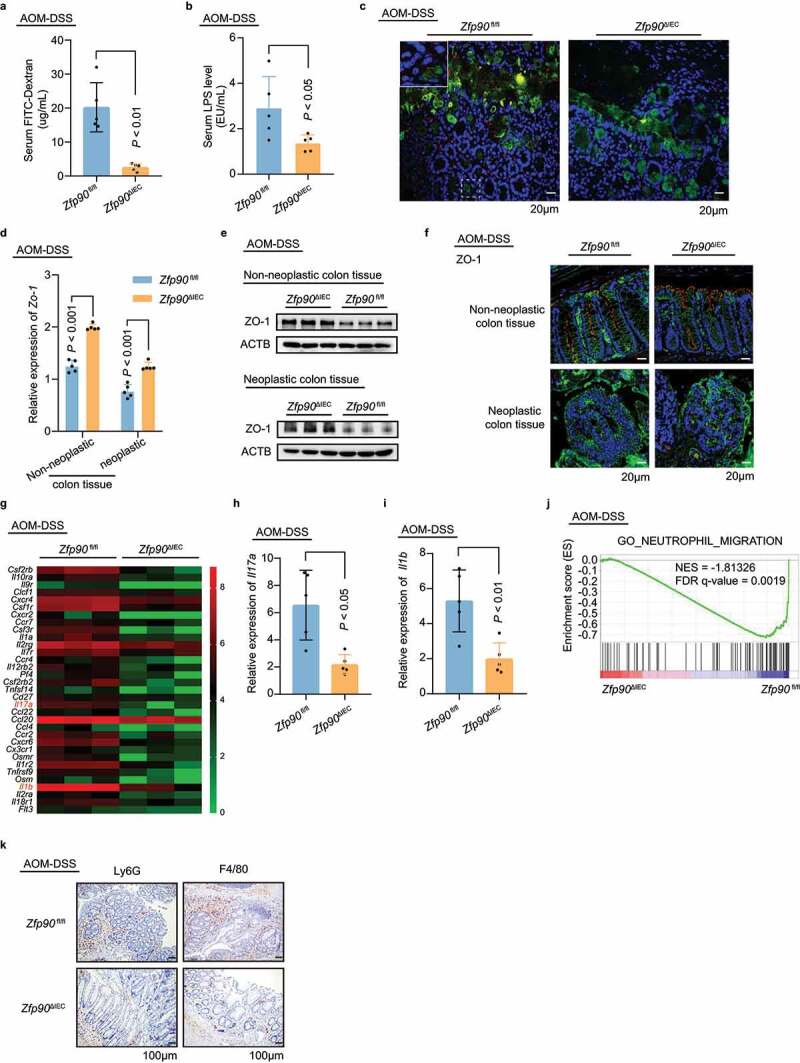
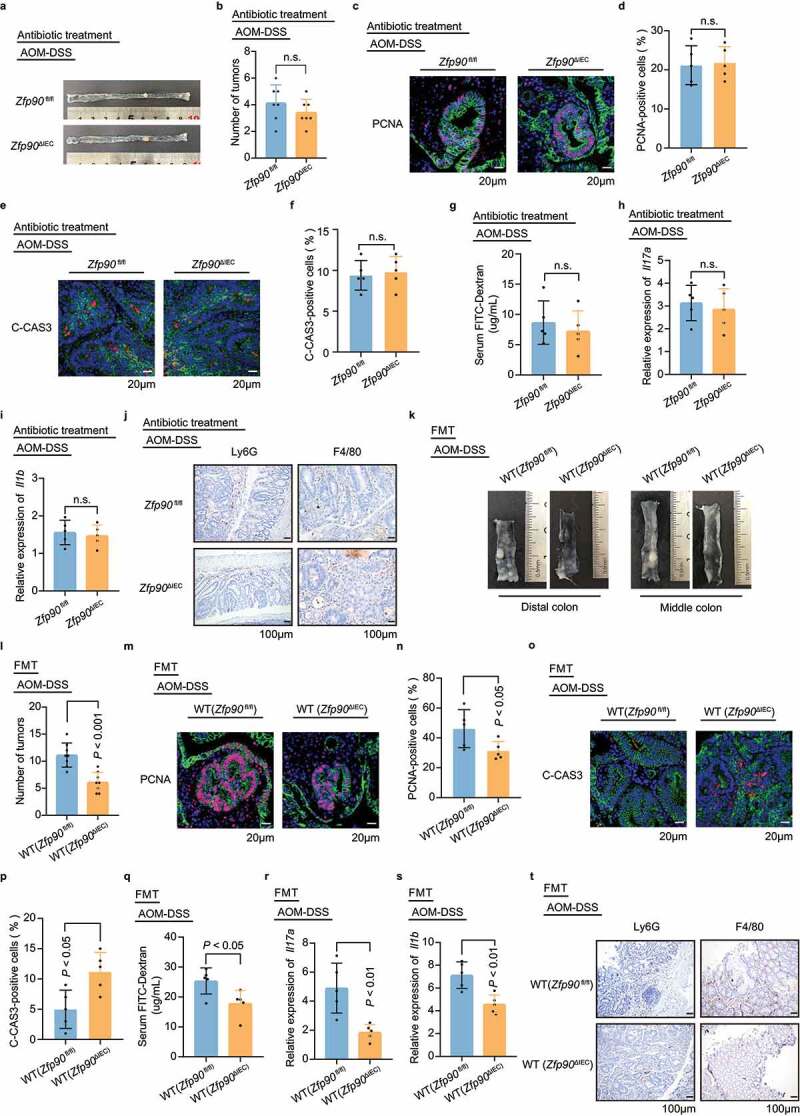
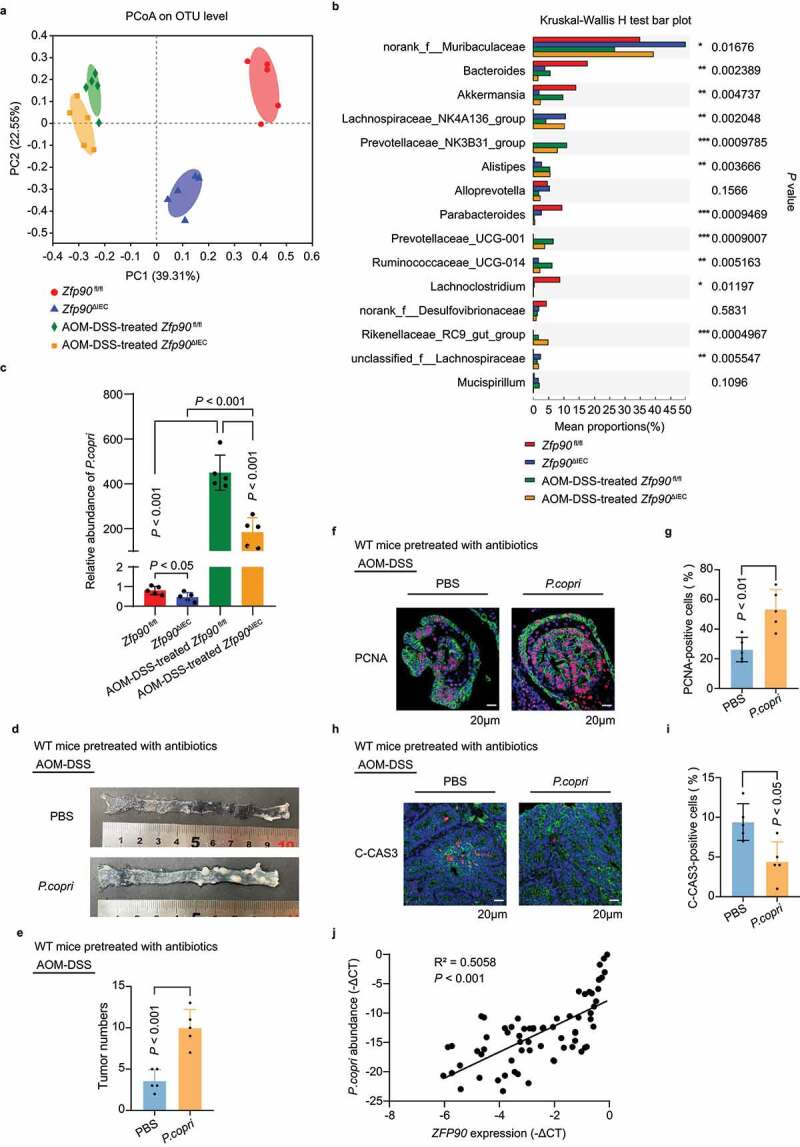
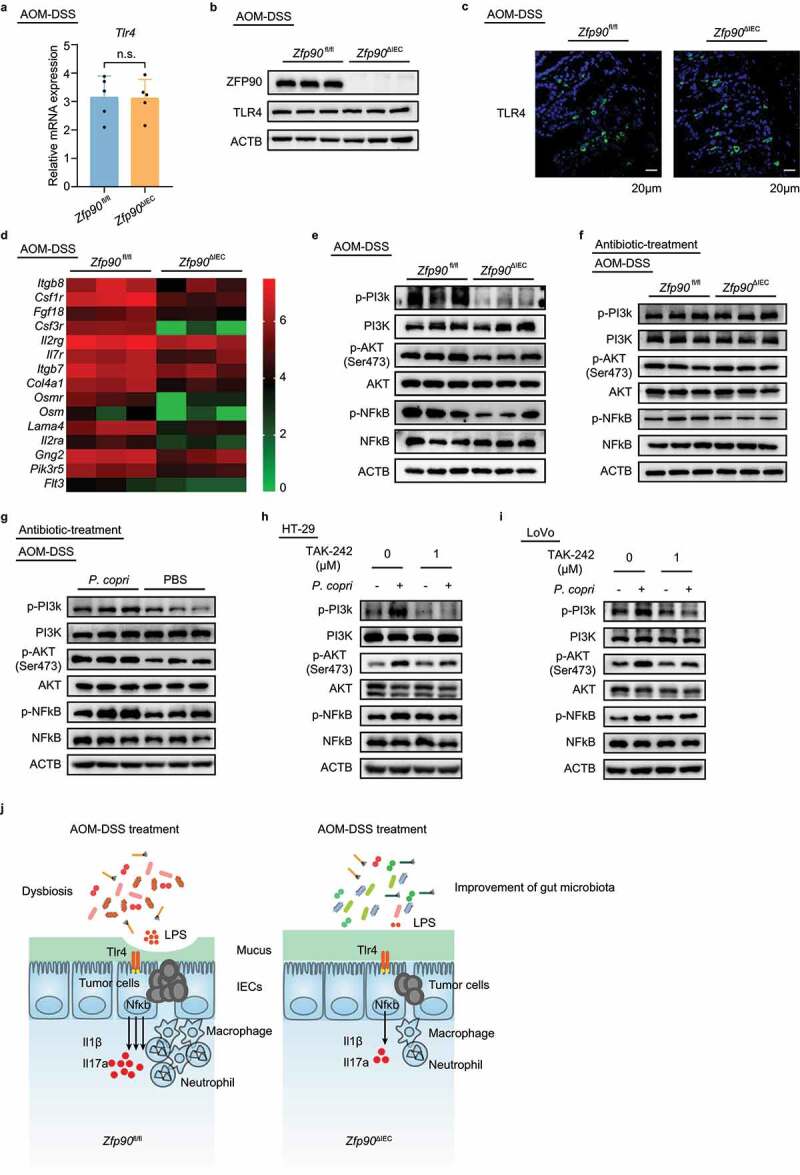
Chronic inflammation and gut microbiota dysbiosis are risk factors for colorectal cancer. In clinical practice, patients with inflammatory bowel disease (IBD) have a greatly increased risk of developing colitis-associated colorectal cancer (CAC). However, the underlying mechanism of the initiation of CAC remains unknown. Systematic analyses using an existing genome-wide association study (GWAS) and conditional deletion of Zfp90 (encoding zinc finger protein 90 homolog) in a CAC mouse model indicated that Zfp90 is a putative oncogene in CAC development.Strikingly, depletion of the gut microbiota eliminated the tumorigenic effect of Zfp90 in the CAC mouse model. Moreover, fecal microbiota transplantation demonstrated that Zfp90 promoted CAC dependent on the gut microbiota. Analysis of 16s rDNA sequences in fecal specimens from the CAC mouse model allowed us to speculate that a Prevotella copri-defined microbiota might mediate the oncogenic role of Zfp90 in the development of CAC. Mechanistic studies revealed Zfp90 accelerated CAC development through the TLR4-PI3K-AKT-NF-κB pathway. Our findings revealed the crucial role of the Zfp90-microbiota-NF-κB axis in creating a tumor-promoting environment and suggested therapeutic targets for CAC prevention and treatment.
Keywords: ZFP90; colitis-associated colorectal cancer; gut barrier; gut microbiota; prevotella copri.
Conflict of interest statement
The authors declare no potential conflicts of interest.
Figures
Similar articles
-
A missense mutation in Muc2 promotes gut microbiome- and metabolome-dependent colitis-associated tumorigenesis.bioRxiv [Preprint]. 2025 Jun 3:2025.05.31.657160. doi: 10.1101/2025.05.31.657160. bioRxiv. 2025. PMID: 40502184 Free PMC article. Preprint.
-
Modulation of Gut Microbiota Combined with Upregulation of Intestinal Tight Junction Explains Anti-Inflammatory Effect of Corylin on Colitis-Associated Cancer in Mice.Int J Mol Sci. 2022 Feb 28;23(5):2667. doi: 10.3390/ijms23052667. Int J Mol Sci. 2022. PMID: 35269806 Free PMC article.
-
Berberine regulates short-chain fatty acid metabolism and alleviates the colitis-associated colorectal tumorigenesis through remodeling intestinal flora.Phytomedicine. 2022 Jul 20;102:154217. doi: 10.1016/j.phymed.2022.154217. Epub 2022 May 27. Phytomedicine. 2022. PMID: 35660350
-
Roles of the Polyphenol-Gut Microbiota Interaction in Alleviating Colitis and Preventing Colitis-Associated Colorectal Cancer.Adv Nutr. 2021 Mar 31;12(2):546-565. doi: 10.1093/advances/nmaa104. Adv Nutr. 2021. PMID: 32905583 Free PMC article. Review.
-
Microbiome and colorectal cancer: Unraveling host-microbiota interactions in colitis-associated colorectal cancer development.Semin Immunol. 2017 Aug;32:3-13. doi: 10.1016/j.smim.2017.04.003. Epub 2017 May 2. Semin Immunol. 2017. PMID: 28465070 Review.
Cited by
-
Zinc Finger Protein 90 Knockdown Promotes Cisplatin Sensitivity via Nrf2/HO-1 Pathway in Ovarian Cancer Cell.Cancers (Basel). 2023 Mar 3;15(5):1586. doi: 10.3390/cancers15051586. Cancers (Basel). 2023. PMID: 36900383 Free PMC article.
-
Gut microbiota dysbiosis promotes the development of epithelial ovarian cancer via regulating Hedgehog signaling pathway.Gut Microbes. 2023 Jan-Dec;15(1):2221093. doi: 10.1080/19490976.2023.2221093. Gut Microbes. 2023. PMID: 37282604 Free PMC article.
-
Screening of patient-derived organoids identifies mitophagy as a cell-intrinsic vulnerability in colorectal cancer during statin treatment.Cell Rep Med. 2025 Apr 15;6(4):102039. doi: 10.1016/j.xcrm.2025.102039. Epub 2025 Mar 27. Cell Rep Med. 2025. PMID: 40154491 Free PMC article.
-
Colitis-associated carcinogenesis: crosstalk between tumors, immune cells and gut microbiota.Cell Biosci. 2023 Oct 24;13(1):194. doi: 10.1186/s13578-023-01139-8. Cell Biosci. 2023. PMID: 37875976 Free PMC article. Review.
-
A New Combination of Bifidobacterium bifidum and Lactococcus lactis Strains with Synergistic Effects Alleviates Colitis-Associated Colorectal Cancer.Foods. 2024 Sep 25;13(19):3054. doi: 10.3390/foods13193054. Foods. 2024. PMID: 39410090 Free PMC article.
References
Publication types
MeSH terms
Substances
LinkOut - more resources
Full Text Sources
Other Literature Sources
Molecular Biology Databases