. 2021 May 4;22(1):134.
doi: 10.1186/s13059-021-02360-9.

Role of epigenetics in unicellular to multicellular transition in Dictyostelium

Affiliations

Role of epigenetics in unicellular to multicellular transition in Dictyostelium

Simon Yuan Wang et al. Genome Biol. .

Abstract

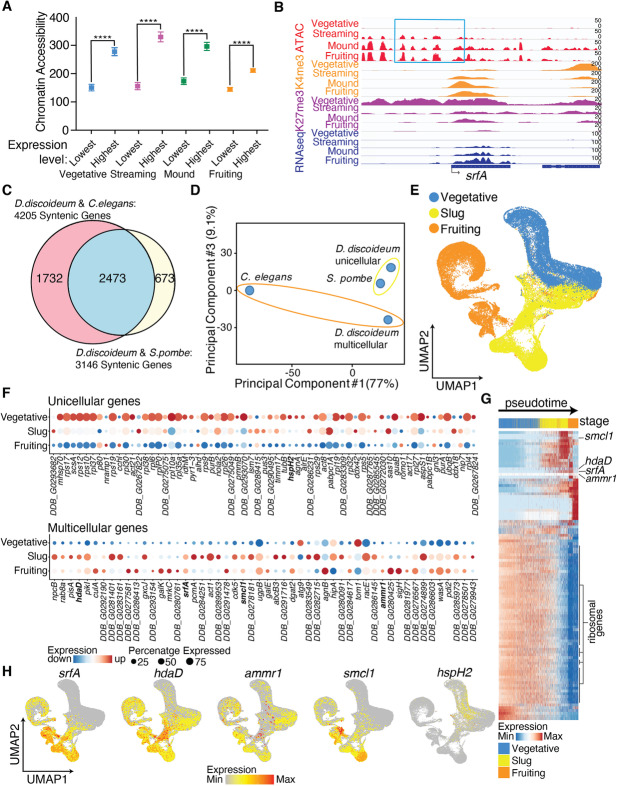
Background: The evolution of multicellularity is a critical event that remains incompletely understood. We use the social amoeba, Dictyostelium discoideum, one of the rare organisms that readily transits back and forth between both unicellular and multicellular stages, to examine the role of epigenetics in regulating multicellularity.

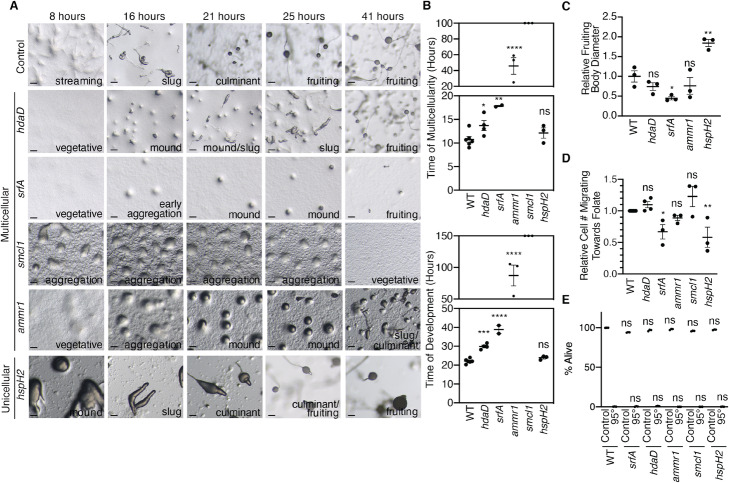
Results: While transitioning to multicellular states, patterns of H3K4 methylation and H3K27 acetylation significantly change. By combining transcriptomics, epigenomics, chromatin accessibility, and orthologous gene analyses with other unicellular and multicellular organisms, we identify 52 conserved genes, which are specifically accessible and expressed during multicellular states. We validated that four of these genes, including the H3K27 deacetylase hdaD, are necessary and that an SMC-like gene, smcl1, is sufficient for multicellularity in Dictyostelium.

Conclusions: These results highlight the importance of epigenetics in reorganizing chromatin architecture to facilitate multicellularity in Dictyostelium discoideum and raise exciting possibilities about the role of epigenetics in the evolution of multicellularity more broadly.

Keywords: Acetylation; Dictyostelium discoideum; Epigenetics; HDAC; Methylation; Multicellularity; hdaD; smcl1; srfA.


Conflict of interest statement

The authors have no competing interests.

Figures

Fig. 1
Fig. 1
Chromatin modifications and accessibility on D. discoideum display stage-specific patterns for H3K4me3, H3K27ac, H3K4me1, and chromatin architecture. a Cartoon diagram representing the different stages and approximate time required to achieve each stage. Colors used in this diagram are used throughout the figures to represent specific stages. b Heatmaps of ATAC-seq merged peaks from 5 replicates of each of the stages of Dictyostelium (V1, V2, V3, VA, and VB; S1, S2, S3, SA, and SB; M1, M2, M3, MA, and MB; F1, F2, F3, FA, and FB) 1500 basepairs upstream or downstream of the TSS. c Metagene analysis of ATAC-seq experiments performed at different stages shows that the unicellular stage of D. discoideum (vegetative: shown in blue line) displays greater chromatin accessibility 250 basepairs downstream of the TSS than multicellular stages (streaming: shown in purple line, mound: shown in green line, fruiting body: shown in orange line). d PCA analysis shows the open regions in vegetative D. discoideum are separate from those in the streaming, mound, and fruiting stages. A and B mark replicates from frozen samples while 1, 2, 3, and 4 mark replicates from fresh samples. e A heatmap of the ATACseq data at different life cycle stages shows distinct accessible regions in the multicellular stages relative to the unicellular stage. f PCA of ChIPseq analyses of H3K4me3, H3K27ac, and H3K4me1 reveals that H3K4me3, H3K27ac, and H3K4me1 are sufficient to distinguish unicellular from multicellular D. discoideum. g Heatmaps show distinct chromatin modification patterns for the localization of H3K4me3, H3K27ac, and H3K4me1 in unicellular (vegetative: VA and VB) and multicellular (streaming: SA and SB, mound: MA and MB, and fruiting body: FA and FB) stages. H3K36me3 did not display distinct patterning (Additional file 1: Figure S6D) and H3K27me3, H3K9me3, and H3 were unable to produce heat maps due to either poor antibody specificity or similar localization occurrences
Fig. 2
Fig. 2
Transcriptomic analysis on vegetative, streaming, mound, and fruiting body stages of D. discoideum reveals unicellular and multicellular specific gene expression patterns. a A heatmap of gene expression of all 13,267 genes at different stages of D. discoideum reveals gene sets that increase, decrease, and remain constant throughout progression to multicellular stages. Scale bar is displayed below. a and b indicate independent replicates. b Principle components analysis (PCA) of gene expression demonstrates that biological replicates cluster together and unicellular, vegetative stage clusters separately from the three multicellular stages. c Representative stage-specific gene expression tracks of known stage-specific genes. d Real-time qPCR validation of representative multicellular and unicellular gene expression from RNAseq datasets. This graph represents the mean ± the standard deviation of three biological replicates performed in triplicate. e Stage by stage Gene Ontology (GO) comparison of differentially regulated genes reveals that classes of genes which correlate with multicellularity are misregulated when comparing Vegetative (V) to Streaming (S) or Fruiting body (F) stages. f A Bland-Altman plot of D. discoideum RNAseq datasets reveals genes which are upregulated and downregulated between unicellular and both multicellular stages. Red dots represent significantly differentially expressed genes, black dots represent not significantly differentially expressed genes. g The top ten GO terms of unicellular enriched (top) or multicellular enriched (bottom) processes reveals genes involved in essential processes are enriched in unicellular D. discoideum and processes required for development, differentiation, communication, and adhesion are enriched in multicellular D. discoideum. Heat maps of transcription factors (h), and chromatin modifying enzymes (i), that display unicellular or multicellular enriched expression are displayed here. An analysis of all transcription factors and all chromatin-modifying enzymes identified in D. discoideum is presented in Additional file 1: Figure S10
Fig. 3
Fig. 3
Comparative epigenomic analysis of S. pombe, unicellular and multicellular D. discoideum, and C. elegans identifies unicellular and multicellular signatures. a The 1000 most highly expressed genes at each life cycle stage display a higher degree of chromatin accessibility than the 1000 most lowly expressed genes at each life cycle stage. ****: p < 0.0001 as assessed by one-way ANOVA. b Representative integrative genomics viewer (IGV) tracks of H3K4me3 (orange), H3K27me3 (purple), ATAC-seq (red), and gene expression (navy) at srfA demonstrates increases in H3K4me3, decreases in H3K27me3, and increased chromatin accessibility at the promoters correlate with increases in gene expression of D. discoideum at four life cycle stages. c A Venn diagram displays the 2473 conserved genes in S. pombe, D. discoideum, and C. elegans. d PCA of orthologous genes illustrates that unicellular enriched gene expressions of D. discoideum cluster closer to S. pombe than to multicellular D. discoideum by the third principal component. e Single-cell RNA sequencing analysis of vegetative (blue), slug (yellow), and fruiting body (orange) cells reveals unique gene expression signatures of different stage D. discoideum. Uniform manifold approximation and projection (UMAP) is displayed for visual representation. f Single-cell RNAseq expression correlates highly with bulk RNAseq expression as exemplified by 67 “unicellular” genes and 52 “multicellular” genes. The 67 genes represented are accessible and expressed in unicellular D. discoideum and S. pombe but not in multicellular D. discoideum and C. elegans and the 52 genes represented display the opposite accessibility and expression as identified from orthologous gene analysis of bulk RNAseq and ATACseq datasets. Highlighted in bold are the genes which we knocked out in this study. g The 100 genes whose expression changes allow for the quantitative measurement of progression of D. discoideum from vegetative through slug to fruiting body stages are displayed in this heatmap pseudotime analysis. Expression of srfA, hdaD, ammr1, and smcl1 are also included in this heatmap. Ribosomal gene expression plays an outsized role in determining pseudotime and these genes are marked. h Representative UMAP graphs display the expression levels of srfA, hdaD, ammr1, smcl1, and hspH2 from single cell RNAseq analysis
Fig. 4
Fig. 4
Genes identified as accessible and expressed in multicellular but not unicellular stages and organisms are necessary for multicellularity in D. discoideum. a Representative images illustrating that knock-out of the multicellular genes, hdaD, srfA, ammr1, and smcl1, but not the unicellular gene, hspH2, results in multicellularity delays. Representative images are shown at 8, 16, 21, 25, and 41 h, and the stage is noted in the bottom right hand corner of each image. Scale bars are 20 microns. b Knockout of multicellular genes delays multicellularity (upper graph) and total transition to fruiting body stage (lower graph) but knockout of a unicellular gene does not. This graph represents the mean ± the standard error of the mean of three independent biological replicates performed in triplicate. Ns: not significant, *: p < 0.05, **: p < 0.005, ***: p < 0.001, ****: p < 0.0001 as assessed by multiple comparison one-way ANOVA analysis. c Knockout of srfA but not hdaD or ammr1 caused a reduction in the diameter of the fruiting body as a proxy for the number of cells in each multicellular organism. Knockout of hspH2 caused an increase in the diameter of the fruiting body. This graph represents the mean ± the standard error of the mean of three independent biological replicates performed triplicates. Ns: not significant, *; p < 0.05, **; p < 0.005 as assessed by multiple comparison one-way ANOVA analysis. d Knock-out of multicellular genes: hdaD, ammr1, and smcl1 had no effect on chemotaxis while knock-out of srfA and unicellular gene hspH2 decrease the chemotaxis capacity of D. discoideum. The bar graph represents the mean ± the standard error of the mean of three biological replicates performed in triplicate. The number of cells which migrated towards the 30° segment containing the location where 250 μM folate was placed was counted. Ns: not significant, *: p < 0.05, **: p < 0.005 as assessed by multiple comparison one-way ANOVA analysis. e Knock-out of unicellular and multicellular genes had no effect on cell viability as assessed by PI staining. All knock-out strains responded similarly to the WT strain in response to 95 °C heat shock for 50 seconds. Each bar represents the mean ± the standard deviation of three biological replicates. Ns: not significant as assessed by one-way ANOVA analysis
Fig. 5
Fig. 5
smcl1 overexpression is sufficient for multicellularity in D. discoideum and HdaD is an H3K27 deacetylase. a Representative pictures of D. discoideum cellular stages on KK2 plates show multicellularity delay after overexpression of smcl1 at 8, 16, 21, 25, and 41 h. Stage is displayed in the lower right hand corner. Scale bars are 20 microns. b Overexpression of smcl1 delays D. discoideum multicellularity, time to mound stage is shown in the graph on top and complete progression to fruiting body stage is shown in the graph on the bottom. Each column represents the mean ± the standard error of the mean of three biological replicates performed in triplicate. ***: p < 0.0005, ****: p < 0.0001, as assessed by unpaired t test. c Representative pictures of D. discoideum show increased size of mound (top) and fruiting body (bottom) after overexpression of smcl1. Scale bars are 20 microns. d Overexpression of smcl1 was sufficient to increase the size of mound (top) and fruiting body (bottom) diameter. Each column represents the mean ± the standard error of the mean of 54-67 D. discoideum multicellular organisms. ****: p < 0.0001 as assessed by unpaired t test. e Overexpression of smcl1 was sufficient to increase the number of cells in each fruiting body. Each column represents the mean ± the standard error of the mean of 14–15 D. discoideum fruiting bodies. ****: p < 0.0001 as assessed by unpaired t test. f Representative western blots demonstrate an increase in H3K27ac in hdaD knock-out strains. Two independent biological replicates are displayed with the upper blot probed with H3K27ac and the bottom blot probed with Histone H3 antibodies. g hdaD overexpression causes a decrease in H3K27ac as assessed by western blot. h His-tagged HdaD catalytic domain (His:HdaDcatalytic) but not GST-tagged RPA-2 is able to deacetylate lysine 27 of histones purified from Dictyostelium. This western blot is representative of 3 independent experiments. i, j Electron microscopy reveals that TSA treatment and hdaD knock-out strains have a decrease in heterochromatin. Representative images are shown (i) and quantification of 30 images (j). The scale bars represent 500 nm. % heterochromatin was calculated by examining the condensed chromatin which appears darker in the nucleus (outlined in yellow) while excluding the nucleolus (outlined in blue) from calculations. Examples of heterochromatin are marked by a red arrow. Representative images of hdaD overexpression and quantification of the nucleolus diameter in all 30 images are displayed in Additional file 1: Figure S15

References

    1. Herron MD, Rashidi A, Shelton DE, Driscoll WW. Cellular differentiation and individuality in the 'minor' multicellular taxa. Biol Rev Camb Philos Soc. 2013;88:844–861. - PMC - PubMed
    1. Grosberg RK, Strathmann RR. The evolution of multicellularity: a minor major transition? Annu Rev Ecol Evol Syst. 2007;38:621–654.
    1. King N. The unicellular ancestry of animal development. Dev Cell. 2004;7:313–325. - PubMed
    1. Rokas A. The origins of multicellularity and the early history of the genetic toolkit for animal development. Annu Rev Genet. 2008;42:235–251. - PubMed
    1. Olson BJ. Multicellularity: from brief encounters to lifelong unions. Elife. 2013;2:e01893. - PMC - PubMed

Publication types