. 2021 Oct;11(10):2456-2473.
doi: 10.1158/2159-8290.CD-20-0725. Epub 2021 May 4.

Induction of APOBEC3 Exacerbates DNA Replication Stress and Chromosomal Instability in Early Breast and Lung Cancer Evolution

Affiliations

Induction of APOBEC3 Exacerbates DNA Replication Stress and Chromosomal Instability in Early Breast and Lung Cancer Evolution

Subramanian Venkatesan et al. Cancer Discov. 2021 Oct.

Abstract

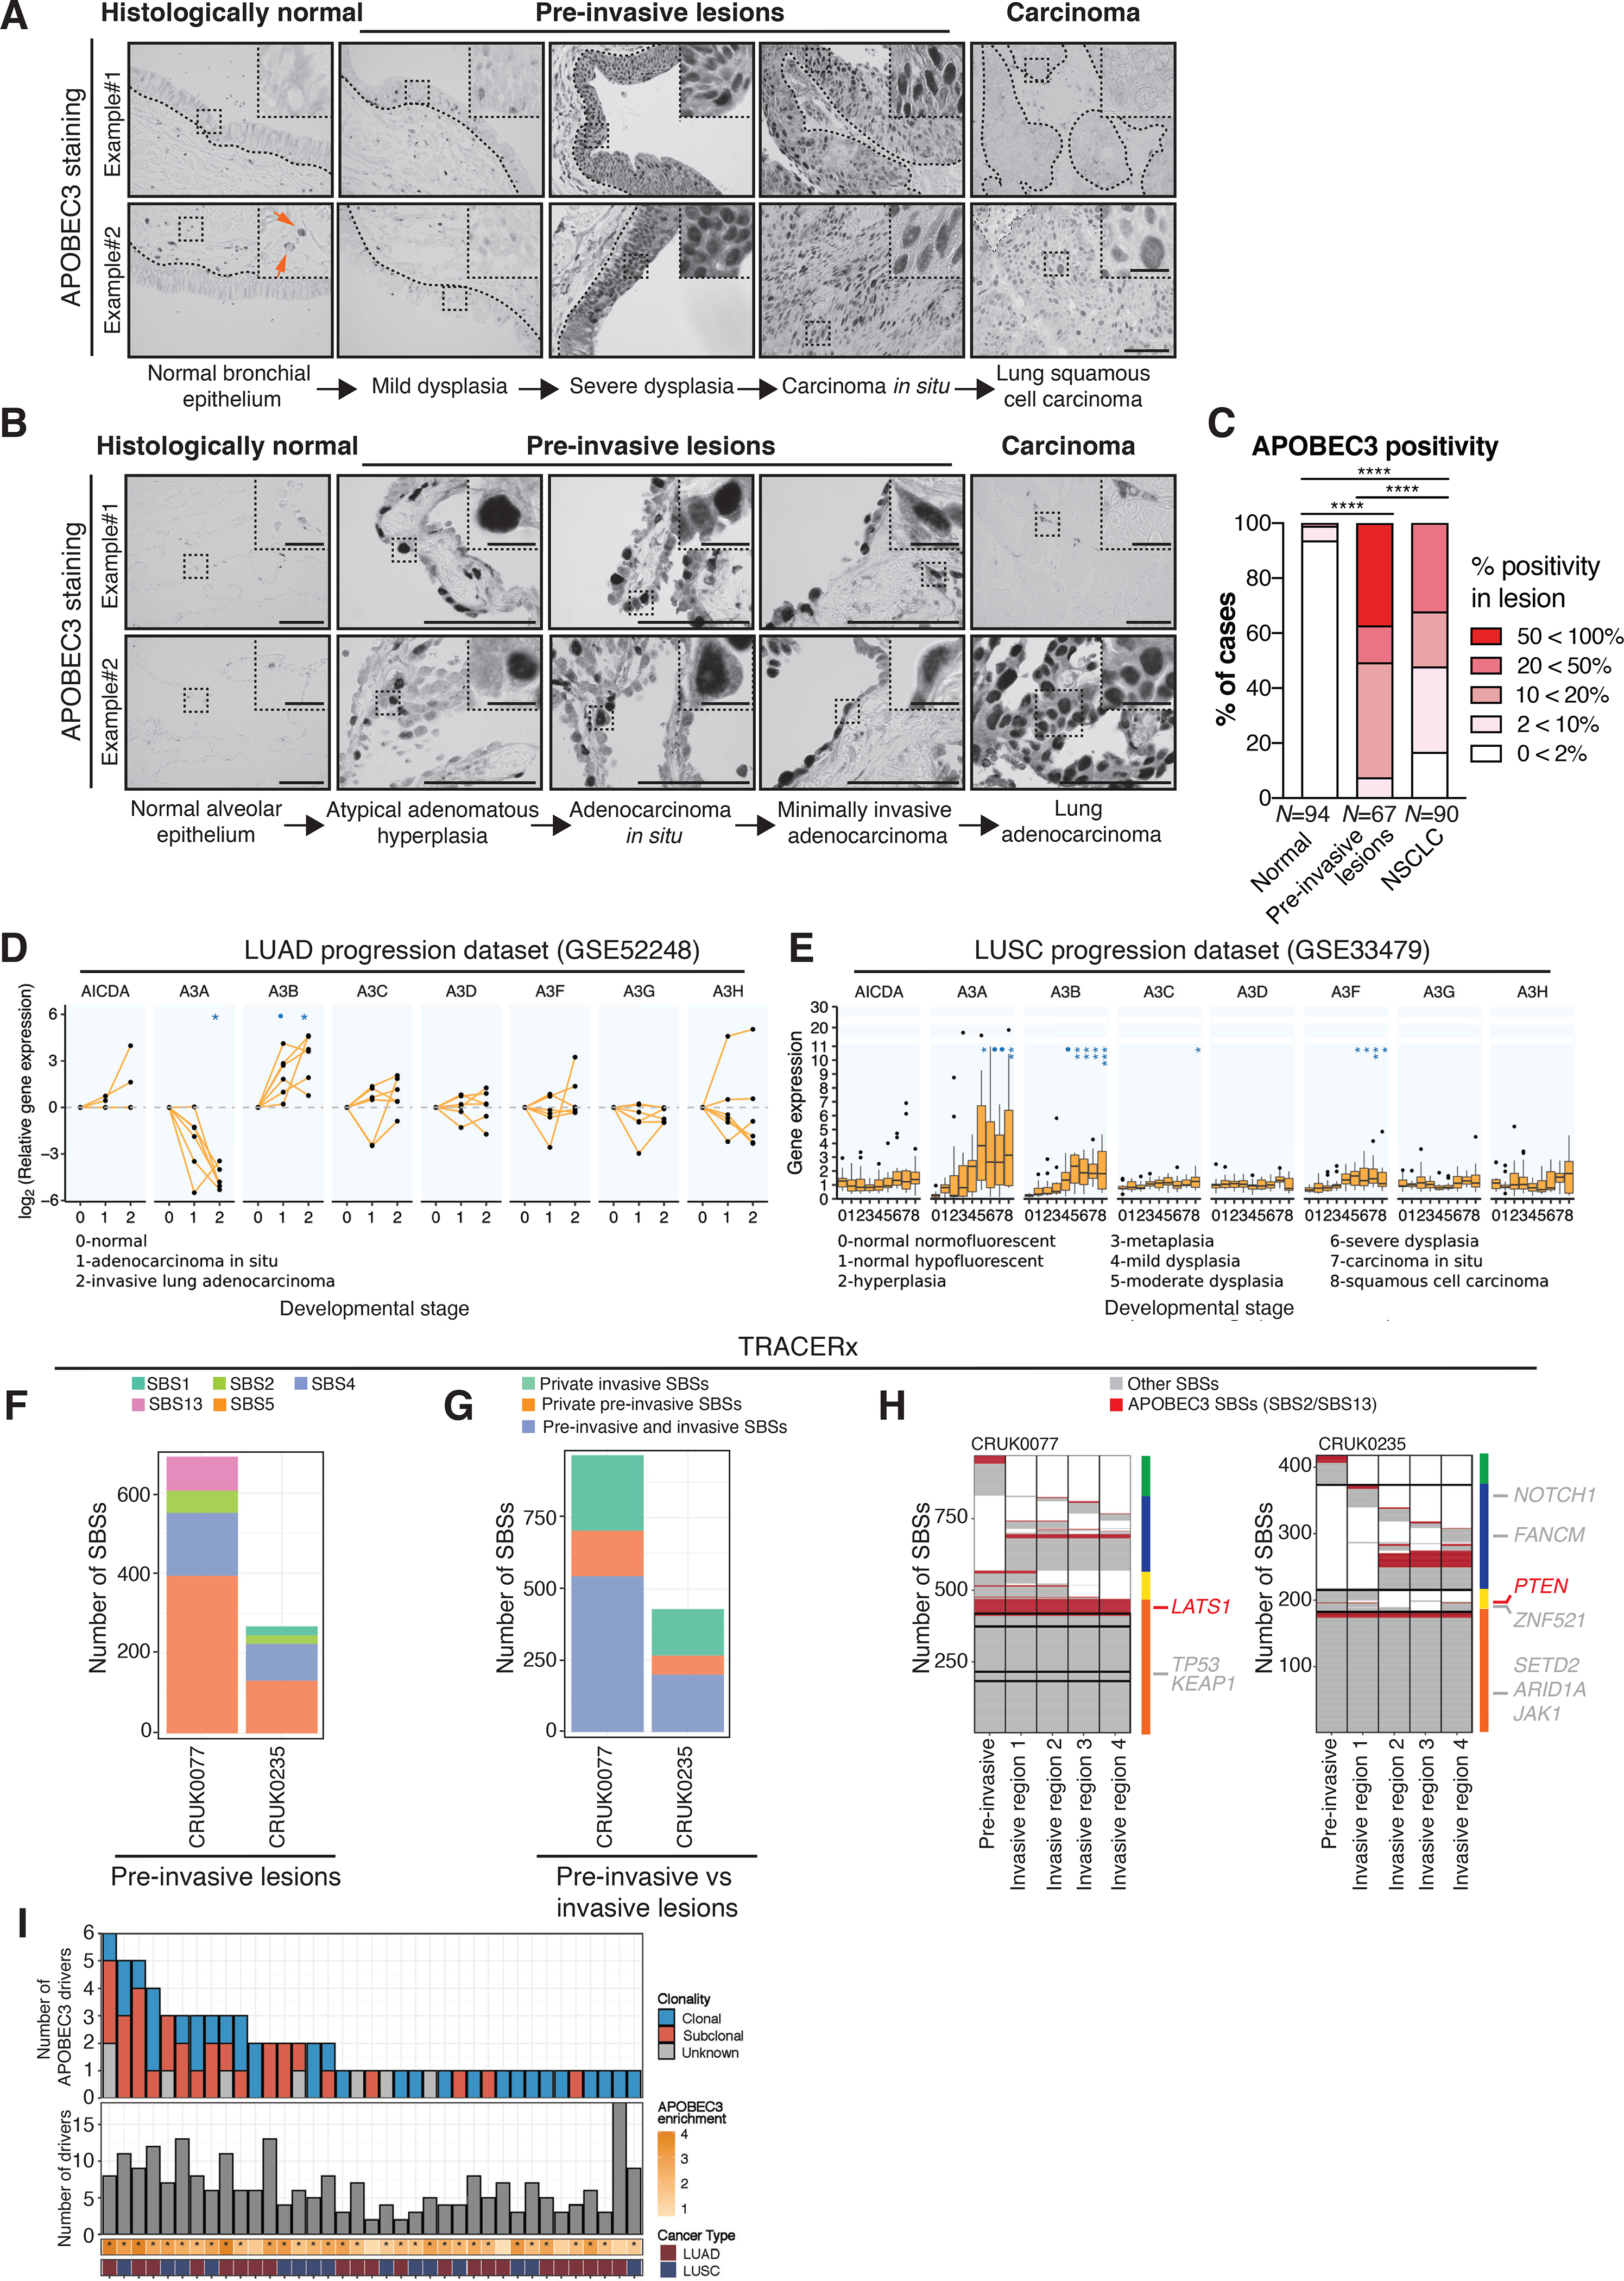
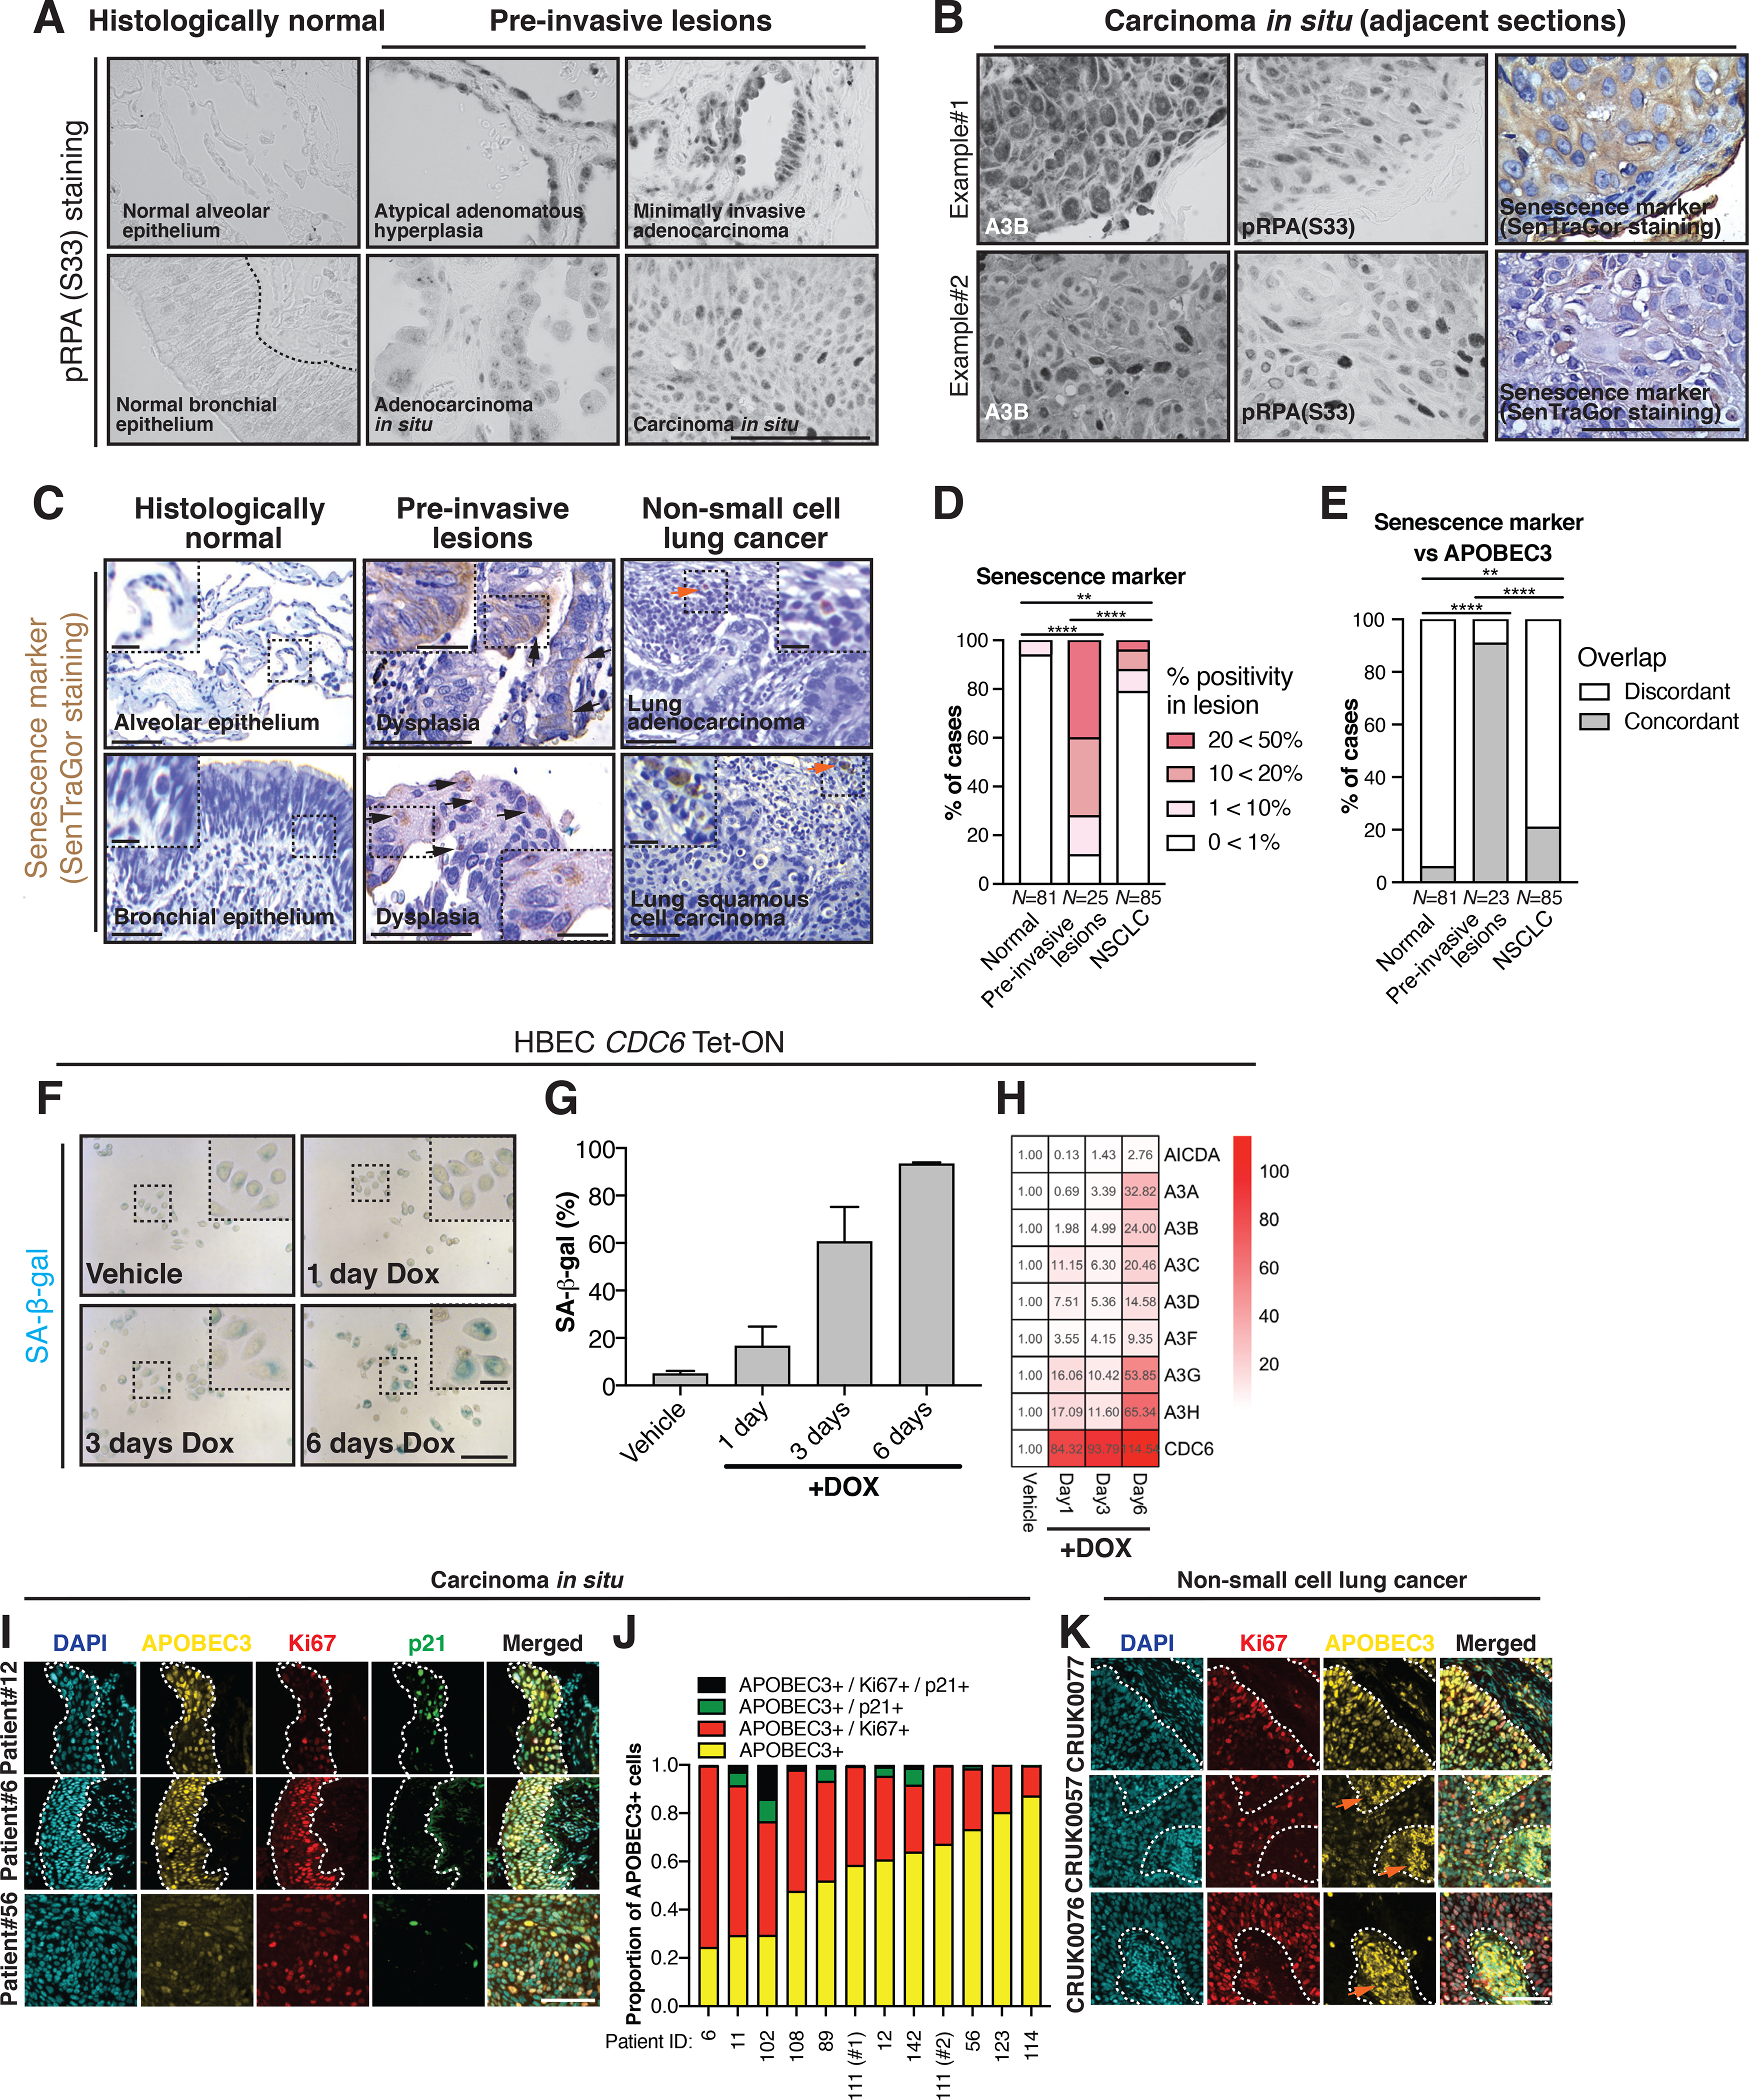
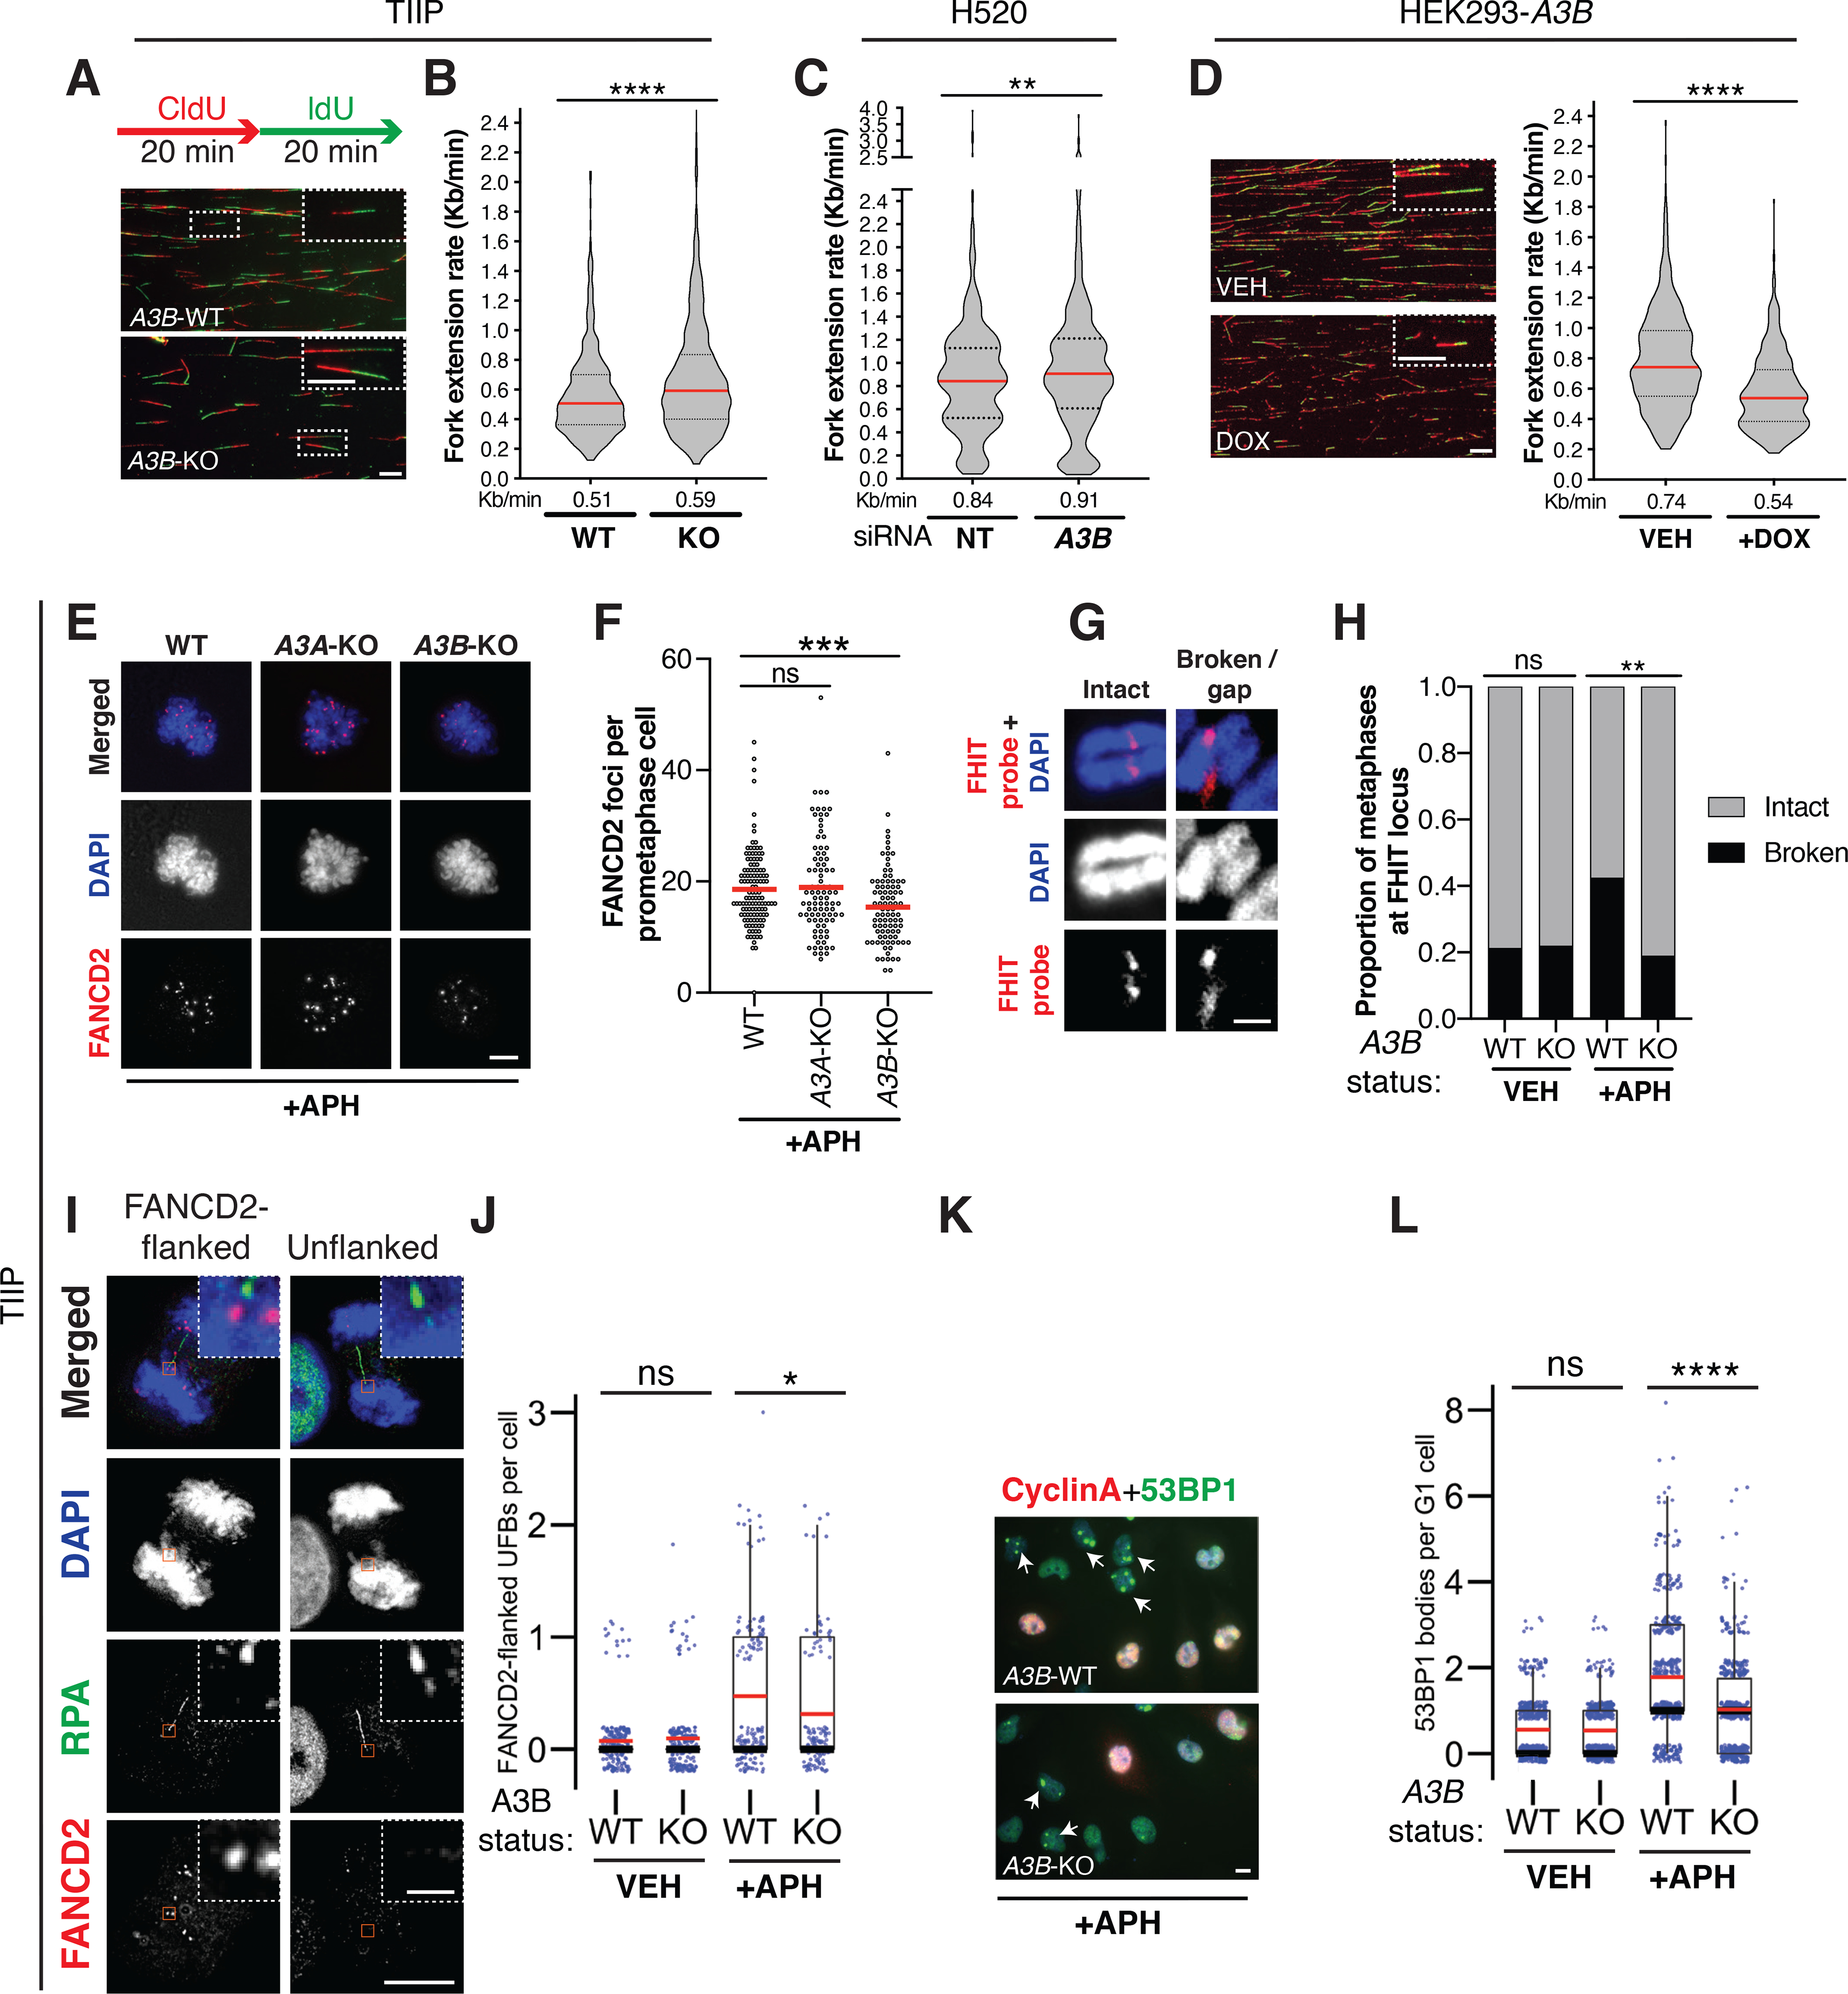
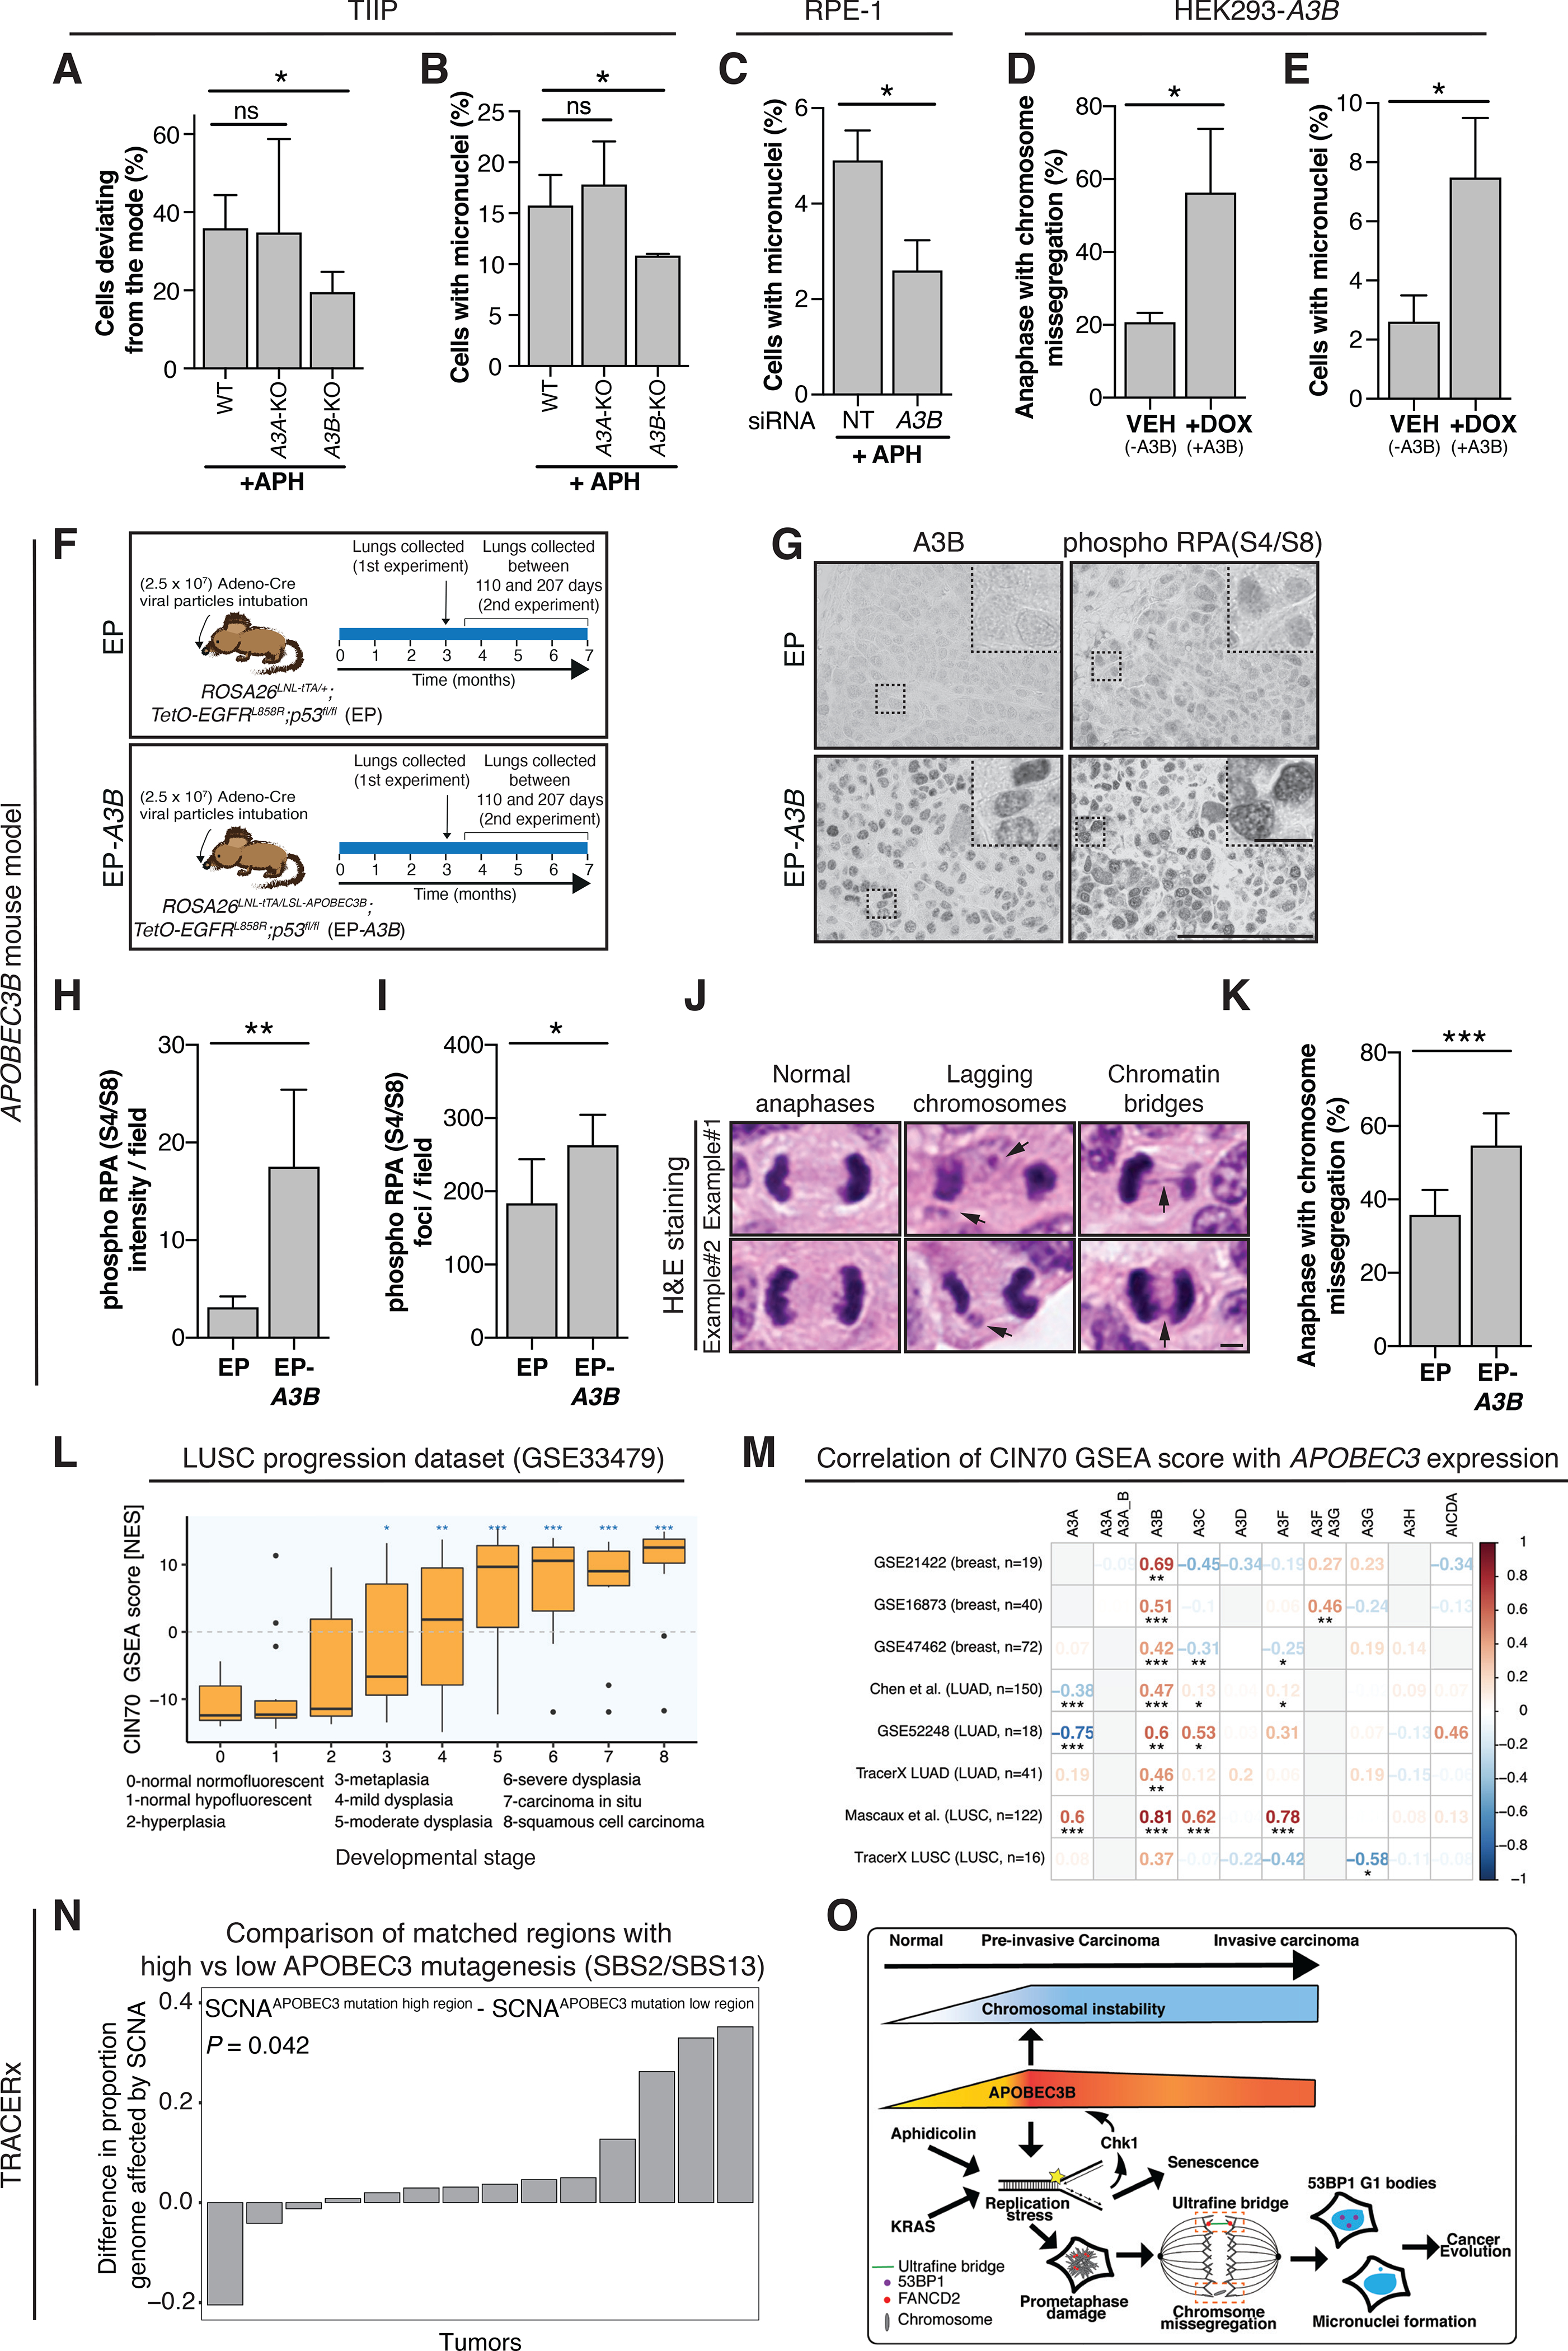
APOBEC3 enzymes are cytosine deaminases implicated in cancer. Precisely when APOBEC3 expression is induced during cancer development remains to be defined. Here we show that specific APOBEC3 genes are upregulated in breast ductal carcinoma in situ, and in preinvasive lung cancer lesions coincident with cellular proliferation. We observe evidence of APOBEC3-mediated subclonal mutagenesis propagated from TRACERx preinvasive to invasive non-small cell lung cancer (NSCLC) lesions. We find that APOBEC3B exacerbates DNA replication stress and chromosomal instability through incomplete replication of genomic DNA, manifested by accumulation of mitotic ultrafine bridges and 53BP1 nuclear bodies in the G1 phase of the cell cycle. Analysis of TRACERx NSCLC clinical samples and mouse lung cancer models revealed APOBEC3B expression driving replication stress and chromosome missegregation. We propose that APOBEC3 is functionally implicated in the onset of chromosomal instability and somatic mutational heterogeneity in preinvasive disease, providing fuel for selection early in cancer evolution. SIGNIFICANCE: This study reveals the dynamics and drivers of APOBEC3 gene expression in preinvasive disease and the exacerbation of cellular diversity by APOBEC3B through DNA replication stress to promote chromosomal instability early in cancer evolution.This article is highlighted in the In This Issue feature, p. 2355.


Figures

Figure 1.
Figure 1.. APOBEC3 expression increases during early NSCLC evolution.
A-B, Representative images from 2 different samples with APOBEC3 immunohistochemistry in normal lung epithelium, pre-invasive lesions, LUSC and LUAD. Note the nuclear APOBEC3 staining in epithelial cells, which is indicative of A3B and potentially also A3A staining. The samples originate from NSCLC patients from the TRACERx 100 cohort (1), the UCLH Surveillance Study (29) and a Danish cohort of NSCLC patients. The orange arrows indicate stromal cells that have cytoplasmic APOBEC3 staining, which is indicative of A3G and A3A. The black dotted lines indicate the epithelial lining. C, Summary of APOBEC3 nuclear positivity in NSCLC development as assessed by immunohistochemistry. Percentage of cases scoring between 0<2%, 2<10%, 10<20%, 20<50% and 50<100% APOBEC3 positivity in each category are shown (N = 251 cases in total). The number of cases scoring >10% nuclear positivity was compared between each group (two-tailed Fisher’s exact test, ****P ≤ 0.0001). D, APOBEC3 gene expression during different stages of LUAD relative to normal tissue (N = 18 samples, linear mixed-effects model, •(blue dot)FDR ≤ 0.1, *FDR ≤ 0.05). Each dot represents a sample. The connected dots represent samples from the same patient. E, APOBEC3 gene expression during different stages of LUSC carcinogenesis. The boxplots represent median ± 1st and 3rd quartiles, P-values are FDR-adjusted for multiple comparison (N = 122 samples from 77 patients, linear mixed-effects model, •(blue dot)FDR ≤ 0.1, *FDR ≤ 0.05, **FDR ≤ 0.01, ***FDR ≤ 0.001). F, Number of SBSs as detected by whole-exome sequencing (WES) in 2 pre-invasive NSCLC lesions. Each color represents a different SBS signature. G, Number of SBSs in the 2 synchronous patient-matched pre-invasive and invasive NSCLCs that are ubiquitous between the pre-invasive and invasive lesion or private (i.e. exclusive) to the pre-invasive or invasive lesion, respectively. H, Heat maps show the distribution of APOBEC3- (red) and non-APOBEC3-mediated (grey) SBSs. Columns next to the heat maps show the SBS distribution, which are either present in both the pre-invasive and all invasive regions (orange), present in both the pre-invasive but not all invasive regions (yellow), private to the invasive lesion (blue) or private to the pre-invasive lesion (green). Driver mutations are shown next to the heat map, indicating in which region they are present (in non-APOBEC3 context, grey; in APOBEC3 context, red). I, Overview of the total number of driver mutations (bottom panel) and the number of driver mutations in the APOBEC3 context (top panel). Asterisks indicate significant enrichment for APOBEC3 signature mutations (two-tailed Fisher’s exact test, P ≤ 0.05). Scale bars, 100 μm. Scale bar in inset magnification, 25 μm.
Figure 2.
Figure 2.. APOBEC3 expression increases during either replication stress-associated senescence or proliferation.
A, Representative examples of pRPA(S33) staining in different types of pre-invasive lesions. The following pre-invasive lesions were stained: N = 5 AAH, N = 13 AIS, N = 6 MIA and N = 15 CIS samples. B, Representative example of adjacent 4 μm thick sections of a CIS with pRPA(S33), SenTraGor and APOBEC3 immunohistochemistry. Immunohistochemistry was performed on a subset of pre-invasive lesions that contained enough tissue (N = 15 CIS samples). C, Representative examples of senescent cell detection by SenTraGor staining in normal lung epithelium, pre-invasive lesions and NSCLC. Black and orange arrowheads indicate SenTraGor-positive epithelial and stromal cells, respectively. D, Percentage of cases scoring 0<1%, 1<10%, 10<20%, 20<50% in each category. N = 191 samples (two-tailed Fisher’s exact test, **P ≤ 0.01; ****P ≤ 0.0001). E, APOBEC3-positive lesions were assessed for the presence of SenTraGor-positive cells. Concordance between SenTraGor and APOBEC3 staining (N = 189 samples, two-tailed Fisher’s exact test, **P ≤ 0.01; ****P ≤ 0.0001). Within the adjacent anti-APOBEC3 stained sections, 2 pre-invasive lesions were missing and thus were unevaluable. F, Representative images of SA-β-gal staining of HBEC CDC6 Tet-ON cells. G, Quantification of SA-β-gal positive cells. Results represent mean ± SD, N = 3 independent experiments. H, Relative changes in APOBEC3 gene expression compared to vehicle-treated condition as assessed by qRT-PCR. Results represent mean, N = 3 independent experiments. I, Representative examples of a triple immunofluorescence stain for APOBEC3, Ki67 and p21 in lung CIS samples. The dashed white line is drawn around the epithelium. J, Proportion of APOBEC3-positive cells that also stained positive for Ki67 and/or p21. Note patient 111 has been biopsied twice with an interval of 2 years. K, Representative examples of a double immunofluorescence staining for APOBEC3 and Ki67 (p21 was not evaluable) in NSCLC. Example regions within sections are shown originating from different patients with relatively high (CRUK077), moderate (CRUK0057) and low (CRUK0076) APOBEC3 immunofluorescence. The dashed white line separates the tumor cells from the tumor stroma. Note the nuclear APOBEC3 staining in epithelial cells, which is indicative of A3B and A3A staining. The orange arrows indicate stromal cells with cytoplasmic APOBEC3 staining, which is derived from A3G and A3A. Scale bars, 100 μm. Scale bars in inset magnification, 25 μm.
Figure 3.
Figure 3.. APOBEC3B contributes to the accumulation of under-replicated DNA through replication stress.
A-D, 20 min sequential labeling pulses of CIdU (red) and IdU (green) were subjected to DNA fiber stretching analysis. Representative images of DNA fibers are shown. DNA fiber stretching analysis of TIIP (WT and A3B-KO#clone13), H520 and HEK293-A3B cells. A minimum of 530 tracts were measured per condition. Results represent median (red) ± 1st and 3rd quartiles (black), N = 3 independent experiments (two-tailed Mann-Whitney test, **P ≤ 0.01; ****P ≤ 0.0001). Scale bars, 10 μm and in inset magnification, 100 μm. E, Representative images of FANCD2 foci in TIIP prometaphase cells. F, A minimum of 75 prometaphase cells were assessed per condition. Results represent mean, N = 3 independent experiments (two-tailed Mann-Whitney test, ***P ≤ 0.001). Scale bar, 10 μm. G, Representative images of chromosome 3 without and with a break/gap at the FHIT locus. Scale bar, 1 μm. H, Proportion of cells with an intact or broken chromosome 3 at the FHIT locus. At least 68 metaphases were evaluated per condition. N = 2 independent experiments (two-tailed Fisher’s exact test, **P ≤ 0.01). I, Representative images of RPA-positive ultrafine bridges (UFBs) either unflanked or flanked by FANCD2-positive foci. Scale bar, 10 μm and in inset magnification, 1 μm. J, Number of FANCD2-flanked UFBs per anaphase cell. A minimum of 115 anaphase cells were assessed per condition. Boxplots represent mean (red), median (black) ± 1st and 3rd quartiles (box), N = 3 independent experiments (two-tailed Mann-Whitney test, *P ≤ 0.05). K, Representative images of 53BP1 nuclear bodies in the G1 cell cycle phase (53BP1-positive foci in Cyclin A-negative cells) in TIIP cells. Scale bar, 10 μm. L, A minimum of 400 cells were assessed per condition. Boxplots represent mean (red), median (black) ± 1st and 3rd quartiles (box), N = 3 independent experiments (two-tailed Mann-Whitney test, ****P ≤ 0.0001).
Figure 4.
Figure 4.. APOBEC3B exacerbates chromosomal instability and promotes aneuploidy.
A, Percentage of cells deviating from modal chromosome 15 as assessed by ImageStream-FISH. Approximately 4000 cells were assessed per condition. Results represent mean ± SD, N = 4 independent experiments (two-tailed unpaired t-test, *P ≤ 0.05). B-C, Percentage of cells with micronuclei. A minimum of 450 cells per condition were assessed. Results represent mean ± SD, N = 3 independent experiments (two-tailed unpaired t-test, *P ≤ 0.05). D, A minimum of 130 anaphases were assessed per condition. Results represent mean ± SD, N = 3 independent experiments (two-tailed unpaired t-test, *P ≤ 0.05). E, Percentage of cells with micronuclei. A minimum of 450 cells per condition were assessed. Results represent mean ± SD, N = 3 independent experiments (two-tailed unpaired t-test, *P ≤ 0.05). F, Tumors were induced in the lungs of EGFRL858R;Tp53flox/flox (EP; N = 7) or EGFRL858R;Tp53flox/flox;R26LSL-A3B/LSL-tTA mice (EP-A3B; N = 8, 2 combined experiments) (Fig. 4F). Lungs were harvested either at 3 months in 1 experiment or at termination in an additional experiment (between 110 and 207 days). G, Representative examples of A3B and pRPA(S4/S8) immunohistochemistry in lung cancers derived from EP and EP-A3B mice. Scale bar, 100 μm and in inset magnification, 25 μm. H, Intensity of pRPA(S4/S8) staining. Results represent mean ± SD, N = 6 mice per group (two-tailed unpaired t-test, **P ≤ 0.01). I, Number of pRPA(S4/S8) foci per field. Results represent mean ± SD, N = 6 mice per group (two-tailed unpaired t-test, *P ≤ 0.05). J, Representative images of anaphase cells that were assessed for the presence of lagging chromosomes and chromatin bridges within H&E sections of EP and EP-A3B lung cancers. Scale bar, 5 μm. K, Results represent mean ± SD, N = 7 EP and N = 8 EP-A3B mice (Mann-Whitney test, ***P ≤ 0.001). L, CIN70 GSEA scores at different stages of LUSC. Boxplots represent median ± 1st and 3rd quartiles, (linear mixed-effects model, *FDR ≤ 0.05, **FDR ≤ 0.01, ***FDR ≤ 0.001). M, Heatmap of the Spearman correlation coefficients between the CIN70 GSEA score and APOBEC3 mRNA expression per dataset. (Spearman correlation, *P ≤ 0.05, **P ≤ 0.01, ***P ≤ 0.001). N, For tumors of the lung TRACERx cohort, the proportion of the genome affected by SCNAs of regions with a higher number of APOBEC3 signature mutations were compared to those with a relatively lower number of APOBEC3 signature mutations (two-tailed paired Wilcoxon test). Only tumors with a significant difference in APOBEC3 mutations between the 2 tumor regions were considered in this analysis (N = 14). Each comparison is confined to within-tumor regions and is represented by a bar. O, Model of A3B contributing to CIN early in lung cancer development. A3B exacerbates aphidicolin and KRAS-induced replication stress, hindering the complete replication of the genome. Persistent regions of under-replicated DNA lead to the formation of UFBs during mitosis. After mitosis the resolved UFBs contribute to the formation of 53BP1 nuclear bodies and missegregated chromosomes contribute to the formation of micronuclei.

References

    1. Jamal-Hanjani M, Wilson GA, McGranahan N, Birkbak NJ, Watkins TBK, Veeriah S, et al.Tracking the Evolution of Non-Small-Cell Lung Cancer. N Engl J Med 2017;376(22):2109–21 doi 10.1056/NEJMoa1616288. - DOI - PubMed
    1. Alexandrov LB, Kim J, Haradhvala NJ, Huang MN, Tian Ng AW, Wu Y, et al.The repertoire of mutational signatures in human cancer. Nature 2020;578(7793):94–101 doi 10.1038/s41586-020-1943-3. - DOI - PMC - PubMed
    1. Salter JD, Bennett RP, Smith HC. The APOBEC Protein Family: United by Structure, Divergent in Function. Trends Biochem Sci 2016;41(7):578–94 doi 10.1016/j.tibs.2016.05.001. - DOI - PMC - PubMed
    1. Roberts SA, Lawrence MS, Klimczak LJ, Grimm SA, Fargo D, Stojanov P, et al.An APOBEC cytidine deaminase mutagenesis pattern is widespread in human cancers. Nat Genet 2013;45(9):970–6 doi 10.1038/ng.2702. - DOI - PMC - PubMed
    1. Burns MB, Lackey L, Carpenter MA, Rathore A, Land AM, Leonard B, et al.APOBEC3B is an enzymatic source of mutation in breast cancer. Nature 2013;494(7437):366–70 doi 10.1038/nature11881. - DOI - PMC - PubMed

Publication types

LinkOut - more resources