. 2021 May 4;6(3):e00896-20.
doi: 10.1128/mSystems.00896-20.

Particulate Metabolites and Transcripts Reflect Diel Oscillations of Microbial Activity in the Surface Ocean

Affiliations

Particulate Metabolites and Transcripts Reflect Diel Oscillations of Microbial Activity in the Surface Ocean

Angela K Boysen et al. mSystems. .

Erratum in

Abstract

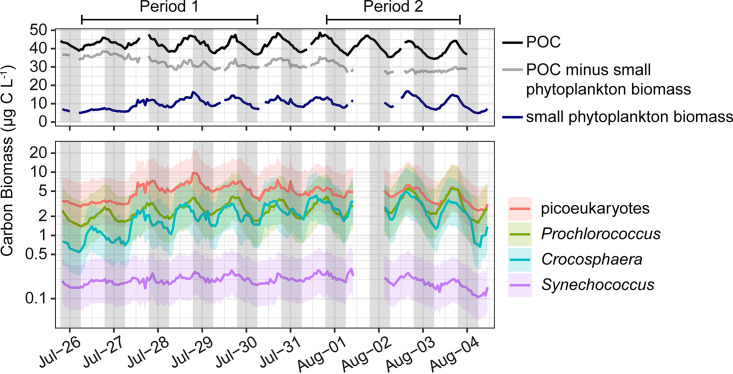
Light fuels photosynthesis and organic matter production by primary producers in the sunlit ocean. The quantity and quality of the organic matter produced influence community function, yet in situ measurements of metabolites, the products of cellular metabolism, over the diel cycle are lacking. We evaluated community-level biochemical consequences of oscillations of light in the North Pacific Subtropical Gyre by quantifying 79 metabolites in particulate organic matter from 15 m every 4 h over 8 days. Total particulate metabolite concentration peaked at dusk and represented up to 2% of total particulate organic carbon (POC). The concentrations of 55/79 (70%) individual metabolites exhibited significant 24-h periodicity, with daily fold changes from 1.6 to 12.8, often greater than those of POC and flow cytometry-resolvable biomass, which ranged from 1.2 to 2.8. Paired metatranscriptome analysis revealed the taxa involved in production and consumption of a subset of metabolites. Primary metabolites involved in anabolism and redox maintenance had significant 24-h periodicity and diverse organisms exhibited diel periodicity in transcript abundance associated with these metabolites. Compounds with osmotic properties displayed the largest oscillations in concentration, implying rapid turnover and supporting prior evidence of functions beyond cell turgor maintenance. The large daily oscillation of trehalose paired with metatranscriptome and culture data showed that trehalose is produced by the nitrogen-fixing cyanobacterium Crocosphaera, likely to store energy for nighttime metabolism. Together, paired measurements of particulate metabolites and transcripts resolve strategies that microbes use to manage daily energy and redox oscillations and highlight dynamic metabolites with cryptic roles in marine microbial ecosystems.IMPORTANCE Fueled by light, phytoplankton produce the organic matter that supports ocean ecosystems and carbon sequestration. Ocean change impacts microbial metabolism with repercussions for biogeochemical cycling. As the small molecule products of cellular metabolism, metabolites often change rapidly in response to environmental conditions and form the basis of energy and nutrient management and storage within cells. By pairing measurements of metabolites and gene expression in the stratified surface ocean, we reveal strategies of microbial energy management over the day-night cycle and hypothesize that oscillating metabolites are important substrates for dark respiration by phytoplankton. These high-resolution diel measurements of in situ metabolite concentrations form the basis for future work into the specific roles these compounds play in marine microbial communities.

Keywords: North Pacific; diel cycles; metabolomics; microbial ecology; oceanography; osmolytes; phytoplankton; transcriptomics.


Figures

FIG 1
FIG 1
Top: Hourly averages of POC from beam attenuation (black line, RAIN FDR-corrected P < 0.001), total phytoplankton carbon biomass from flow cytometry (small phytoplankton biomass, navy line, RAIN FDR-corrected P < 0.001), and the difference between the two (gray line, RAIN FDR-corrected P > 0.05). Bottom: Hourly averages of population specific carbon biomass of Prochlorococcus, Synechococcus, Crocosphaera, and photosynthetic picoeukaryotes (defined here as 2 to 4 μm) from flow cytometry, with shaded area representing the 95% confidence interval (RAIN FDR-corrected P < 0.001 for all four populations); note the log10-scaled y axis. Breaks in the lines are due to short periods of instrument malfunction and removal of large spikes. The two sampling periods referred to in the text are indicated above the figure.
FIG 2
FIG 2
Average targeted metabolite composition at dawn (06:00) and dusk (18:00) from July 26 to July 28 (triplicate samples per time point over 3 days results in n =9 for each time point), shown as the estimated particulate metabolite concentration (nmol liter−1) (A), the percentage of particulate organic carbon (B), and the percentage of the particulate nitrogen (C). “Other” contains the sum of the rest of the metabolites (64 compounds). Compounds with osmotic properties are in bold. Metabolites are arranged according to their average molar concentration at 6:00. Note the different y axis scales. Standard deviations for these estimates are in Table S2.
FIG 3
FIG 3
Time of day that significantly diel compounds peak in the first sampling period (A). Surface light (photosynthetically active radiation [PAR], ×10 nmol photon m−2 s−1) (B). Heat map showing the z-score standardized concentrations of POC and of metabolites (nmol liter−1) determined to be significantly diel in the first sampling period, arranged by time of peak concentration (C).
FIG 4
FIG 4
Peak time versus average daily fold change for each metabolite (circles, calculated based on concentrations proportional to nmol liter−1) and POC from beam attenuation and phytoplankton biomass from flow cytometry (squares, calculated based on concentrations proportional to μg C liter−1). Gray color indicates the level of significance (FDR-corrected P value) of the 24-h oscillation. Red outlines indicate that the compound is an osmolyte. Select compounds and all biomass estimates are labeled (croco, Crocosphaera; synecho, Synechococcus; prochloro, Prochlorococcus; picoeuks, photosynthetic picoeukaryotes; total phytos, total phytoplankton biomass from underway flow cytometry). Dashed line is at a 2-fold change, which is above that for POC and total picophytoplankton biomass. The inset shows the distribution of fold change in nonsignificant compounds. These compounds were variable in concentration over time even though they do not have significant diel oscillations.
FIG 5
FIG 5
Particulate sucrose (left) and trehalose (right) measured as pmol liter−1 in seawater (top), fmol cell−1 (middle) of Crocosphaera and Prochlorococcus for trehalose and sucrose, respectively, and mg g−1 cell carbon (bottom) of Crocosphaera and Prochlorococcus for trehalose and sucrose, respectively. The light gray vertical shading represents nighttime. The green box in the middle-left panel indicates the range of cellular sucrose quotas measured in triplicate Prochlorococcus MIT1314 cultures harvested midday in exponential growth. The blue points in the middle-right panel indicate the dawn and dusk values measured for trehalose quotas in Crocosphaera watsonii WH8501. In the top panels, the error bars represent one standard deviation around the mean value, including uncertainty from the quantification regression. The error bars in the middle panels represent one standard deviation around the mean. The error bars in the bottom panels represent the 95% confidence interval given the confidence in the biomass quantification from underway flow cytometry.
FIG 6
FIG 6
(A) Diel metabolite concentrations (peak area liter−1, proportional to nmol liter−1) of methionine-cycle compounds, methylthioadenosine, and select osmolytes. Error bars are the standard deviation of biological triplicates. The light gray vertical shading represents nighttime. (B) Left: Time of peak abundance of diel transcripts related to the production or use of select diel osmolytes and primary metabolites. Fill color indicates the phylogenetic lineage of the transcript; outline color indicates whether the transcript is associated with production or consumption of the metabolite. Time of metabolite peak concentration (nmol liter−1) is in black. Right: Proportion of all transcripts and diel transcripts belonging to each taxon. *, does not include select subgroups shown otherwise.

References

    1. Wakeham SG, Lee C, Hedges JI, Hernes PJ, Peterson MJ. 1997. Molecular indicators of diagenetic status in marine organic matter. Geochim Cosmochim Acta 61:5363–5369. doi:10.1016/S0016-7037(97)00312-8. - DOI
    1. Hedges JI, Baldock JA, Gélinas Y, Lee C, Peterson ML, Wakeham SG. 2002. The biochemical and elemental compositions of marine plankton: a NMR perspective. Mar Chem 78:47–63. doi:10.1016/S0304-4203(02)00009-9. - DOI
    1. Moran MA. 2015. The global ocean microbiome. Science 350:aac8455. doi:10.1126/science.aac8455. - DOI - PubMed
    1. Boysen AK, Heal KR, Carlson LT, Ingalls AE. 2018. Best-matched internal standard normalization in liquid chromatography-mass spectrometry metabolomics applied to environmental samples. Anal Chem 90:1363–1369. doi:10.1021/acs.analchem.7b04400. - DOI - PubMed
    1. Yancey PH. 2005. Organic osmolytes as compatible, metabolic and counteracting cytoprotectants in high osmolarity and other stresses. J Exp Biol 208:2819–2830. doi:10.1242/jeb.01730. - DOI - PubMed