. 2021 May 4;12(1):2517.
doi: 10.1038/s41467-021-22730-y.

A hypothalamic-thalamostriatal circuit that controls approach-avoidance conflict in rats

Affiliations

A hypothalamic-thalamostriatal circuit that controls approach-avoidance conflict in rats

D S Engelke et al. Nat Commun. .

Abstract

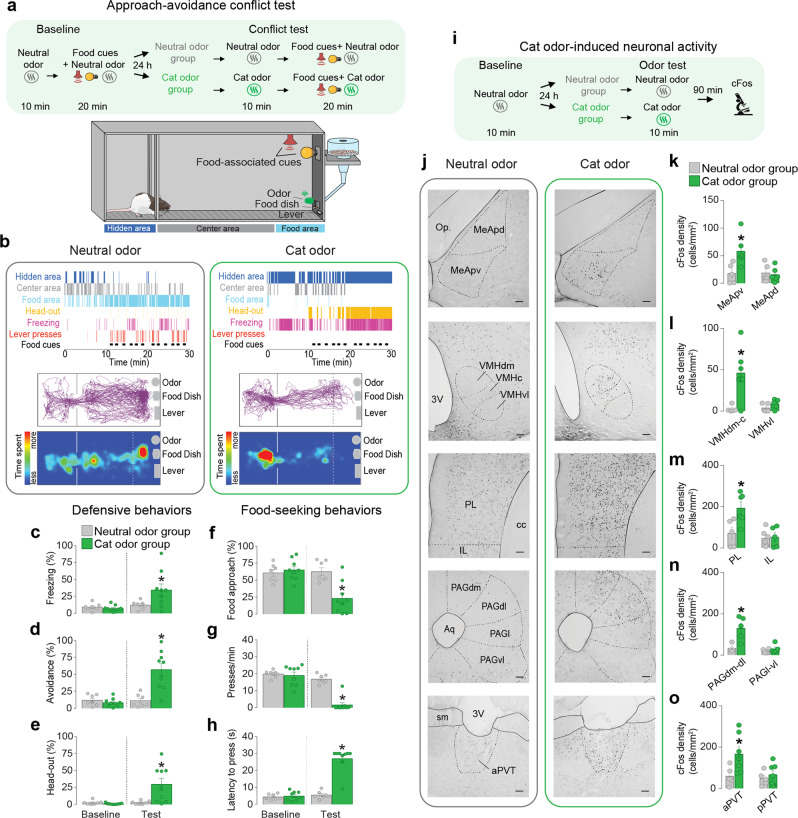
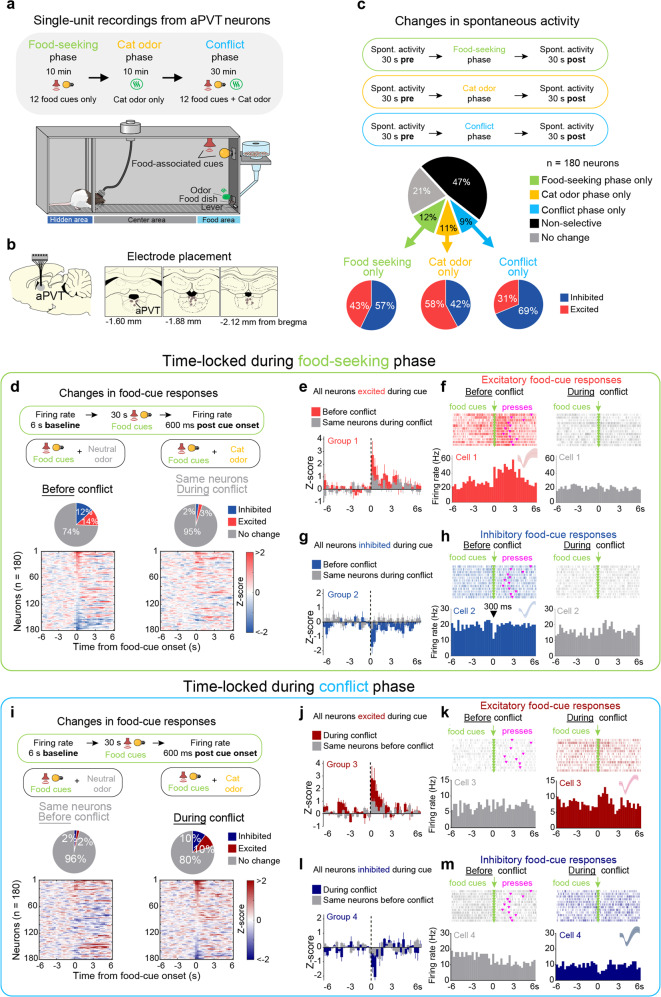
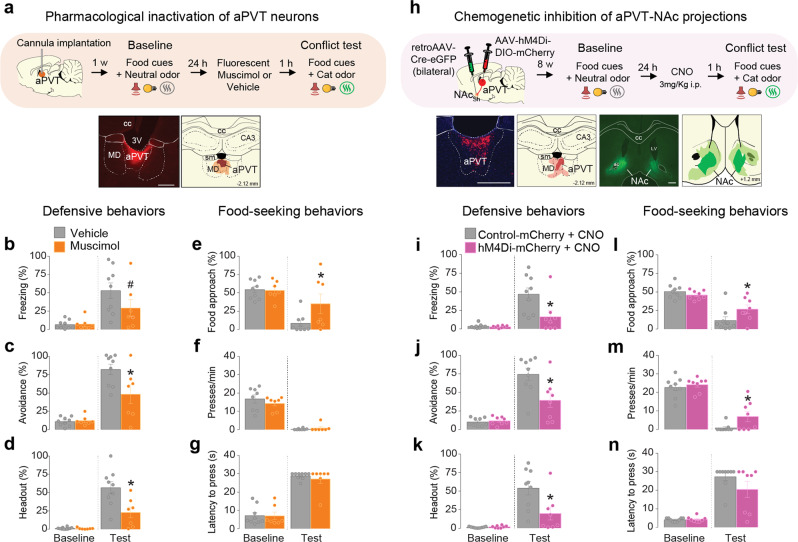
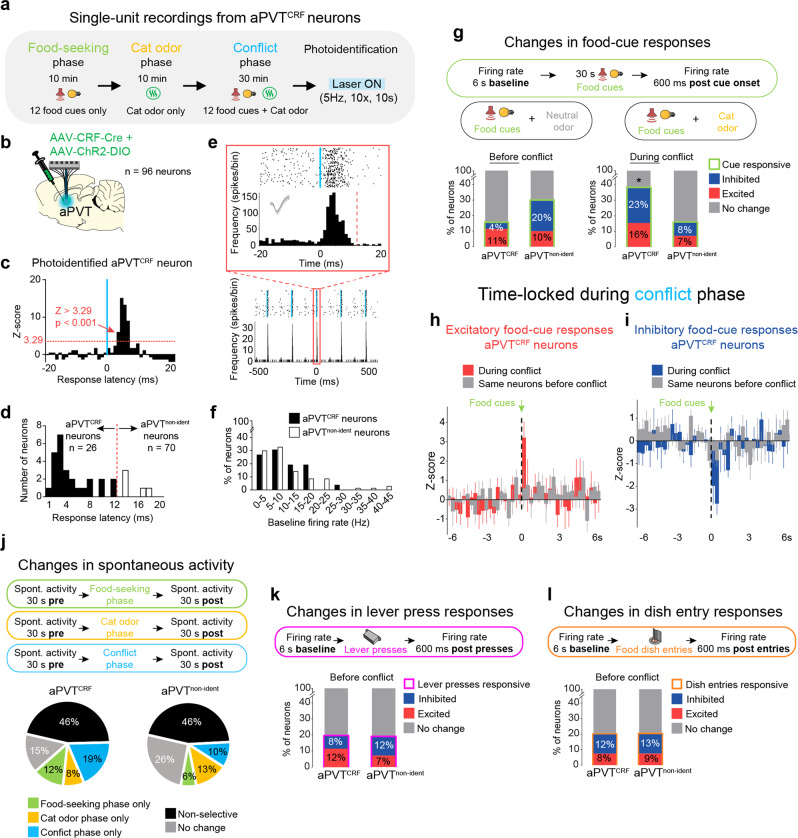
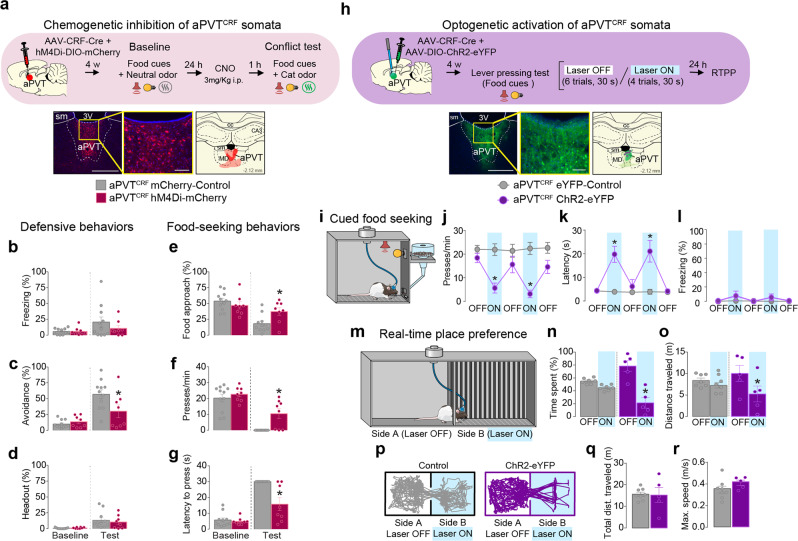
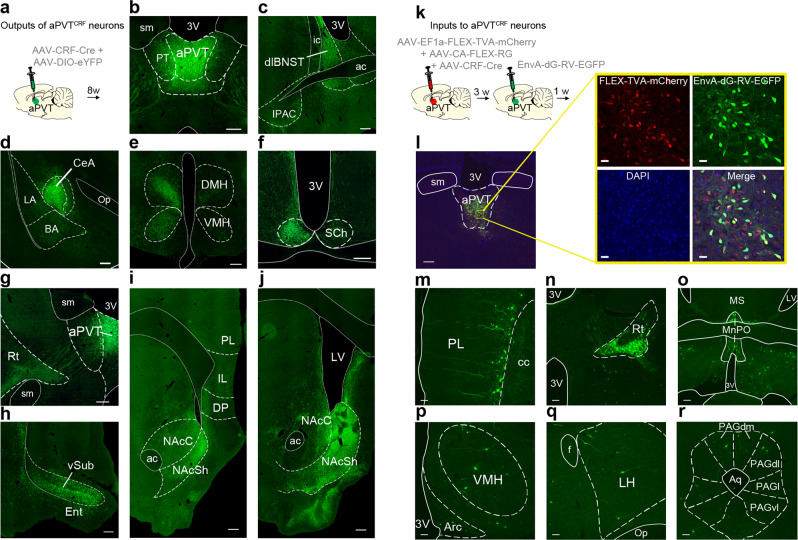
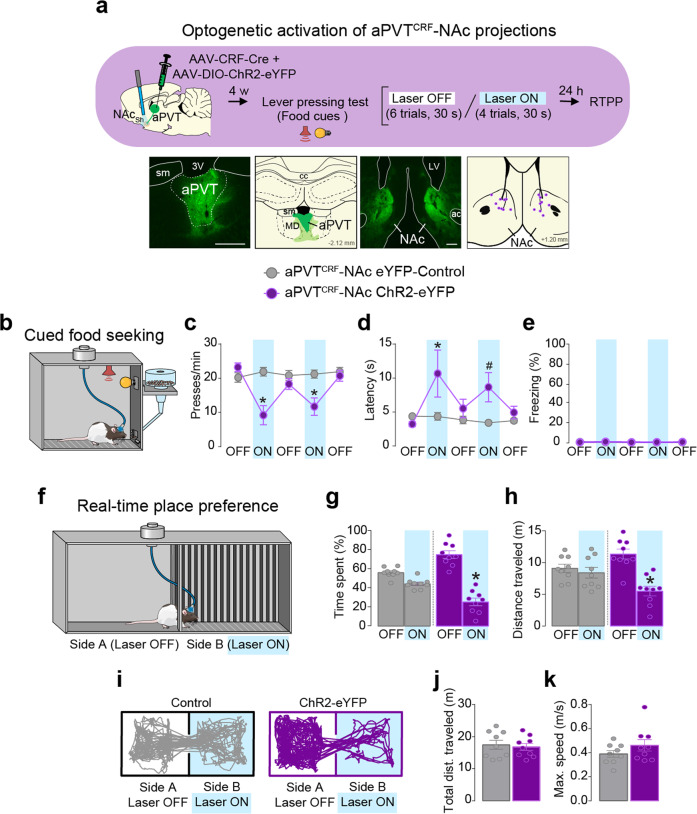
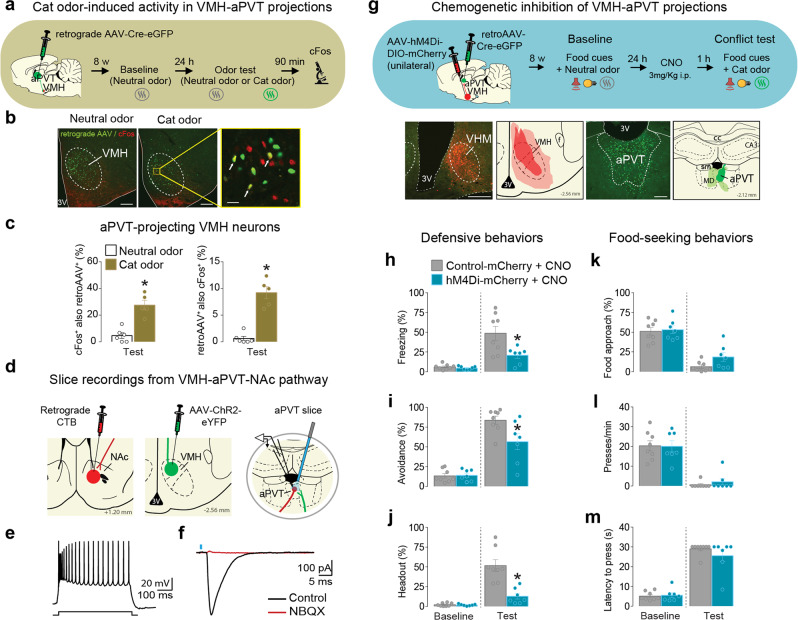
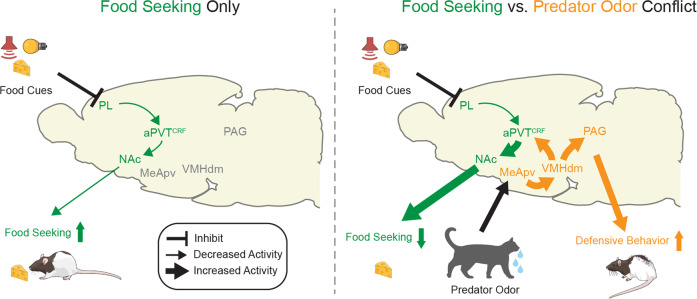
Survival depends on a balance between seeking rewards and avoiding potential threats, but the neural circuits that regulate this motivational conflict remain largely unknown. Using an approach-food vs. avoid-predator threat conflict test in rats, we identified a subpopulation of neurons in the anterior portion of the paraventricular thalamic nucleus (aPVT) which express corticotrophin-releasing factor (CRF) and are preferentially recruited during conflict. Inactivation of aPVTCRF neurons during conflict biases animal's response toward food, whereas activation of these cells recapitulates the food-seeking suppression observed during conflict. aPVTCRF neurons project densely to the nucleus accumbens (NAc), and activity in this pathway reduces food seeking and increases avoidance. In addition, we identified the ventromedial hypothalamus (VMH) as a critical input to aPVTCRF neurons, and demonstrated that VMH-aPVT neurons mediate defensive behaviors exclusively during conflict. Together, our findings describe a hypothalamic-thalamostriatal circuit that suppresses reward-seeking behavior under the competing demands of avoiding threats.


Conflict of interest statement

The authors declare no competing interests.

Figures

Fig. 1
Fig. 1. Cat odor exposure induces defensive behaviors, suppresses food seeking, and increases cFos expression in the aPVT.
a Timeline and schematic of the approach-avoidance conflict test. b Representative ethogram (top), tracks (center), and heatmaps (bottom) of rats exposed to neural odor (left) or cat odor (right). ch During the conflict test, rats exposed to cat odor (green bars, n = 9) showed an increase in the percentage of time exhibiting freezing (F(1, 14) = 5.39, P = 0.035), d avoidance (F(1, 14) = 21.85, P < 0.001), and e head-out responses (F(1, 14) = 7.01, P = 0.019); and a decrease in the percentage of time f approaching the food area (F(1, 14) = 28.31, P < 0.001), a suppression in the number of g lever presses (F(1, 14) = 29.93, P < 0.001), and a prolonged h latency to press the lever (F(1, 14) = 67.27, P < 0.001), when compared to neutral odor controls (gray bars, n = 7; two-way repeated-measures ANOVA followed by Bonferroni post hoc test). i Timeline of the cat odor-induced neuronal activity test. j Representative micrographs of cFos immunoreactivity (dark dots) in neutral odor (left) and cat odor (right) groups. ko Cat odor exposure (green bars, n = 7) increased the number of cFos-positive neurons in k the posteroventral subregion of the medial amygdala (MeApv, P = 0.019, t = 2.834), l the dorsomedial-central subregion of the ventromedial hypothalamus (VMHdm-c, P = 0.0075, t = 3.34), m the prelimbic cortex (PL, P = 0.034, t = 2.44), n the dorsomedial and dorsolateral subregions of the periaqueductal gray matter (PAGdm-dl, P = 0.015, t = 3.195), as well as in the o anterior subregion of the paraventricular nucleus of the thalamus (aPVT, P = 0.039, t = 2.372), when compared to neutral odor controls (gray bars, n = 5, unpaired Student’s t test). pPVT posterior subregion of the paraventricular nucleus of the thalamus, MeApd posterodorsal subregion of the medial amygdala, VMHvl ventrolateral subregion of the ventromedial hypothalamus, IL infralimbic cortex, PAGl lateral subregion of the periaqueductal gray matter, PAGvl ventrolateral subregion of the periaqueductal gray matter. Scale bars: 100 µm. Data are shown as mean ± SEM, *P < 0.05. See also Supplementary Figs. 1, 2, and 3 and Supplementary Movies 1 and 2.
Fig. 2
Fig. 2. aPVT neurons change their firing rates during the approach-avoidance conflict test.
a Timeline and schematic of the approach-avoidance conflict test during single-unit recordings. b Diagram of the electrode placements in the aPVT. c (Top) Schematic of the spontaneous activity recordings. (Center) The percentage of aPVT neurons that changed their spontaneous activity exclusively in response to food-seeking phase, cat odor phase, conflict phase, in more than one phase (nonselective), or did not change. (Bottom) The percentage of aPVT-responsive neurons that were either excited or inhibited after each phase. d (Top) Schematic of the recordings during food-cue-evoked responses. (Center) The percentage of food-cue-responsive neurons selected before the conflict (left) are greater than that of the same neurons that are responsive during the conflict (right; Fisher’s exact test; excitatory before the conflict: 25 neurons, excitatory during the conflict: 5 neurons, P < 0.001; inhibitory before the conflict: 22 neurons, inhibitory during the conflict: 4 neurons, P < 0.001). (Bottom) The normalized firing rate of individual aPVT neurons time-locked for food-cue onset before the conflict (left) and during the conflict (right, Z-score >2.58 for excitatory and <−1.96 for inhibitory responses, first two bins of 300 ms). eh Average peristimulus time histograms (PSTHs) of all aPVT neurons showing e excitatory (n = 21 neurons) or g inhibitory (n = 23 neurons) food-cue responses before the conflict (red or blue) and the same neurons during the conflict (gray). Raster plot and PSTHs of representative aPVT neurons showing f excitatory or h inhibitory food-cue responses before the conflict (red or blue) and the same cells during the conflict (gray). i (Top) Same as d-Top but time-locked for food-cue onset during the conflict phase. The number of both excitatory and inhibitory food-cue-responsive neurons was greater during the conflict compared to before the conflict (Fisher’s exact test, excitatory during the conflict: 18 neurons, excitatory before the conflict: 4 neurons, P = 0.0026; inhibitory during the conflict: 18 neurons, inhibitory before the conflict: 4 neurons, P = 0.0026). (Bottom) Same as d-Bottom but time-locked for food-cue onset during the conflict. jm Average PSTHs of all aPVT neurons showing j excitatory (n = 18 neurons) or l inhibitory (n = 18 neurons) food-cue responses during the conflict (dark red or dark blue) and the same neurons before the conflict (gray). Raster plot and PSTHs of representative aPVT neurons showing k excitatory or m inhibitory food-cue responses during the conflict (dark red or dark blue) and the same cells before the conflict (gray). Inset: waveforms. n = 180 aPVT cells from 19 rats. See also Supplementary Figs. 4 and 5.
Fig. 3
Fig. 3. Pharmacological inactivation of aPVT neurons or chemogenetic inhibition of aPVT-NAc neurons biases behavior towards food seeking.
a (Top) Timeline of the approach-avoidance conflict test during pharmacological inactivation of aPVT neurons. (Bottom left) Representative micrograph showing the site of fluorescent muscimol microinjection into aPVT. (Bottom right) Orange areas represent the minimum (dark) and the maximum (light) spread of muscimol. bg Muscimol inactivation of aPVT neurons (orange bars, n = 7) during the conflict test reduced the percentage of time rats spent exhibiting c avoidance (F(1, 14) = 5.59, P = 0.033) and d head-out responses (F(1, 14) = 8.58, P = 0.011), and increased e food-approach time (F(1, 14) = 3.588, P = 0.079, with a Bonferroni planned comparison P = 0.026). Animals also exhibited a trend to reduce b freezing (F(1, 14) = 2.25, P = 0.155, Bonferroni planned comparison P = 0.092). No changes were observed in f lever presses (F(1, 14) = 1.207, P = 0.29) and g latency to press (F(1, 14) = 0.28, P = 0.60), when compared to vehicle controls (gray bars, n = 9). h (Top) Timeline of the approach-avoidance conflict test during chemogenetic inhibition of aPVT-NAc neurons. (Bottom left) Representative micrograph showing the expression of hM4Di into the aPVT. Red areas represent the minimum (dark) and the maximum (light) viral expression into the aPVT. (Bottom right) Representative micrograph showing the site of microinjection of retrograde AAV-Cre-GFP into the NAc. Green areas represent the minimum (dark) and the maximum (light) viral expression into the NAc. in Chemogenetic inhibition of aPVT-NAc neurons (pink bars, n = 8) reduced the percentage of time rats spent exhibiting i freezing (F(1, 15) = 6.22, P = 0.024), j avoidance (F(1, 15) = 10.58, P = 0.005), and k head-out (F(1, 15) = 8.07, P = 0.012) responses, and increased l food-approach time (F(1, 15) = 7.48, P = 0.015) and m lever presses (F(1, 15) = 1.69, P = 0.21, with Bonferroni planned comparison test P = 0.040), with no changes in the n latency to press (F(1, 15) = 2.50, P = 0.13) during the conflict test, when compared to mCherry controls (gray bars, n = 9). cc corpus callosum, MD mediodorsal thalamus, 3V third ventricle, sm stria medullaris, CA3 hippocampal CA3 subregion, NAc nucleus accumbens, LV lateral ventricle, ac anterior commissure. Scale bars: 500 µm. Two-way repeated-measures ANOVA followed by Bonferroni post hoc test. Data are shown as mean ± SEM. *P < 0.05, #P between 0.05 and 0.099. See also Supplementary Figs. 6 and 7 and Supplementary Movie 3.
Fig. 4
Fig. 4. aPVTCRF neurons are recruited during the approach-avoidance conflict test.
a Timeline of the approach-avoidance conflict test during single-unit recordings from photoidentified aPVTCRF neurons. b Diagram showing the injection of viral mix containing AAV-CRF-Cre and AAV-ChR2-DIO, and the implantation of optrode in aPVT. ce Photoidentification of aPVTCRF neurons. c Representative aPVTCRF neuron responsive to laser illumination (Z-score >3.29, P < 0.001, red dotted line, see details in Methods). d Cells with photoresponse latencies <12 ms were classified as aPVTCRF neurons (black bars, n = 26 out of 96 recorded neurons), whereas cells with photoresponse latencies >12 ms (white bars, n = 5 neurons) or non-responsive to the laser (n = 65 neurons, not shown) were classified as non-identified aPVT neurons (aPVTnon-ident, n = 70 out of 96 recorded neurons). e Raster plot and firing rate of a representative aPVTCRF neuron responding to a 5 Hz train of laser stimulation. Inset: Raster plot and firing rate time-locked for laser onset. Vertical blue bars: laser onset. Bins of 1 ms. f Relative frequency histogram showing the baseline firing rate of aPVTCRF neurons and aPVTnon-identif neurons. g (Top) Schematic of the food-cue-evoked responses. (Bottom) Percentage of aPVTCRF and aPVTnon-ident neurons that were responsive to food cues (green bars) before (left) and during the conflict (right). aPVTCRF neurons showed more food-cue responses during the conflict test, when compared to aPVTnon-ident neurons (Fisher’s exact test; aPVTCRF neurons: 39%, 10 out of 26; aPVTnon-ident neurons: 15%, 11 out of 70 neurons, P = 0.039). hi Average peristimulus time histograms of all photoidentified aPVTCRF neurons showing h excitatory or i inhibitory food-cue responses during the conflict (red or blue bars, respectively) or the same neurons before the conflict (gray bars). j (Top) Schematic of the spontaneous activity recordings. (Bottom) Percentage of aPVTCRF and aPVTnon-ident neurons that changed their baseline spontaneous activity (30 s pre vs. 30 s post) exclusively in food-seeking phase, cat odor phase, conflict phase (30 min), in more than one phase (nonselective), or did not change. No differences were observed between the two groups (Fisher’s exact test, all P’s > 0.05). k (Top) Schematic of the recordings during lever presses-evoked responses. (Bottom) Percentage of aPVTCRF and aPVTnon-ident neurons that were responsive to lever presses (pink bars) before the conflict phase. l (Top) Schematic of the recordings during dish-entry-evoked responses. (Bottom) Percentage of aPVTCRF and aPVTnon-ident neurons that were responsive to rewarded dish entries (orange bars) before the conflict phase. No differences were observed between the two groups (Fisher’s exact test, all P’s > 0.05). A total of eight rats were used.
Fig. 5
Fig. 5. Activity in aPVTCRF neurons bidirectionally regulates food seeking and avoidance behavior.
a (Top) Timeline of the conflict test during chemogenetic inhibition of aPVTCRF neurons. (Bottom left) Representative micrograph showing the viral expression in aPVT. (Bottom center) High magnification of the same micrograph. (Bottom right) Red areas represent the minimum (dark) and the maximum (light) viral expression. bg Chemogenetic inhibition of aPVTCRF neurons (red wine bars, n = 8) reduced the percentage of time rats spent exhibiting c avoidance (F(1, 17) = 6.41, P = 0.021), and increased e food-approach time (F(1, 17) = 13.9, P = 0.0017) and f lever presses (F(1, 17) = 4.62, P = 0.046), with a reduction in the g latency to press (F(1, 17) = 11.35, P = 0.0036) during the conflict test, when compared to mCherry controls (gray bars, n = 11). No changes were observed in b freezing (F(1, 17) = 0.8813, P = 0.36) and d head-out (F(1, 17) = 0.34, P = 0.56). h (Top) Timeline of the cued food-seeking test during optogenetic activation of aPVTCRF neurons. (Bottom left) Representative micrograph showing the viral expression in aPVT. (Bottom center) High magnification of the same micrograph. (Bottom right) Green areas represent the minimum (dark) and the maximum (light) viral expression. Purple dots: optical fiber tips. i Schematic of the cued food-seeking test. jl Optogenetic activation of aPVTCRF neurons (purple solid circles, n = 6) reduced the j number of lever presses (F(4, 48) = 11.4, P < 0.001) and increased k the latency to press the lever (F(4, 48) = 14.21, P < 0.001), when compared to eYFP controls (gray circles, n = 8). No difference was found in l the percentage of time rats spent freezing during the illumination (F(4, 48) = 1.691, P = 0.168). Blue shaded area represents laser-on trials (20 Hz, 5 ms pulse width, 10 mW, 30 s duration). Each circle represents the average of two consecutive trials. m Schematic of the real-time place preference test. nr Photoactivation of aPVTCRF neurons (purple bars, n = 5) reduced both n the percentage of time spent (F(1, 11) =  7.79, P = 0.018) and o the distance traveled (F(1, 11) = 7.238, P = 0.021) in the side of the chamber paired with laser stimulation (Side B), when compared to eYFP controls (gray bars, n = 7). p Representative tracks. No difference was found in locomotor activity measured as q total distance traveled (P = 0.911, t = 0.11) and r maximum speed (P = 0.183, t = 1.42) during the session. Blue shaded areas represent the sum of all laser-on epochs (20 Hz, 5 ms pulse width, 10 mW). sm stria medullaris, 3V third ventricle, cc corpus callosum, MD mediodorsal thalamus, CA3 hippocampal CA3 subregion. Scale bars: 500 μm; inset scale bars: 100 μm. bg, jl, n, o Two-way repeated-measures ANOVA followed by Bonferroni test. q, r Unpaired Student’s t test. Data are shown as mean ± SEM. *P < 0.05. See also Supplementary Movies 4, 5, and 6.
Fig. 6
Fig. 6. Afferent and efferent connections of aPVTCRF neurons across the brain.
a Schematic of intra-aPVT microinjection of a viral mix containing AAV-CRF-Cre and AAV-DIO-eYFP for specific labeling of aPVTCRFneurons and their fibers in output regions. bj Representative micrographs showing the expression of eYFP in b aPVTCRF neurons and their GFP-labeled fibers located in the c dorsolateral subregion of the bed nucleus of stria terminalis (dlBNST), d central nucleus of the amygdala (CeA), e dorsomedial hypothalamus (DMH), and ventromedial hypothalamus (VMH), f suprachiasmatic nucleus of hypothalamus (SCh), g reticular thalamic nucleus (Rt), h ventral subiculum (vSub), and both i the anterior and j the posterior subregions of the nucleus accumbens shell (NAcSh). Scale bars: 500 μm. This experiment was repeated in three rats with similar results. k Diagram of the viral vector infusions used for monosynaptic retrograde tracing of aPVTCRF neurons. l Representative micrograph of the injection site in aPVT showing the expression of helper virus (red) and rabies virus (green) under the control of AAV-CRF-Cre virus. Scale bar: 200 μm. Inset: High magnification of the same micrograph. Scale bars: 25 µm. mr Monosynaptic efferents to aPVTCRF neurons identified by the rabies virus, including m prelimbic cortex (PL), n reticular thalamic nucleus (Rt), o median preoptic area (MnPO), p ventromedial hypothalamus (VMH), q lateral hypothalamus (LH), and the r dorsomedial and dorsolateral subregions of the periaqueductal gray matter (PAGdm/PAGdl). Scale bars: 100 μm. This experiment was repeated in two rats with similar results. 3V third ventricle, sm stria medullaris, PT paratenial nucleus of thalamus, ic internal capsule, ac anterior commissure, IPAC interstitial nucleus of the posterior limb of the anterior commissure, LA lateral amygdala, BA basal amygdala, op. optic tract, Ent entorhinal cortex, PL prelimbic cortex, IL infralimbic cortex, DP dorsal peduncular cortex, NAcC nucleus accumbens core, cc corpus callosum, LV lateral ventricle, MS medial septum, Arc arcuate nucleus of the hypothalamus, Op optical tract, f fornix, MRe mammillary recess of the third ventricle, cp cerebral peduncle, Aq cerebral aqueduct, PAGl lateral subregion of the periaqueductal gray matter, PAGvl ventrolateral subregion of the periaqueductal gray matter.
Fig. 7
Fig. 7. Photoactivation of aPVTCRF-NAc projections suppresses food-seeking and induces avoidance behavior.
a (Top) Timeline of the cued food-seeking test during optogenetic activation of aPVTCRF-NAc projections. (Bottom left) Representative micrograph showing the expression of Cre-dependent channelrhodopsin (AAV-DIO-ChR2-eYFP) under the control of AAV-CRF-Cre in aPVT. (Bottom left-center) Green areas represent the minimum (dark) and the maximum (light) viral expression in the aPVT. (Bottom right-center) Representative micrograph showing aPVTCRF fibers in the NAc. (Bottom right) Purple dots represent the location of the optical fiber tips in the NAc. sm stria medullaris, 3V third ventricle, cc corpus callosum, MD mediodorsal thalamus, ac anterior commissure. b Schematic of the cued food-seeking test. ce Optogenetic activation of aPVTCRF-NAc projections (purple circles, n = 10) reduced c the number of lever presses (F(4, 72) = 11.49, P < 0.001) and increased d the latency to press the lever (F(4, 72) = 2.379, P = 0.059 with Bonferroni planned comparison test P = 0.012 for the first laser-on block and P = 0.054 for the second laser-on block), when compared to eYFP controls (gray circles, n = 10). No difference was found in e the percentage of time rats spent freezing during the illumination (F(1, 16) = 4.316, P = 0.54). Blue shaded area represents laser-on trials (20 Hz, 5 ms pulse width,15 mW, 30 s duration). Each circle represents the average of two consecutive trials. f Schematic of the real-time place preference test. gk Photoactivation of aPVTCRF-NAc projections (purple bars, n = 9) reduced both g the percentage of time spent (F(1, 16) = 18.73, P < 0.001) and h the distance traveled (F(1, 16) = 16.78, P < 0.001) in the side of the chamber paired with laser stimulation (Side B), when compared to eYFP controls (gray bars, n = 9). i Representative tracks. No difference was found in locomotor activity measured as j total distance traveled (P = 0.711, t = 0.378) and (k) maximum speed (P = 0.212, t = 1.301) during the session. Blue shaded areas represent the sum of all laser-on epochs (20 Hz, 5 ms pulse width, 15 mW). ce, g, h Two-way repeated-measure ANOVA followed by Bonferroni test. j, k Unpaired Student’s t test. Data are shown as mean ± SEM. *P < 0.05, #P between 0.05 and 0.099. See also Supplementary Movies 7 and 8.
Fig. 8
Fig. 8. aPVTCRF neurons mediate target-dependent synaptic transmission in the NAc in vitro.
a Schematics showing viral injection site in aPVT and recording site in NAc in rat brain slices expressing ChR2-eYFP in aPVTCRF afferents. b, c Representative whole-cell recordings of a putative b medium spiny neuron (MSN, purple) and c cholinergic interneuron (CIN, red) showing responses to hyperpolarizing and depolarizing current steps (−300 and 200 pA, 500 ms). CINs were distinguished from MSNs by larger diameter cell bodies and rebound firing following a hyperpolarizing current step. d, e Representative examples of optically evoked excitatory postsynaptic currents in an d MSN and a e CIN prior to and following the application of the AMPA receptor antagonist NBQX. f Representative examples of optically evoked excitatory postsynaptic currents (EPSCs) in an MSN (purple) and a neighboring CIN (red) recorded sequentially (LED duration: 1 ms). g (Left) Summary data quantifying optically evoked EPSC amplitudes in sequentially recorded pairs of MSNs and CINs (n = 9 pairs, three rats), indicating larger EPSCs in MSNs (paired Student’s t test, P = 0.038, t = 2.483). (Right) For the same pairs, graph plots EPSCCIN/EPSCMSN ratios. h Representative synaptic responses in sequentially recorded MSN (purple) and a CIN (red) evoked by a 20 Hz stimulus train. Responses are normalized to the amplitude of EPSC1. i Summary data quantifying EPSC amplitudes of MSNs (purple) and CINs (red) normalized to EPSC1 (n = 9 pairs). Short-term synaptic plasticity (quantified as EPSC8–10/EPSC1) showed significant target-dependent differences (MSN: 0.95 ± 0.17; CIN: 2.19 ± 0.22, paired Student’s t test, P = 0.0014, t = 4.79). Scale bars: 500 µm. Data are shown as mean ± SEM. Blue bars indicate the timing of LED stimuli.
Fig. 9
Fig. 9. Chemogenetic inhibition of VMH-aPVT neurons attenuates defensive behaviors during the conflict test.
ac Cat odor exposure activated VMH-aPVT neurons. a Timeline of the cat odor-induced neuronal activity test. b Representative micrographs showing VMH-aPVT neurons (green) expressing immunoreactivity to cFos (red) in both neutral odor (left) or cat odor (right) groups. Inset: white arrows showing examples of co-labeled cells. c Cat odor exposure (brown bars, n = 5) significantly increased (left) the percentage of VMH-aPVT cells that were cFos-positive and (right) the percentage of cFos-positive cells that were aPVT projecting, when compared to neutral odor controls (white bars, n = 6; unpaired Student’s t test; left, P < 0.001, t = 7.64; right, P < 0.001, t = 5.78). df Photoactivation of VMH afferents induces monosynaptic EPSCs in NAc-projecting aPVT neurons in vitro. d Schematics showing CTB infusion in NAc, viral vector AAV-ChR2-eYFP infusion in VMH, and slice recordings from NAc-projecting aPVT neurons. e Action potentials evoked by a depolarizing current step in a NAc-projecting aPVT neuron. f For the same cell, optically evoked EPSC (black) was completely blocked following bath application of the AMPA receptor antagonist NBQX (red). Similar findings were made in nine additional neurons (two rats). g (Top) Timeline of the conflict test during chemogenetic inhibition of VMH-aPVT neurons. (Bottom left) Representative micrograph showing the unilateral expression of hM4Di in VMH. (Bottom left-center) Red areas represent the minimum (dark) and the maximum (light) viral expression. (Bottom right-center) Representative micrograph showing the expression of retrograde AAV-Cre-GFP in aPVT. (Bottom right) Green areas represent the minimum (dark) and the maximum (light) viral expression. hm Chemogenetic inhibition of VMH-aPVT neurons (blue bars, n = 7) reduced the percentage of time rats spent exhibiting h freezing (F(1, 13) = 7.35, P = 0.017), i avoidance (F(1, 13) = 4.59, P = 0.051 with Bonferroni planned comparison test P = 0.005) and j head-out responses (F(1, 13) = 18.64, P < 0.001). No changes were observed in k food-approach time (F(1, 13) = 0.92, P = 0.35), l lever press (F(1, 13) = 0.18, P = 0.67) and m latency to press (F(1, 13) = 1.26, P = 0.28) during the conflict test, when compared to mCherry controls (gray bars, n = 8). 3V third ventricle, f fornix, sm stria medullaris, cc corpus callosum, MD mediodorsal thalamus, CA3 hippocampal CA3 subregion. Scale bars: 200 μm; inset scale bar: 25 μm. Two-way repeated-measures ANOVA followed by Bonferroni post hoc test. Data are shown as mean ± SEM. *P < 0.05. See also Supplementary Movie 9.
Fig. 10
Fig. 10. Schematic of our proposed model for the neural networks regulating predator-threat vs. food-seeking conflict.
(Left) During food-seeking behavior, food-associated cues inhibit the activity of PL glutamatergic neurons that project to aPVTCRF, resulting in reduced activity in the aPVTCRF-NAc projection and consequently increased food-seeking responses. (Right) During food-seeking vs. predator-threat conflict, cat odor activates MeApv neurons that project to VMHdm. Subsequent activation of VMHdm neurons that project to PAG mediates defensive responses, whereas activation of VMHdm neurons that project to aPVTCRF suppresses food seeking (Supplementary Fig. 8a–c). Increased activity in the aPVTCRF-NAc pathway leads to target-dependent synaptic transmission in the NAc (Fig. 8), thereby reducing food-seeking behavior (Fig. 7).

References

    1. Fendt M, et al. Context and trade-offs characterize real-world threat detection systems: a review and comprehensive framework to improve research practice and resolve the translational crisis. Neurosci. Biobehav Rev. 2020;115:25–33. doi: 10.1016/j.neubiorev.2020.05.002. - DOI - PubMed
    1. Lima SL, Dill LM. Behavioral decisions made under the risk of predation: a review and prospectus. Can. J. Zool. 1989;68:619–640. doi: 10.1139/z90-092. - DOI
    1. Apfelbach R, Blanchard CD, Blanchard RJ, Hayes RA, McGregor IS. The effects of predator odors in mammalian prey species: a review of field and laboratory studies. Neurosci. Biobehav. Rev. 2005;29:1123–1144. doi: 10.1016/j.neubiorev.2005.05.005. - DOI - PubMed
    1. Kirouac GJ. Placing the paraventricular nucleus of the thalamus within the brain circuits that control behavior. Neurosci. Biobehav. Rev. 2015;56:315–329. doi: 10.1016/j.neubiorev.2015.08.005. - DOI - PubMed
    1. Do Monte FH, Quirk GJ, Li B, Penzo MA. Retrieving fear memories, as time goes by. Mol. Psychiatry. 2016;21:1027–1036. doi: 10.1038/mp.2016.78. - DOI - PMC - PubMed

Publication types

MeSH terms

Substances

LinkOut - more resources