. 2021 May 4;11(1):9460.
doi: 10.1038/s41598-021-88866-5.

Serial profiling of cell-free DNA and nucleosome histone modifications in cell cultures

Affiliations

Serial profiling of cell-free DNA and nucleosome histone modifications in cell cultures

Vida Ungerer et al. Sci Rep. .

Abstract

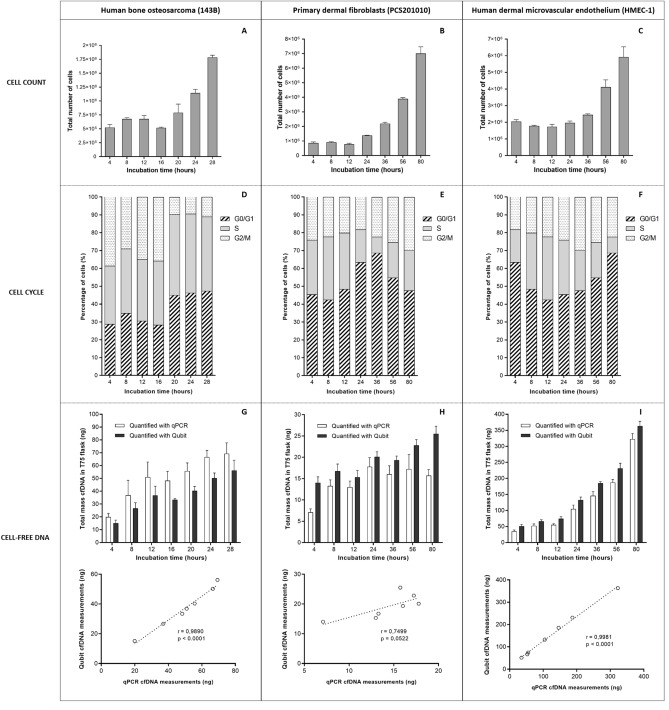
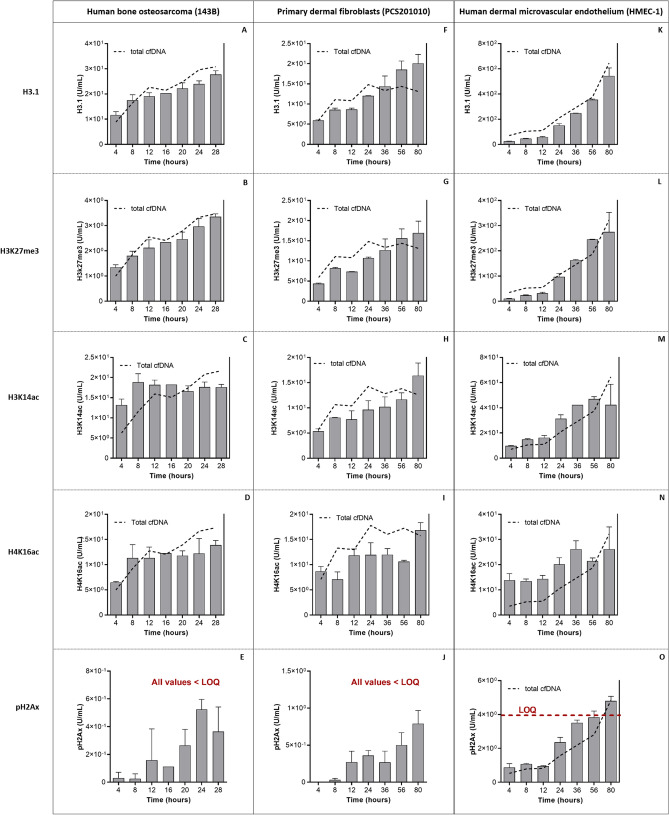
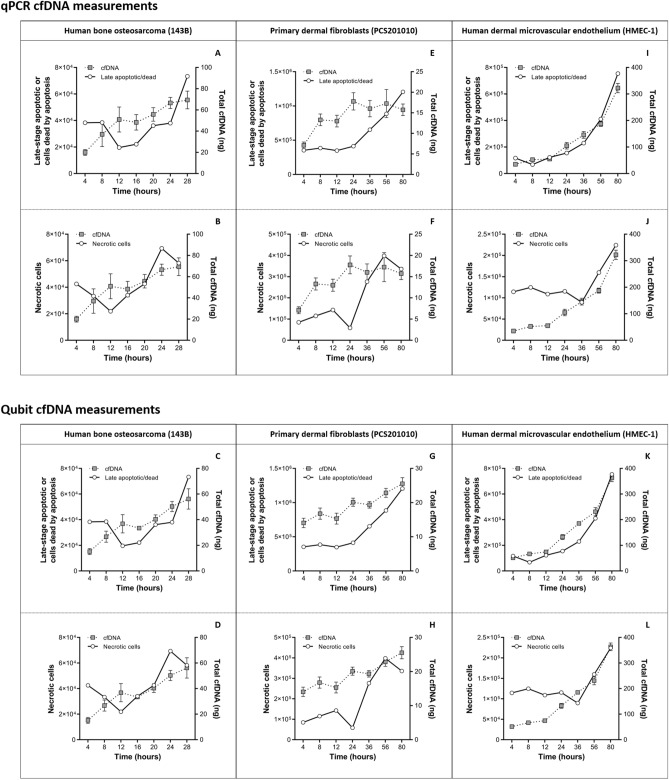
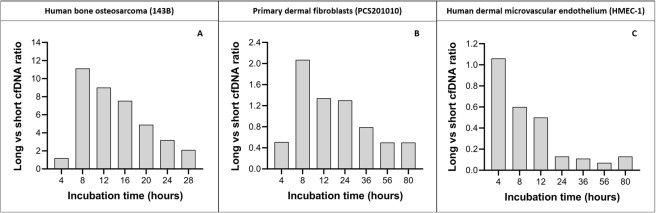
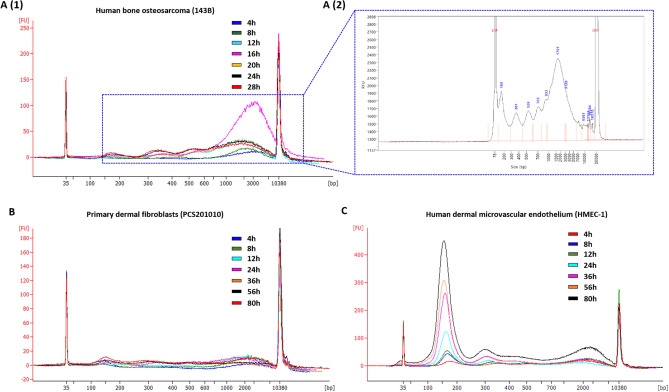
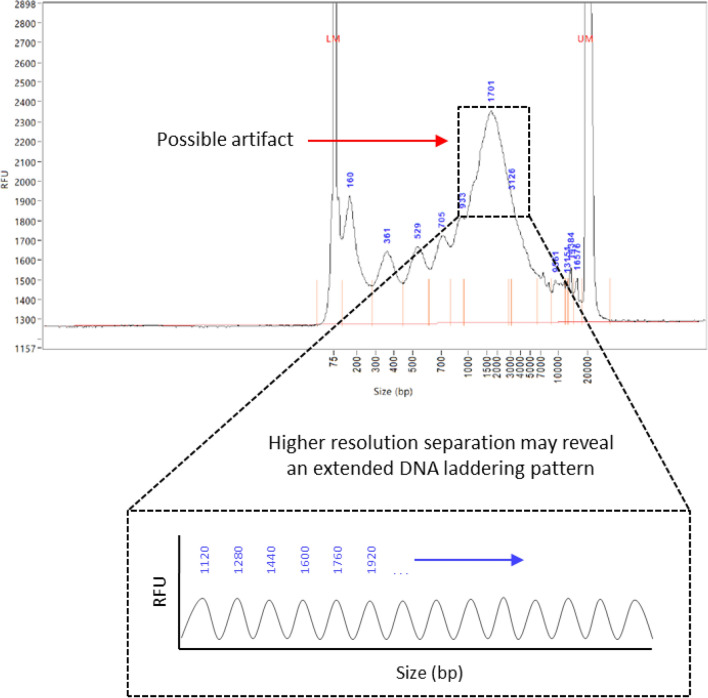
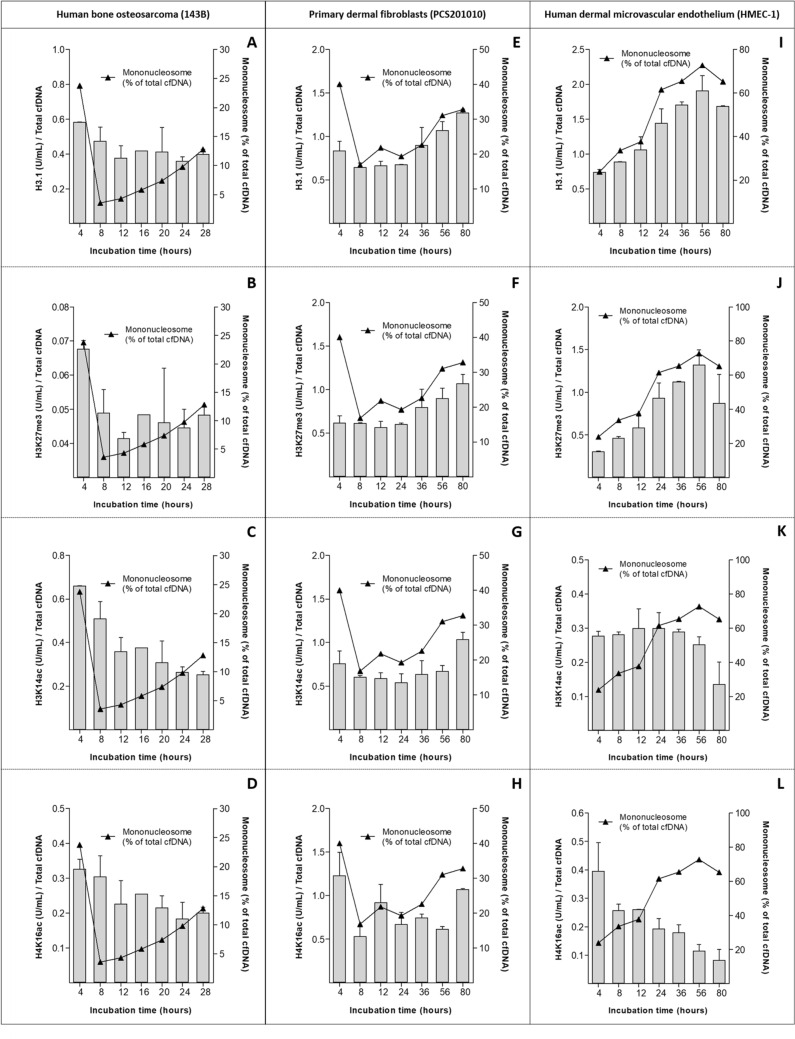
Recent advances in basic research have unveiled several strategies for improving the sensitivity and specificity of cell-free DNA (cfDNA) based assays, which is a prerequisite for broadening its clinical use. Included among these strategies is leveraging knowledge of both the biogenesis and physico-chemical properties of cfDNA towards the identification of better disease-defining features and optimization of methods. While good progress has been made on this front, much of cfDNA biology remains uncharted. Here, we correlated serial measurements of cfDNA size, concentration and nucleosome histone modifications with various cellular parameters, including cell growth rate, viability, apoptosis, necrosis, and cell cycle phase in three different cell lines. Collectively, the picture emerged that temporal changes in cfDNA levels are rather irregular and not the result of constitutive release from live cells. Instead, changes in cfDNA levels correlated with intermittent cell death events, wherein apoptosis contributed more to cfDNA release in non-cancer cells and necrosis more in cancer cells. Interestingly, the presence of a ~ 3 kbp cfDNA population, which is often deemed to originate from accidental cell lysis or active release, was found to originate from necrosis. High-resolution analysis of this cfDNA population revealed an underlying DNA laddering pattern consisting of several oligo-nucleosomes, identical to those generated by apoptosis. This suggests that necrosis may contribute significantly to the pool of mono-nucleosomal cfDNA fragments that are generally interrogated for cancer mutational profiling. Furthermore, since active steps are often taken to exclude longer oligo-nucleosomes from clinical biospecimens and subsequent assays this raises the question of whether important pathological information is lost.


Conflict of interest statement

M.H. and P.vd.A. are employed by Belgian Volition SRL (Namur, Belgium). S.H. serves on the Scientific Advisory Board and acts as a consultant for Belgian Volition SRL (Namur, Belgium). V.U. and A.J.B. declare no competing interests.

Figures

Figure 1
Figure 1
Longitudinal measurements of cell number, cell cycle and total cell-free DNA in three cell lines. A cell count and viability assay was used to determine the total number of cells present in a T-75 culture flask after different incubation times for (A) human bone osteosarcoma (143B), (B) primary dermal fibroblasts (PCS201010), and (C) human dermal microvascular endothelial cells (HMEC-1). Changes in the phase of cell cycle over increasing incubation times were measured in (D) 143B, (E) PCS201010, and (F) HMEC-1 cells using a cell cycle assay kit. The relative number of cells in the G0/G1, S, or G2/M phases, respectively, at each incubation time-point is expressed as a percentage of the whole. CfDNA was collected from (G) 143B, (H) PCS201010, and (I) HMEC-1 cell culture supernatant after different incubation times and quantified with a β-globin based PCR assay (white bars) and Qubit dsDNA HS Assay (black bars), respectively. The values are expressed as the total amount of cfDNA (ng) present in a T-75 culture flask. The statistical correlation between qPCR and Qubit measurements for each cell line is shown below the respective cfDNA quantification graphs. Each time-point bar represents the mean values of two biological replicates (measurements made from two separate cell culture flasks). Error bars indicate standard deviation. R-values close to 1 indicate perfect correlation, while R-values close to zero indicate no correlation. P-values < 0.05 indicate statistical significance.
Figure 2
Figure 2
Longitudinal measurements of nucleosomal H3.1 and histone PTMs in three cell lines. Using chemiluminescence based Nu.Q Immunoassays, total levels of H3.1, H3K27me3, H3K14ac, H4K16ac and pH2AX, respectively, were measured directly from 50 µL of cell culture supernatant collected at different time-points after increasing periods of incubation from (A-E) human bone osteosarcoma (143B) cells, (F-J) primary dermal fibroblasts (PCS201010), and (K–O) human dermal microvascular endothelial cells (HMEC-1). For all cell lines, each time-point bar represents the mean of measurements from two biological replicates (i.e., parallel characterization of two separate cell culture flasks), except for the 16 h time-point in 143B cells, for which data from one of the flasks was compromised due to experimental error and omitted. Error bars indicate standard deviation. As indicated in red text in Figs E, J and O, all measured pH2AX values were under the limit of quantification (LOQ) of the assay, except for the 80 h time-point in HMEC-1 cells. The dotted black lines overlayed on each graph illustrate the corresponding pattern of total cfDNA levels, as measured by a qPCR assay (data from Fig. 1G–I).
Figure 3
Figure 3
Total cfDNA levels vs total number of apoptotic and necrotic cells. Changes in total cfDNA levels as measured by both the β-globin-based qPCR (top) and Qubit HS DNA (bottom) assays over increasing incubation periods was plotted against corresponding changes in the total numbers of apoptotic and necrotic cells, respectively, as determined by a caspase-3/7 assay. (A-D) Human bone osteosarcoma (143B), (E–H) primary dermal fibroblasts (PCS201010), and (I-L) human dermal microvascular endothelial (HMEC-1) cell lines were investigated to observe the time-dependent changes in absolute cfDNA levels and corresponding changes in the total number of late-stage apoptotic cells or cells already dead by apoptosis (A, E, I, C, G, K), and necrotic cells (B, F, J, D, H, L). cfDNA values represent the total mass (ng) of cfDNA in the cell culture supernatant after each incubation period. Linear regression analyses for total cfDNA vs total apoptotic and necrotic cells are summarized in Supplementary Table S2.
Figure 4
Figure 4
Ratio of long to short cfDNA fragments. Cell-free DNA (cfDNA) size profiles for each time-point were generated using an Agilent Bioanalyzer and High Sensitivity DNA kit. The size profiles were gated into two groups corresponding to the total contribution (pg/µl) of both short (50–250 bp) and long (650–10,000 bp) cfDNA populations using the size-gating function of the onboard Expert 2100 software. To illustrate the relationship between these populations we plotted the ratio of long to short cfDNA fragments over time for (A) Human bone osteosarcoma (143B), (B) primary dermal fibroblasts (PCS201010), and (C) human dermal microvascular endothelial (HMEC-1) cell lines.
Figure 5
Figure 5
Cell-free DNA was isolated directly from cell culture supernatants and subject to size analysis. Electropherograms, generated with an Agilent Bioanalyzer, illustrates the cell-free DNA (cfDNA) size profiles at each time-point in cell culture supernatants from (A) human bone osteosarcoma (143B), (B) primary dermal fibroblast (PCS201010), and (C) human dermal microvascular endothelial (HMEC-1) cell lines. Electropherogram A (2) shows a 143B DNA size profile obtained when performing cfDNA size profiling using the dsDNA 930 Reagent kit on the Agilent Fragment Analyzer system, which allows higher resolution separation of DNA fragments in the range of 75 and 20,000 base pairs. The peaks at 35 and 10,000 bp correspond to the two internal size markers. The relative fluorescence (y-axis) of these markers is used to calculate the size of the unknown cfDNA samples (x-axis). Additional details of the cfDNA size analyses are summarized in Table 3.
Figure 6
Figure 6
A cell-free DNA (cfDNA) peak that ranges between 1–6 kbp may be an artifact of incomplete size separation. Due to the resolution limitations of electrophoretic methods, several individual cfDNA populations are grouped into a single peak. Deconvolution of this peak through complete size separation may reveal an underlying DNA fragmentation profile that continues the series of DNA laddering.
Figure 7
Figure 7
Levels of epigenetic marks normalized to total cfDNA. Serial measurements of cell-free nucleosomal histone variant H3.1 and PTMs (from top to bottom, H3.1, H3K27me3, H3K14ac, and H4K16ac) in the cell culture supernatants of (A-D) human bone osteosarcoma (143B) cells, (E–H) primary dermal fibroblasts (PCS201010), and (I-L) human dermal microvascular endothelial cells (HMEC-1). These epigenetic marks were measured directly from cell culture supernatant using Nu.Q Immunoassays (Belgian Volition SRL, Namur, Belgium). For all experiments, the values are expressed as total units/mL and are normalized to the total cfDNA levels, as determined by qPCR, at each corresponding time-point (left y-axis). The proportion of mono-nucleosomes (i.e., 50–250 bp) that comprise the total cfDNA population at each time-point for each cell line was calculated using the size gating function of the Agilent Bioanalyzer 2100 expert software and is plotted on the right y-axis. Error bars indicate standard deviation.

References

    1. Aucamp J, Bronkhorst AJ, Badenhorst CPS, Pretorius PJ. The diverse origins of circulating cell-free DNA in the human body: a critical re-evaluation of the literature. Biol. Rev. Camb. Philos. Soc. 2018;93:1649–1683. doi: 10.1111/brv.12413. - DOI - PubMed
    1. Thierry AR, El Messaoudi S, Gahan PB, Anker P, Stroun M. Origins, structures, and functions of circulating DNA in oncology. Cancer Metastas. Rev. 2016;35:347–376. doi: 10.1007/s10555-016-9629-x. - DOI - PMC - PubMed
    1. Bronkhorst AJ, Ungerer V, Holdenrieder S. The emerging role of cell-free DNA as a molecular marker for cancer management. Biomol. Detect. Quantif. 2019;17:100087. doi: 10.1016/j.bdq.2019.100087. - DOI - PMC - PubMed
    1. Heitzer, E., Haque, I. S., Roberts, C. E. S. & Speicher, M. R. Current and future perspectives of liquid biopsies in genomics-driven oncology. Nat. Rev. Genet. 1–1 (2018). - PubMed
    1. Bettegowda, C. et al. Detection of circulating tumor DNA in early-and late-stage human malignancies. Sci. Transl. Med.6, 224ra224 (2014). - PMC - PubMed

Publication types