. 2021 May 4;11(1):9455.
doi: 10.1038/s41598-021-88931-z.

A data-driven approach to violin making

Affiliations

A data-driven approach to violin making

Sebastian Gonzalez et al. Sci Rep. .

Abstract

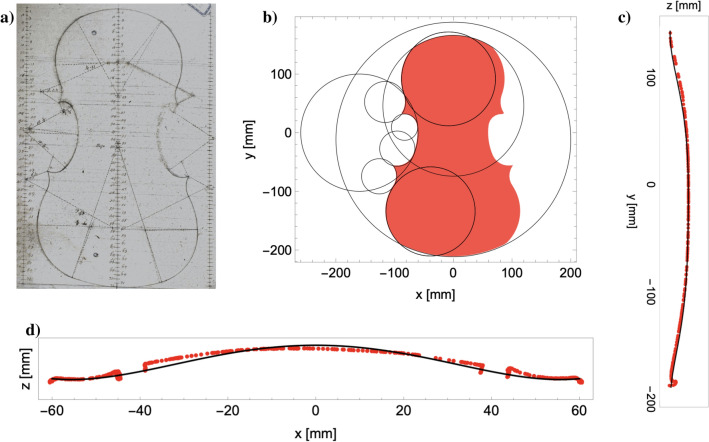
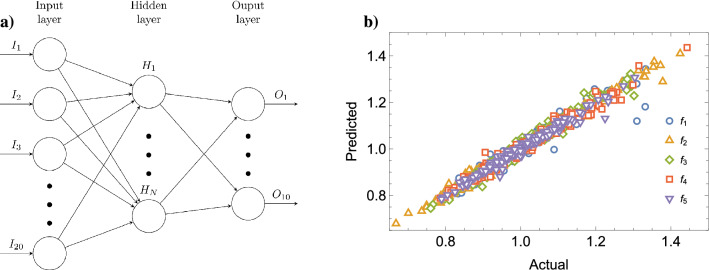
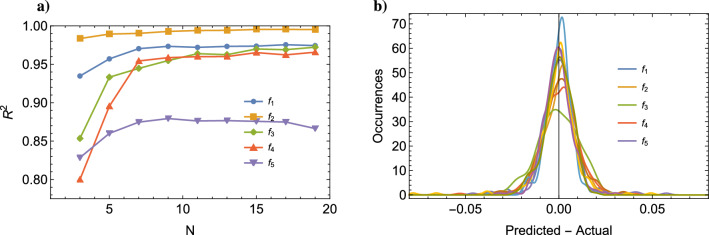
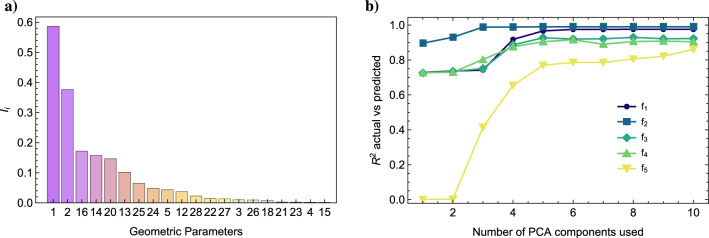
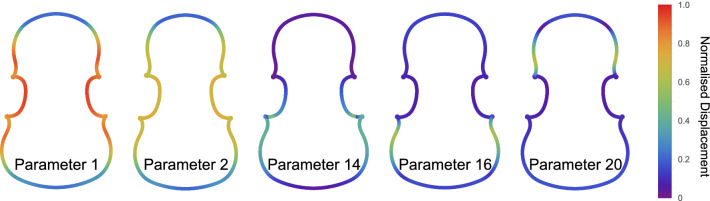
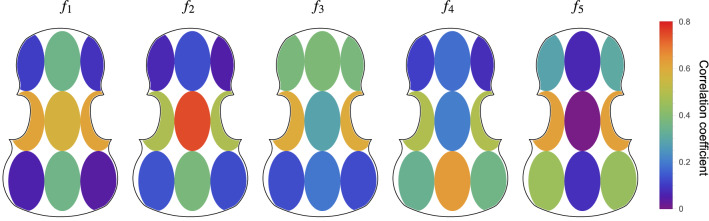
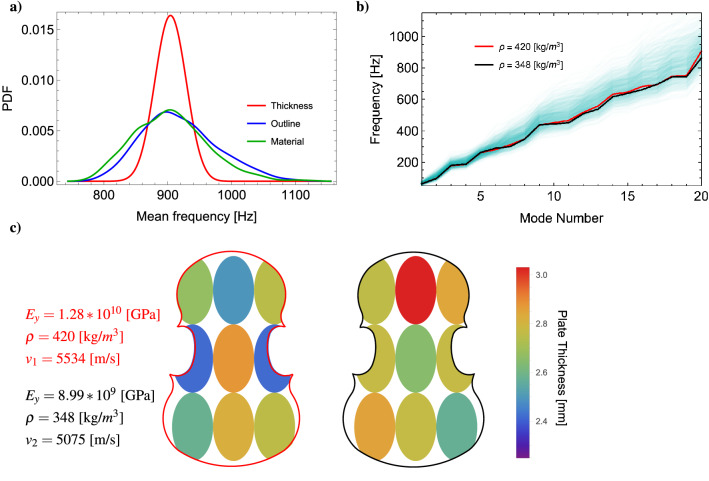
Of all the characteristics of a violin, those that concern its shape are probably the most important ones, as the violin maker has complete control over them. Contemporary violin making, however, is still based more on tradition than understanding, and a definitive scientific study of the specific relations that exist between shape and vibrational properties is yet to come and sorely missed. In this article, using standard statistical learning tools, we show that the modal frequencies of violin tops can, in fact, be predicted from geometric parameters, and that artificial intelligence can be successfully applied to traditional violin making. We also study how modal frequencies vary with the thicknesses of the plate (a process often referred to as plate tuning) and discuss the complexity of this dependency. Finally, we propose a predictive tool for plate tuning, which takes into account material and geometric parameters.


Conflict of interest statement

The authors declare no competing interests.

Figures

Figure 1
Figure 1
(a) A drawing from the workshop of Enrico Ceruti showing the outline as a series of connected arcs of circles, image courtesy of the Violin Museum of Cremona, Italy. (b) The 9 circles used for generating our violin outlines. (c) Fitting of a 6th order polynomial (black solid line) to the longitudinal arching (red points) of the celebrated “Messiah” violin, made by Antonius Stradivarius in 1716 (part of the fingerboard is visible in the upper right corner). (d) Transversal arching profile measured at the centre (in red), obtained from the 3D scan of the “Messiah”; arching of the 4th-order polynomial used (in black), see main text.
Figure 2
Figure 2
(a) Architecture used for prediction. (b) Predicted versus actual values for the first five eigenfrequencies in the test set for a network with N=7. The frequencies are scaled by the average actual values for each mode in order to be able to compare different frequency values in the same plot. The prediction turns out to produce R2=0.977.
Figure 3
Figure 3
(a) Individual values of the R2 (predicted vs. actual) of the first five eigenfrequencies f1,,5 of the violin top plates. As we can see, from N=15 the network begins overfitting f5 in the training set, as the error in the test set start growing. Notice that, with fewer than 7 neurons, the network is unable to offer a correct prediction. (b) Histograms of the difference between the eigenfrequency predicted by the neural network with N = 7; and the FEM result for the first five eigenfrequencies.
Figure 4
Figure 4
(a) Feature importance measured trough Ii. The geometric parameters are here sorted in decreasing order of importance. As we can see, only few parameters carry a significant amount of information about the eigenfrequencies. Interestingly, the parameters that correlate with frequency 5 are not the same that correlate the remaining frequencies. (b) Accuracy of the prediction model based on the PCA components of the outline instead of the geometric parameters, each line corresponds to a different mode frequency.
Figure 5
Figure 5
Outline change for a 5% variation of the for the first 5 parameters of the model, ordered by relevance from Fig. 4. The colour code represents the displacement of each point of the outline, normalised by the maximum displacement, from the average violin.
Figure 6
Figure 6
Correlation between thickness and eigenfrequencies for modes one to five. Data set created varying only the thickness profile and keeping outline and material parameters constant. For the case of varying all the parameters at the same time the correlation values go down to a max of 0.5 but the spatial structure is conserved.
Figure 7
Figure 7
(a) Histogram of mean frequencies for datasets varying shape, thickness profile and material parameters. (b) First 20 eigenfrequencies for the two most different violin top plates (in their parameters) that are in the top 0.1% of most similar frequency response in the data set (the complete data set is plotted on the background for comparison). (c) Outline and thickness profile of the same two violin tops. and their most important material parameters. The black outline is slightly wider than the red one and the lower corners point more upwards; the most relevant difference is in the thickness profile though.

References

    1. Nia HT, et al. The evolution of air resonance power efficiency in the violin and its ancestors. Proc. R. Soc. A Math. Phys. Eng. Sci. 2015;471:20140905. - PMC - PubMed
    1. Tai H-C, Shen Y-P, Lin J-H, Chung D-T. Acoustic evolution of old Italian violins from Amati to Stradivari. Proc. Natl. Acad. Sci. 2018;115:5926–5931. doi: 10.1073/pnas.1800666115. - DOI - PMC - PubMed
    1. Molin N, Tinnsten M, Wiklund U, Jansson E. Fem-analysis of an orthotropic shell to determine material parameters of wood and vibration modes of violin plates. Report STL-QPSR. 1984;4:1984.
    1. Molin N-E, Lindgren L-E, Jansson EV. Parameters of violin plates and their influence on the plate modes. J. Acoust. Soc. Am. 1988;83:281–291. doi: 10.1121/1.396430. - DOI
    1. Tinnsten M, Carlsson P. Numerical optimization of violin top plates. Acta Acust. United Acust. 2002;88:278–285.

Publication types

LinkOut - more resources