

Distribution of waist-to-height ratio and cardiometabolic risk in children and adolescents: a population-based study
- PMID: 33947900
- PMCID: PMC8096959
- DOI: 10.1038/s41598-021-88951-9
Distribution of waist-to-height ratio and cardiometabolic risk in children and adolescents: a population-based study
Abstract
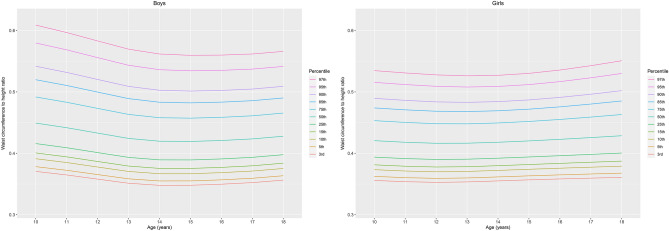
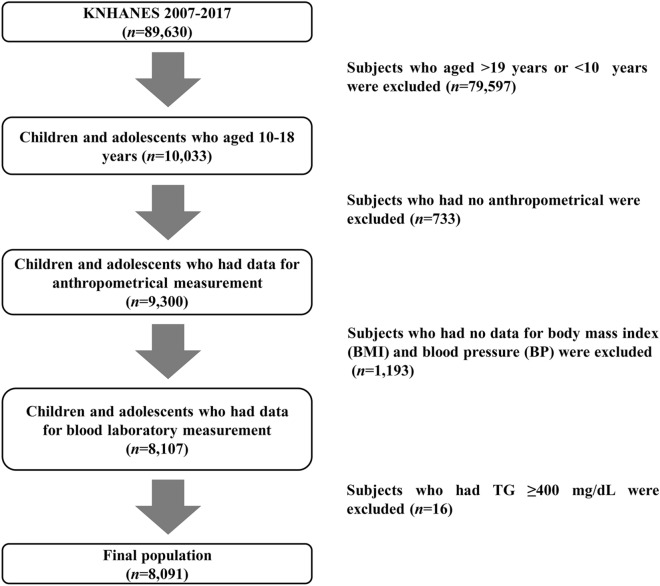
This study was performed to evaluate the waist-to-height ratio (WHtR) distribution and assess its relationship with cardiometabolic risk in children and adolescents. A total of 8091 subjects aged 10-18 years were included from a nationally representative survey. Participants were classified into three groups: (1) < 85th, (2) ≥ 85th and < 95th, and (3) ≥ 95th percentile of WHtR. The WHtR distribution varied with sex and age. Whereas WHtR decreased from age 10-15 years in boys and from age 10-12 years in girls, it slightly increased thereafter. Compared to the < 85th percentile group, the WHtR ≥ 85th and < 95th percentile group had an odds ratio (OR) of 1.2 for elevated blood pressure (BP), 1.89 for elevated triglycerides (TGs), 1.47 for reduced high-density lipoprotein cholesterol (HDL-C) and 4.82 for metabolic syndrome (MetS). The ≥ 95th percentile group had an OR of 1.4 for elevated BP, 2.54 for elevated glucose, 2.22 for elevated TGs, 1.74 for reduced HDL-C, and 9.45 for MetS compared to the < 85th percentile group. Our results suggest that sex- and age-specific WHtR percentiles can be used as a simple clinical measurement to estimate cardiometabolic risk.
Conflict of interest statement
The authors declare no competing interests.
Figures
Similar articles
-
Waist-to-Height Ratio as an Index for Cardiometabolic Risk in Adolescents: Results from the 1998-2008 KNHANES.Yonsei Med J. 2016 May;57(3):658-63. doi: 10.3349/ymj.2016.57.3.658. Yonsei Med J. 2016. PMID: 26996566 Free PMC article.
-
Establishing international optimal cut-offs of waist-to-height ratio for predicting cardiometabolic risk in children and adolescents aged 6-18 years.BMC Med. 2023 Nov 15;21(1):442. doi: 10.1186/s12916-023-03169-y. BMC Med. 2023. PMID: 37968681 Free PMC article.
-
Utility of waist-to-height ratio in assessing the status of central obesity and related cardiometabolic risk profile among normal weight and overweight/obese children: the Bogalusa Heart Study.BMC Pediatr. 2010 Oct 11;10:73. doi: 10.1186/1471-2431-10-73. BMC Pediatr. 2010. PMID: 20937123 Free PMC article.
-
DIAGNOSTIC PERFORMANCE OF WAIST CIRCUMFERENCE MEASUREMENTS FOR PREDICTING CARDIOMETABOLIC RISK IN MEXICAN CHILDREN.Endocr Pract. 2016 Oct;22(10):1170-1176. doi: 10.4158/EP161291.OR. Epub 2016 Jun 13. Endocr Pract. 2016. PMID: 27295014
-
Continuous cardiometabolic risk score definitions in early childhood: a scoping review.Obes Rev. 2018 Dec;19(12):1688-1699. doi: 10.1111/obr.12748. Epub 2018 Sep 17. Obes Rev. 2018. PMID: 30223304
Cited by
-
Cardiorespiratory fitness attenuates the association between fatness and cardiometabolic risk in Chinese children.Front Endocrinol (Lausanne). 2024 May 15;15:1361447. doi: 10.3389/fendo.2024.1361447. eCollection 2024. Front Endocrinol (Lausanne). 2024. PMID: 38812818 Free PMC article.
-
Waist-height ratio and body mass index as indicators of obesity and cardiometabolic risk in Korean children and adolescents.Ann Pediatr Endocrinol Metab. 2024 Jun;29(3):182-190. doi: 10.6065/apem.2346090.045. Epub 2024 Jun 30. Ann Pediatr Endocrinol Metab. 2024. PMID: 38956754 Free PMC article.
-
Updated reference ranges for aminotransferase levels of Korean children and young adolescents based on the risk factors for metabolic syndrome.Sci Rep. 2022 Sep 21;12(1):15739. doi: 10.1038/s41598-022-20104-y. Sci Rep. 2022. PMID: 36131081 Free PMC article.
-
Sociodemographic and Socioeconomic Factors Influencing the Body Mass Composition of School-Age Children.Int J Environ Res Public Health. 2022 Sep 7;19(18):11261. doi: 10.3390/ijerph191811261. Int J Environ Res Public Health. 2022. PMID: 36141532 Free PMC article.
-
An Investigation of the Utility of Waist Circumference Predicting Cardiorespiratory Fitness in School Children: A Cross-Sectional Study.Int J Environ Res Public Health. 2023 Jan 2;20(1):851. doi: 10.3390/ijerph20010851. Int J Environ Res Public Health. 2023. PMID: 36613173 Free PMC article.
References
MeSH terms
Substances
LinkOut - more resources
Full Text Sources
Other Literature Sources
