. 2021 May 4;11(1):9481.
doi: 10.1038/s41598-021-89131-5.

Systematic integrated analyses of methylomic and transcriptomic impacts of early combined botanicals on estrogen receptor-negative mammary cancer

Affiliations

Systematic integrated analyses of methylomic and transcriptomic impacts of early combined botanicals on estrogen receptor-negative mammary cancer

Itika Arora et al. Sci Rep. .

Abstract

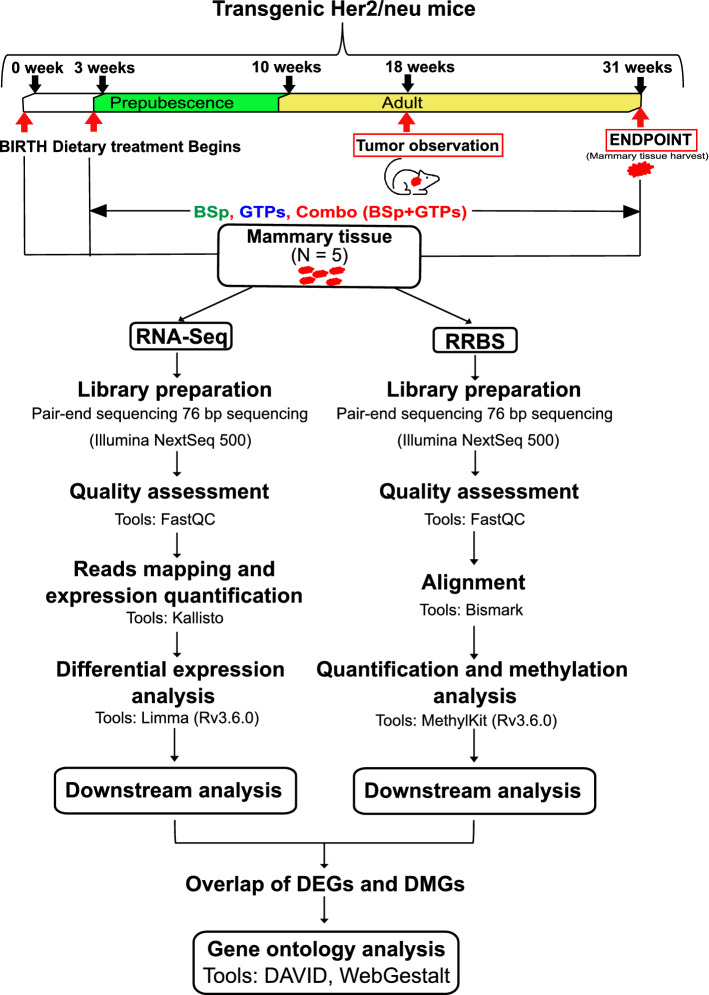
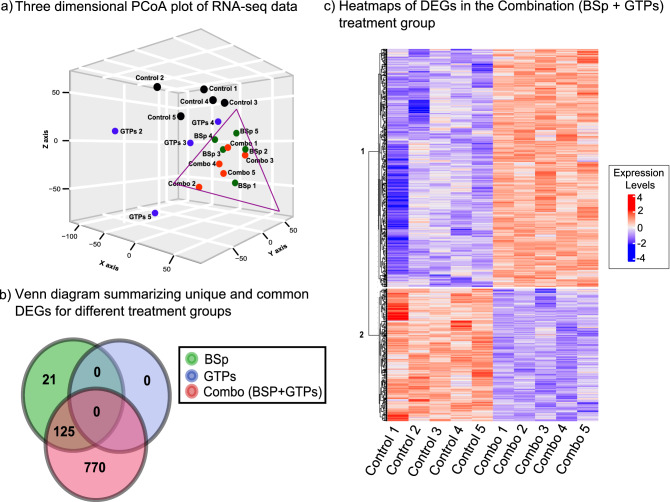
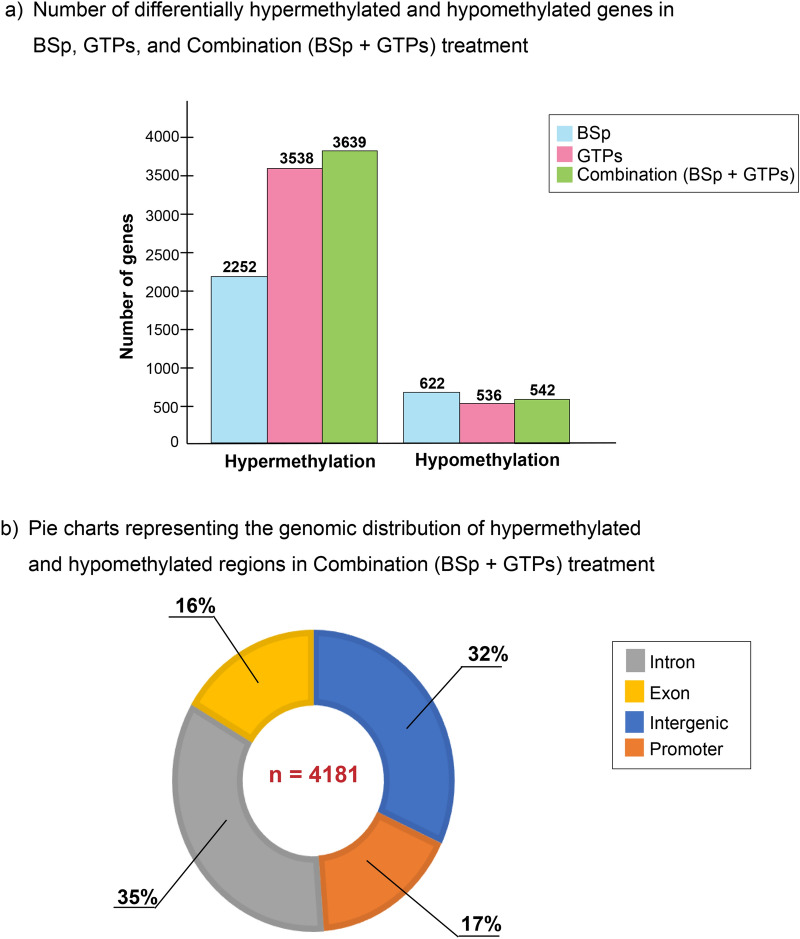
Dietary botanicals such as the cruciferous vegetable broccoli sprouts (BSp) as well as green tea polyphenols (GTPs) have shown exciting potential in preventing or delaying breast cancer (BC). However, little is known about their impact on epigenomic aberrations that are centrally involved in the initiation and progression of estrogen receptor-negative [ER(-)] BC. We have investigated the efficacy of combined BSp and GTPs diets on mammary tumor inhibition in transgenic Her2/neu mice that were administered the diets from prepubescence until adulthood. Herein, we present an integrated DNA methylome and transcriptome analyses for defining the early-life epigenetic impacts of combined BSp and GTPs on mammary tumors and our results indicate that a combinatorial administration of BSp and GTPs have a stronger impact at both transcriptome and methylome levels in comparison to BSp or GTPs administered alone. We also demonstrated a streamlined approach by performing an extensive preprocessing, quality assessment and downstream analyses on the genomic dataset. Our identification of differentially methylated regions in response to dietary botanicals administered during early-life will allow us to identify key genes and facilitate implementation of the subsequent downstream functional analyses on a genomic scale and various epigenetic modifications that are crucial in preventing ER(-) mammary cancer. Furthermore, our realtime PCR results were also found to be consistent with our genome-wide analysis results. These results could be exploited as a comprehensive resource for understanding understudied genes and their associated epigenetic modifications in response to these dietary botanicals.


Conflict of interest statement

The authors declare no competing interests.

Figures

Figure 1
Figure 1
Her2/neu mice were administered with regular control diet, 26% BSp diet, 0.5% GTPs in drinking water or BSp and GTP in combination (BSp + GTPs) upon weaning at 3 weeks. Dietary treatment continued throughout the study until termination of the experiment and mice were evaluated for tumor growth weekly. (a) Tumor incidence measured by percentage over the whole population. (b) Average tumor weight among BSp, GTPs and the combination treatment group. Columns represents mean; bars, standard error; *p value < 0.05, **p value < 0.01, ***p value < 0.001 which were significantly different from the control group.
Figure 2
Figure 2
An overview of framework demonstrating experimental design and data analyses pipeline.
Figure 3
Figure 3
Transcriptome analyses across BSp, GTPs and Combination (BSp + GTPs) treatment groups. (a) Three dimensional PCoA plot demonstrating spatial arrangements of different samples. (b) Venn diagram summarizing total number of unique and overlapping differentially expressed genes in BSp, GTPs and combination (BSp + GTPs) treatment groups. Green circle represents BSp, Blue color represents GTPs and Red color denotes the combination (BSp + GTPs) treatment group. (c) Heatmap representing 895 up-regulated and down-regulated genes in the combination (BSp + GTPs) treatment group based on q value. Each row corresponds to differentially expressed transcripts and each column represents biological replicates in control (NControl = 5) and the combination (NCombination = 5) treatment group. Blue color denotes lower expression levels and red color denotes higher expression levels.
Figure 4
Figure 4
Bar plot distribution of GO slim terms of differentially expressed transcripts related to the combination (BSp + GTPs) treatment group in (a) biological process, (b) cellular components and (c) molecular functions wherein red bars represent downregulated genes and green bars represent up-regulated genes. The height in the bar plot represents the total number of differentially expressed genes. (d) Gene ontology enrichment terms and REACTOME pathways analyses using DAVID web-based tool. The plot is sorted based on decreasing FC wherein Y-axis represents specific GO terms related to biological pathways and X-axis represents log10(FC) associated with each GO term.
Figure 5
Figure 5
Differential DNA methylation analyses by RRBS across different treatment groups. (a) Bar plot representing different numbers of differentially hypomethylated and hypermethylated genes in BSp, GTPs and the combination (BSp + GTPs) treatment groups. The height in the bar plot represents the total number of differentially methylated genes in BSp (blue color), GTPs (pink color) and the combination (green color) treatment groups. (b) Pie charts representing the genomic distribution of hypo- and hypermethylated regions in the combination treatment (NDMRs = 4181) group. Grey color represents Intronic regions (35%), yellow color represents exonic regions (16%), blue color represents intergenic regions (32%) and orange color represents promoter regions (17%).
Figure 6
Figure 6
Correlation of DEGs and DMGs in the combination treatment group. (a) Venn diagram representing unique and overlapping differentially expressed genes (DEGs) and differentially methylated genes (DMGs) in the combination (BSp + GTPs) treatment group. (b) Scatter plot for 39 genes which are differentially expressed and methylated. The y-axis represents the methylation difference across 39 genes (dots in red color) and x-axis represents log10FC. Out of 39 transcripts, 2 genes (Tmem132d and Pdx1) were up-regulated and hypomethylated and 3 genes (Ndufa1, Rpl13 and Get4) were downregulated and hypermethylated. (c) Heatmap representing overlapping 5 up- and downregulated genes in the combination (BSp + GTPs) treatment group based on q value. Each row corresponds to differentially expressed and differentially methylated transcripts and each column represents biological replicates in control (N = 5) and the combination (N = 5) treatment group. Blue color denotes lower expression levels and red color denotes higher expression levels.
Figure 7
Figure 7
Validation of unique differentially expressed and differentially methylated genes in combination (BSp + GTPs) treatment group using quantitative real-time PCR to measure relative expression of (a) Pdx1 (b) Tmem132d (c) Get4 (d) Rpl13 and (e) Ndufa1 in BSp, GTPs and the combination (BSp + GTPs) treatment groups. The experiments were performed in triplicate from three independent experiments and further normalized to internal control and calibrated to levels in control (untreated) samples. Columns mean; bars, standard error. *p value < 0.05.

References

    1. Seyfried TN, Huysentruyt LC. On the origin of cancer metastasis. Crit. Rev. Oncog. 2013;18:43. doi: 10.1615/CritRevOncog.v18.i1-2.40. - DOI - PMC - PubMed
    1. Siegel RL, Miller KD, Jemal A. Cancer statistics, 2020. CA Cancer J. Clin. 2020;70:7–30. doi: 10.3322/caac.21590. - DOI - PubMed
    1. Fu X, Osborne CK, Schiff R. Biology and therapeutic potential of PI3K signaling in ER+/HER2-negative breast cancer. Breast. 2013;22:S12–S18. doi: 10.1016/j.breast.2013.08.001. - DOI - PMC - PubMed
    1. Ali S, Coombes RC. Endocrine-responsive breast cancer and strategies for combating resistance. Nat. Rev. Cancer. 2002;2:101–112. doi: 10.1038/nrc721. - DOI - PubMed
    1. Miller A, et al. A study of diet and breast cancer. Am. J. Epidemiol. 1978;107:499–509. doi: 10.1093/oxfordjournals.aje.a112569. - DOI - PubMed

Publication types