

Cordycepin inhibits the proliferation of malignant peripheral nerve sheath tumor cells through the p53/Sp1/tubulin pathway
- PMID: 33948356
- PMCID: PMC8085885
Cordycepin inhibits the proliferation of malignant peripheral nerve sheath tumor cells through the p53/Sp1/tubulin pathway
Abstract
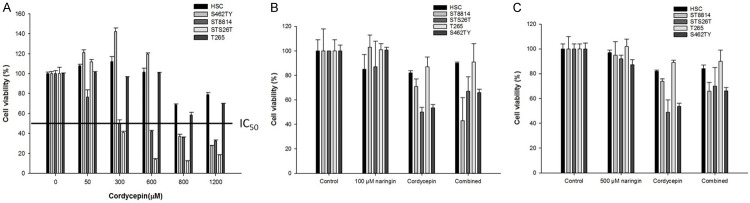
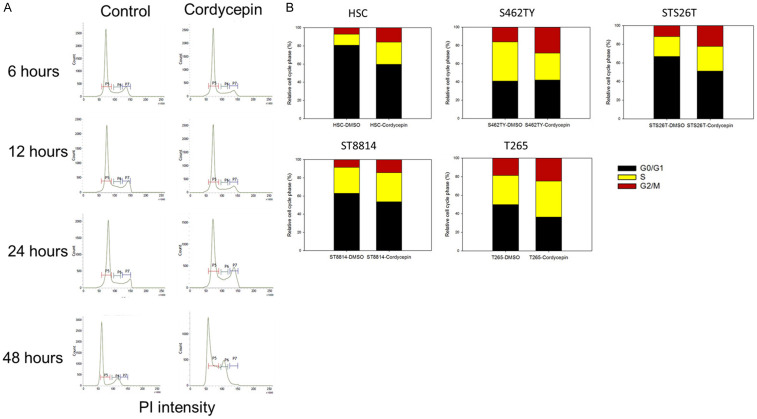
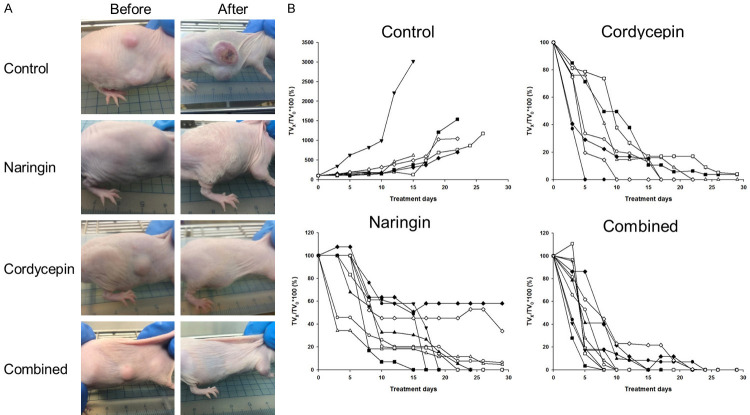
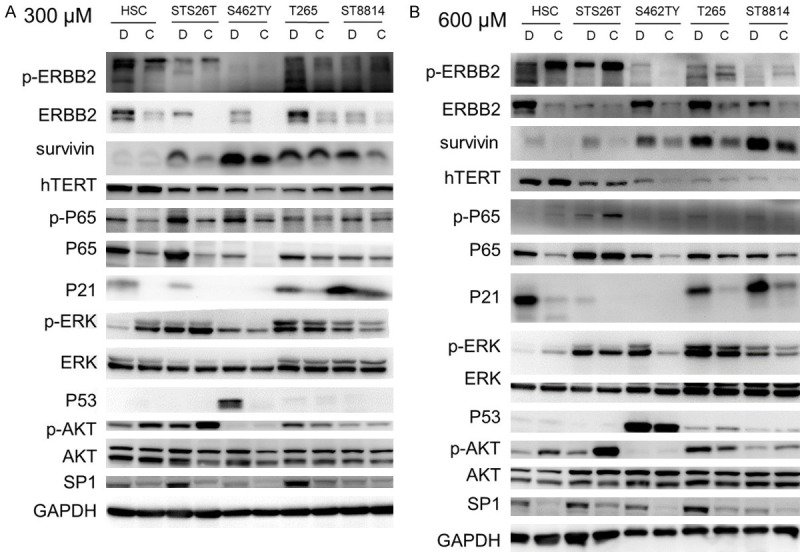
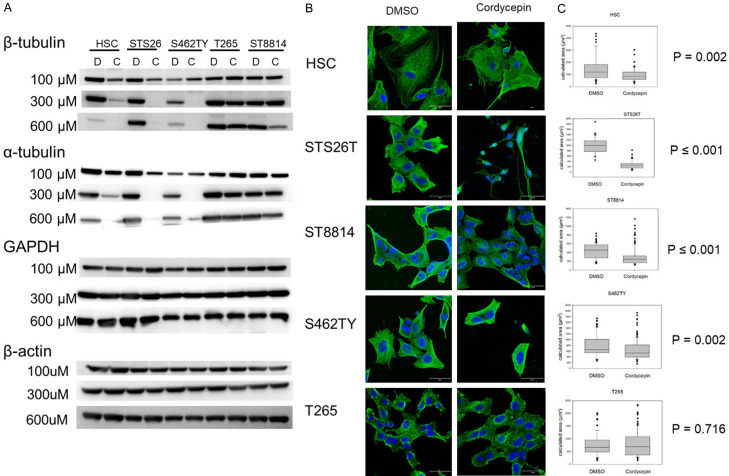
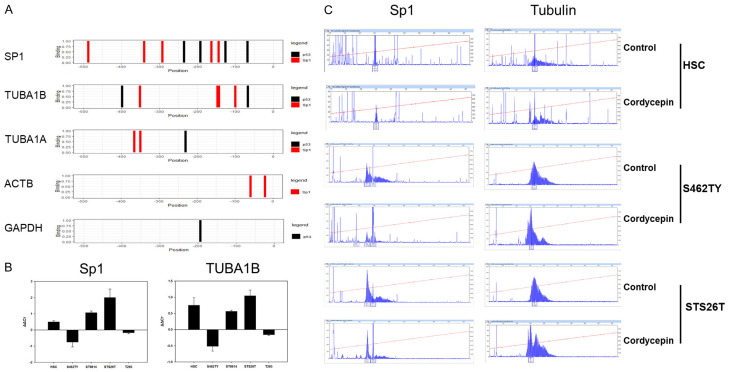
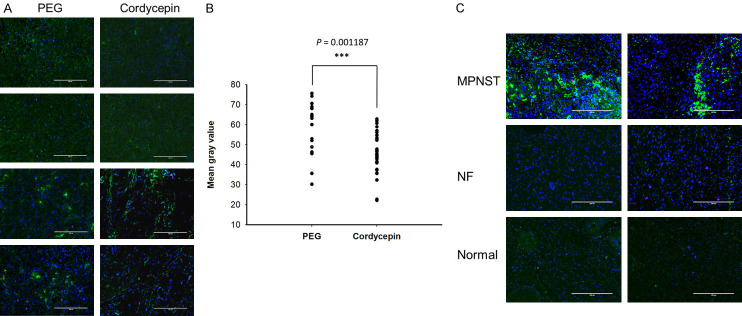
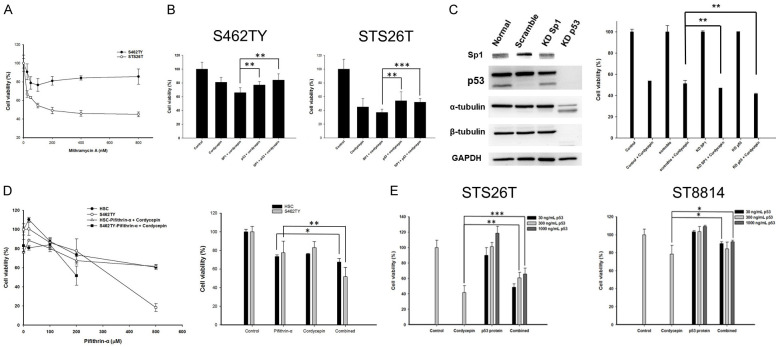
Neurofibromatosis type 1 (NF1) is one of the most common hereditary neurocutaneous disorders. In addition to skin pigmentation and cutaneous neurofibroma, some patients developed the plexiform neurofibroma since birth. Plexiform neurofibroma has abundant Schwann cells, fibroblasts, mast cells, blood vessels, and connective tissues, which increases the risk of developing a malignant peripheral nerve sheath tumor (MPNST). MPNST is a highly invasive cancer with no effective therapeutic agent. Cordycepin or 3'-deoxyadenosine is an extract from cordyceps militaris, which has been reported as an anti-inflammation and anti-tumor agent. Herein, we evaluated cordycepin's anti-proliferative effect on MPNST cell lines both in vitro and in vivo. Cordycepin inhibited the MPNST cell growth with an arrest of cell cycle at G2/M and S phases. The administration of naringin and pentostatin, inhibitors for adenosine deaminase (ADA), enzyme responsible for cordycepin degradation, did not show a synergistic effect in MPNST cells treated with cordycepin. However, the combined treatment enhanced the decrease of tumors in xenograft mouse model. Immunoblotting showed a decreased level of p53 protein in all MPNST cell lines, but S462TY cells. After cordycepin treatment, the levels of ERK, survivin, pAKT, and Sp1 proteins also decreased. The level of tubulin, but not actin or GAPDH, decreased in a dose-dependent manner. The microtubule network which is composed of tubulins was markedly decomposed in those treated MPNST cells. To elucidate the epigenetic control of transcription, ChIP-qPCR assay of the Sp1 and tubulin promoter regions revealed decreased Sp1 binding. The incorporation of 3'-doexyadenosine is detrimental for the process of poly(A) tail elongation. The poly(A) tail length assay showed the tail length in Sp1 and tubulin transcripts decreased in the treated cells. Nevertheless, the administration of SP1 protein to the treated cells could not rescue them completely. Furthermore, the p53-knocked-down cells (S462TY) where the expression of both p53 and Sp1 was suppressed, were vulnerable to cordycepin. The p53 protein could ameliorate the effect. In summary, cordycepin is effective to inhibit the growth of MPNST, probably through the pathway of p53/Sp1/tubulin.
Keywords: ChIP; Cordycepin; MPNST; p53/Sp1/tubulin; poly(A) tail length.
AJCR Copyright © 2021.
Conflict of interest statement
None.
Figures
Similar articles
-
A novel HDAC11 inhibitor potentiates the tumoricidal effects of cordycepin against malignant peripheral nerve sheath tumor through the Hippo signaling pathway.Am J Cancer Res. 2022 Feb 15;12(2):873-892. eCollection 2022. Am J Cancer Res. 2022. PMID: 35261809 Free PMC article.
-
Calebin-A induced death of malignant peripheral nerve sheath tumor cells by activation of histone acetyltransferase.Phytomedicine. 2019 Apr;57:377-384. doi: 10.1016/j.phymed.2019.01.001. Epub 2019 Jan 3. Phytomedicine. 2019. PMID: 30831486
-
Molecular characterization of permanent cell lines from primary, metastatic and recurrent malignant peripheral nerve sheath tumors (MPNST) with underlying neurofibromatosis-1.Anticancer Res. 2009 Apr;29(4):1255-62. Anticancer Res. 2009. PMID: 19414372
-
Malignant peripheral nerve sheath tumor of intracranial nerve: a case series review.Auris Nasus Larynx. 2010 Oct;37(5):539-45. doi: 10.1016/j.anl.2010.02.009. Auris Nasus Larynx. 2010. PMID: 20399579 Review.
-
Malignant Peripheral Nerve Sheath Tumors.Adv Exp Med Biol. 2016;916:495-530. doi: 10.1007/978-3-319-30654-4_22. Adv Exp Med Biol. 2016. PMID: 27165368 Review.
Cited by
-
Immunopharmacological Insights into Cordyceps spp.: Harnessing Therapeutic Potential for Sepsis.Curr Pharm Des. 2025;31(11):823-842. doi: 10.2174/0113816128326301240920040036. Curr Pharm Des. 2025. PMID: 39694962 Review.
-
Cordycepin remodels the tumor microenvironment of colorectal cancer by down-regulating the expression of PD-L1.J Cancer Res Clin Oncol. 2023 Dec;149(19):17567-17579. doi: 10.1007/s00432-023-05460-0. Epub 2023 Nov 1. J Cancer Res Clin Oncol. 2023. PMID: 37910234 Free PMC article.
-
Effects and safety of Ophiocordyceps sinensis preparation in the adjuvant treatment for dialysis patients: a systematic review and meta-analysis.Front Pharmacol. 2024 Jul 19;15:1360997. doi: 10.3389/fphar.2024.1360997. eCollection 2024. Front Pharmacol. 2024. PMID: 39101133 Free PMC article.
-
A novel HDAC11 inhibitor potentiates the tumoricidal effects of cordycepin against malignant peripheral nerve sheath tumor through the Hippo signaling pathway.Am J Cancer Res. 2022 Feb 15;12(2):873-892. eCollection 2022. Am J Cancer Res. 2022. PMID: 35261809 Free PMC article.
-
In Silico Discovery of Potential Inhibitors Targeting the RNA Binding Loop of ADAR2 and 5-HT2CR from Traditional Chinese Natural Compounds.Int J Mol Sci. 2023 Aug 9;24(16):12612. doi: 10.3390/ijms241612612. Int J Mol Sci. 2023. PMID: 37628792 Free PMC article.
References
-
- Friedman JM, Birch PH. Type 1 neurofibromatosis: a descriptive analysis of the disorder in 1,728 patients. Am J Med Genet. 1997;70:138–143. - PubMed
-
- Lee MJ, Stephenson DA. Recent developments in neurofibromatosis type 1. Curr Opin Neurol. 2007;20:135–141. - PubMed
-
- Darrigo LG Jr, Geller M, Bonalumi Filho A, Azulay DR. Prevalence of plexiform neurofibroma in children and adolescents with type I neurofibromatosis. J Pediatr (Rio J) 2007;83:571–573. - PubMed
-
- Hirbe AC, Gutmann DH. Neurofibromatosis type 1: a multidisciplinary approach to care. Lancet Neurol. 2014;13:834–843. - PubMed
-
- Korf BR. Plexiform neurofibromas. Am J Med Genet. 1999;89:31–37. - PubMed
LinkOut - more resources
Full Text Sources
Research Materials
Miscellaneous