

Low miR-16 expression induces regulatory CD4+NKG2D+ T cells involved in colorectal cancer progression
- PMID: 33948372
- PMCID: PMC8085839
Low miR-16 expression induces regulatory CD4+NKG2D+ T cells involved in colorectal cancer progression
Abstract
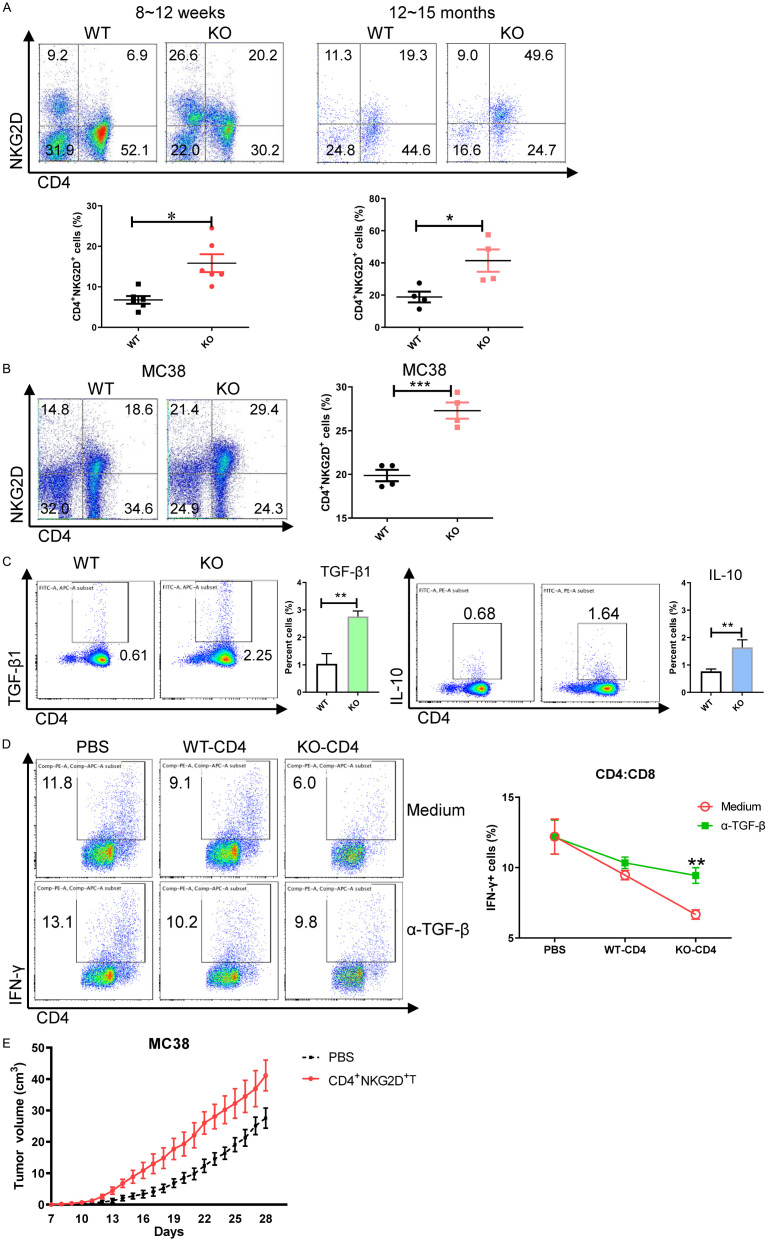
MiR-15a/16 is a member of the miRNA cluster that exhibits tumor suppression and immune modulation via targeting multiple genes. Decreased miR-15a/16 expression is involved in many cancer cells. Here, miR-16 had decreased expression in NK1.1-CD4+NKG2D+ T cells and bound with the 3'-UTR of NKG2D gene. MiR-15a/16-deficient mice had many CD4+NKG2D+ T cells, which produced TGF-β1 and IL-10 and inhibited the IFN-γ production of CD8+ T cells. Adoptive transfer of NK1.1-CD4+NKG2D+ T cells from miR-15a/16-deficient mice promoted tumor growth in vivo. However, no changes for NK1.1-CD4+NKG2D+ T cells were found in the miR-15a/16-transgenic mice. Although the miR-15a/16 transgenic mice transplanted with B16BL6 or MC38 cells exhibited rapid growth, these tumor-bearing mice did not show changes in NK1.1-CD4+NKG2D+ T cell distributions in either spleens or tumors. When NK1.1-CD4+ T cells were stimulated by α-CD3/sRAE-1 ex vivo, the NKG2D expression was difficult to induce in the T cells of miR-15a/16-transgenic mice. Finally, increased frequencies of regulatory CD4+NKG2D+ T cells with low miR-16 levels were observed in patients with late-stage colorectal cancer (Duke's C, D). Thus, miR-16 modulates NK1.1-CD4+NKG2D+ T cell functions via targeting NKG2D. Low miR-16 expression in CD4+ T cells induces the regulatory CD4+NKG2D+ T subpopulation, which promotes tumor evasion via the secretion of immune-suppressive molecules.
Keywords: CD4+ T cell; NKG2D; colorectal cancer; miR-15a/16; regulation.
AJCR Copyright © 2021.
Conflict of interest statement
None.
Figures


Similar articles
-
Regulatory NK1.1-CD4+NKG2D+ subset induced by NKG2DL+ cells promotes tumor evasion in mice.Cancer Immunol Immunother. 2018 Jul;67(7):1159-1173. doi: 10.1007/s00262-018-2172-6. Epub 2018 May 25. Cancer Immunol Immunother. 2018. PMID: 29802426 Free PMC article.
-
Early growth response genes 2 and 3 induced by AP-1 and NF-κB modulate TGF-β1 transcription in NK1.1- CD4+ NKG2D+ T cells.Cell Signal. 2020 Dec;76:109800. doi: 10.1016/j.cellsig.2020.109800. Epub 2020 Oct 1. Cell Signal. 2020. PMID: 33011290
-
TGF-β1 expression in regulatory NK1.1-CD4+NKG2D+ T cells dependents on the PI3K-p85α/JNK, NF-κB and STAT3 pathways.Am J Cancer Res. 2018 Mar 1;8(3):489-501. eCollection 2018. Am J Cancer Res. 2018. PMID: 29637003 Free PMC article.
-
Astilbin promotes the induction of regulatory NK1.1- CD4+ NKG2D+ T cells through the PI3K, STAT3, and MAPK signaling pathways.Int Immunopharmacol. 2020 Apr;81:106143. doi: 10.1016/j.intimp.2019.106143. Epub 2020 Feb 13. Int Immunopharmacol. 2020. PMID: 32062080
-
NK1.1- CD4+ NKG2D+ T cells suppress DSS-induced colitis in mice through production of TGF-β.J Cell Mol Med. 2017 Jul;21(7):1431-1444. doi: 10.1111/jcmm.13072. Epub 2017 Feb 22. J Cell Mol Med. 2017. PMID: 28224733 Free PMC article.
Cited by
-
Identification of a Twelve-microRNA Signature with Prognostic Value in Stage II Microsatellite Stable Colon Cancer.Cancers (Basel). 2023 Jun 23;15(13):3301. doi: 10.3390/cancers15133301. Cancers (Basel). 2023. PMID: 37444411 Free PMC article.
-
A microRNA-regulated transcriptional state defines intratumoral CD8+ T cells that respond to immunotherapy.Cell Rep. 2025 Feb 25;44(2):115301. doi: 10.1016/j.celrep.2025.115301. Epub 2025 Feb 12. Cell Rep. 2025. PMID: 39951377 Free PMC article.
-
microRNA-16-5p suppresses cell proliferation and angiogenesis in colorectal cancer by negatively regulating forkhead box K1 to block the PI3K/Akt/mTOR pathway.Eur J Histochem. 2022 May 10;66(2):3333. doi: 10.4081/ejh.2022.3333. Eur J Histochem. 2022. PMID: 35536149 Free PMC article.
-
CircRNA_002178 as a ceRNA promotes the development of colorectal cancer by regulating miR-542-3p/CREB1.Am J Transl Res. 2021 Sep 15;13(9):10038-10055. eCollection 2021. Am J Transl Res. 2021. PMID: 34650680 Free PMC article.
References
-
- Calin GA, Dumitru CD, Shimizu M, Bichi R, Zupo S, Noch E, Aldler H, Rattan S, Keating M, Rai K, Rassenti L, Kipps T, Negrini M, Bullrich F, Croce CM. Frequent deletions and down-regulation of micro-RNA genes miR15 and miR16 at 13q14 in chronic lymphocytic leukemia. Proc Natl Acad Sci U S A. 2002;99:15524–15529. - PMC - PubMed
-
- Huang E, Liu R, Chu Y. miRNA-15a/16: as tumor suppressors and more. Future Oncol. 2015;11:2351–2363. - PubMed
-
- Qian J, Jiang B, Li M, Chen J, Fang M. Prognostic significance of microRNA-16 expression in human colorectal cancer. World J Surg. 2013;37:2944–2949. - PubMed
-
- Wu WL, Wang WY, Yao WQ, Li GD. Suppressive effects of microRNA-16 on the proliferation, invasion and metastasis of hepatocellular carcinoma cells. Int J Mol Med. 2015;36:1713–1719. - PubMed
LinkOut - more resources
Full Text Sources
Research Materials