. 2021 Mar 29;24(4):102372.
doi: 10.1016/j.isci.2021.102372. eCollection 2021 Apr 23.

Early satellite cell communication creates a permissive environment for long-term muscle growth

Affiliations

Early satellite cell communication creates a permissive environment for long-term muscle growth

Kevin A Murach et al. iScience. .

Abstract

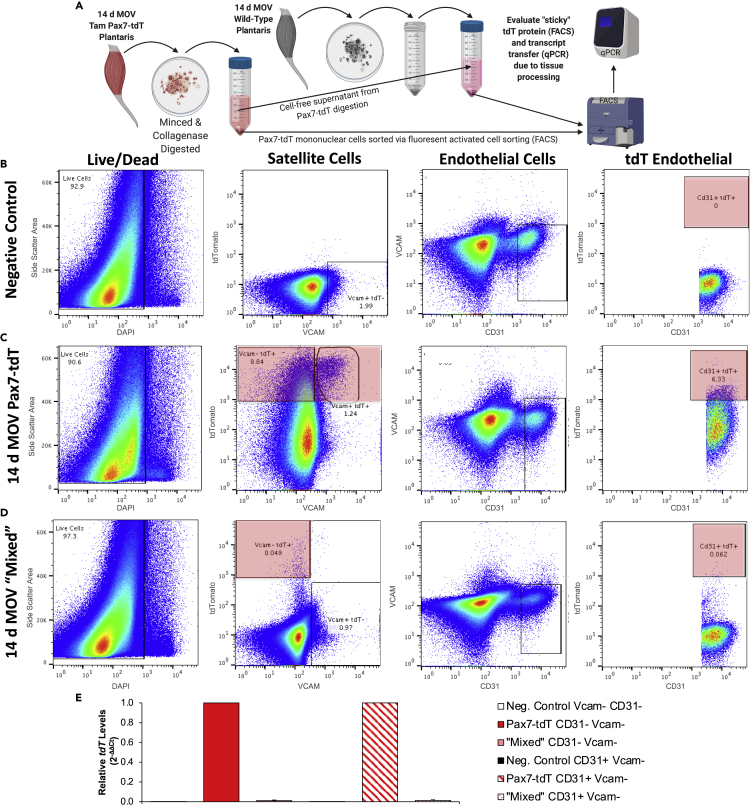
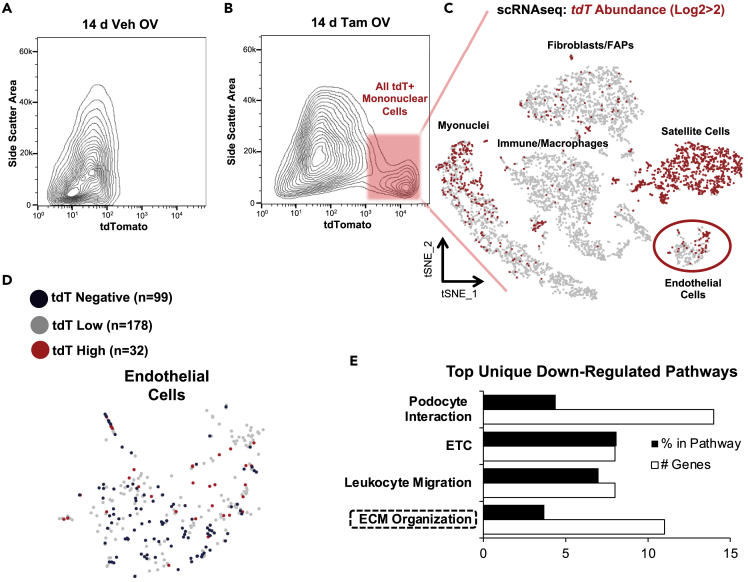
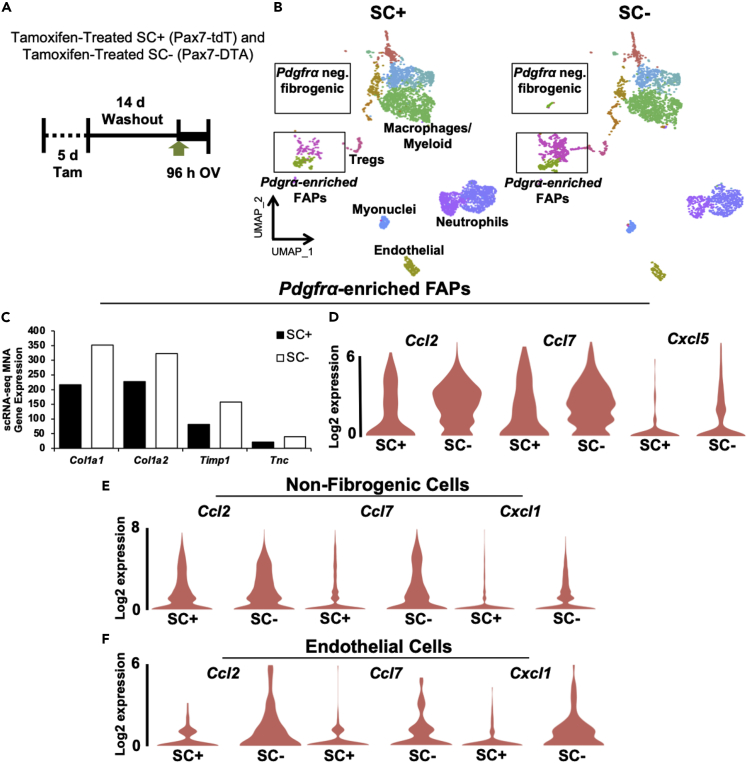
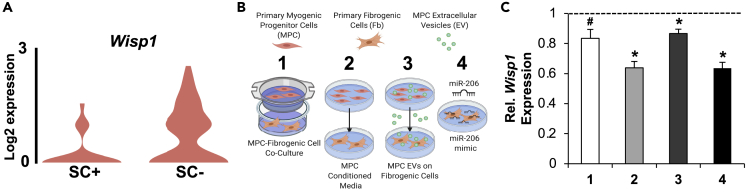
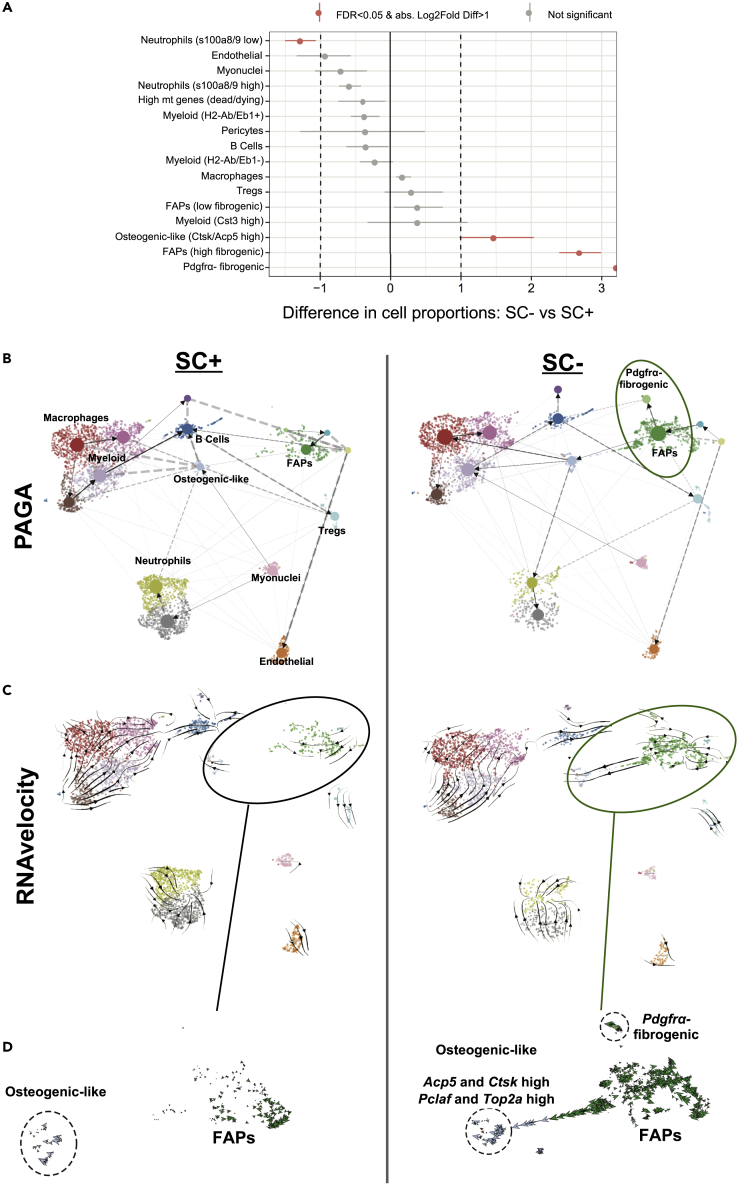
Using in vivo muscle stem cell (satellite cell)-specific extracellular vesicle (EV) tracking, satellite cell depletion, in vitro cell culture, and single-cell RNA sequencing, we show satellite cells communicate with other cells in skeletal muscle during mechanical overload. Early satellite cell EV communication primes the muscle milieu for proper long-term extracellular matrix (ECM) deposition and is sufficient to support sustained hypertrophy in adult mice, even in the absence of fusion to muscle fibers. Satellite cells modulate chemokine gene expression across cell types within the first few days of loading, and EV delivery of miR-206 to fibrogenic cells represses Wisp1 expression required for appropriate ECM remodeling. Late-stage communication from myogenic cells during loading is widespread but may be targeted toward endothelial cells. Satellite cells coordinate adaptation by influencing the phenotype of recipient cells, which extends our understanding of their role in muscle adaptation beyond regeneration and myonuclear donation.

Keywords: Cell Biology; Functional Aspects of Cell Biology.


Conflict of interest statement

The authors have no conflicts to declare.

Figures

None
Graphical abstract
Figure 1
Figure 1
Delivery of tdTomato (tdT) from myogenic cells to mononuclear cells throughout skeletal muscle during 14 days of mechanical overload (MOV) of the plantaris (A) Experimental design schematic showing vehicle (Veh) or tamoxifen (Tam) administration for 5 consecutive days (5 d), washout period, and 14 day MOV in Pax7-tdT mice; n = 3 mice/6 plantaris muscles pooled for analysis captured at the same exposure and adjusted the same as the image in (B), scale bar, 20 μm. (B) Flow cytometry plot illustrating Vcam+ tdT- satellite cells (SCs) of Veh-treated Pax7-tdT MOV plantaris muscle; SCs were also negative for CD31 (endothelial cell marker), CD45 (immune cell marker), and Sca1 (mesenchymal stem cell marker). (C) Flow cytometry plot illustrating Vcam+ tdT+ SCs (population 1) in Tam-treated Pax7-tdT MOV plantaris muscle. SCs were also CD31-/CD45-/Sca1-. (D) Flow cytometry plot illustrating endothelial, immune, and mesenchymal stem cells in Veh-treated Pax7-tdT MOV muscle, all identified via FITC-conjugated antibodies (population 2). (E) Flow cytometry plot illustrating endothelial, immune, and mesenchymal cells that were tdT- (population 3) and tdT+ (population 4) in Tam-treated Pax7-tdT MOV muscle, all identified via FITC-conjugated antibodies. Another cloud of tdT+ cells (population 5, most likely fibrogenic cells) was also identified. (F) Quantitative real-time PCR for tdT mRNA abundance in populations 1–5. Dotted line represents tdT- cells sorted from the tdTfl/fl parental strain (n = 3/group: Veh, Tam, and tdT parental mice, each pooled for sorting and RNA isolation), normalized to Gapdh and presented relative to parental strain cells using 2−ΔΔCt. See also Figure S1 and Video S1.
Figure 2
Figure 2
Presence of tdTomato (tdT) protein and mRNA in non-satellite cells (SCs) during mechanical overload (MOV) is not attributable to technical artifact from tissue processing (A) Experimental design illustrating how cell-free supernatant from digested Tam-treated 14-day MOV Pax7-tdT muscles (n = 2 mice/4 plantaris) was used to digest wild-type (no tdT transgene in genome) 14 d MOV muscles (“mixed”, n = 3 mice/2 separate pools of 3 plantaris, processed as technical replicates), followed by FACS isolation of different populations for downstream analyses. (B) Flow cytometry plots from muscle digest of unperturbed wild-type muscle (triceps and quadriceps), used as a negative control for tdT fluorescence; forward and side scatter area gating not shown. (C) Flow cytometry plots from Tam-treated 14-day MOV Pax7-tdT muscles, confirming the appearance of tdT in satellite and non-satellite cell (endothelial and non-endothelial) populations; forward and side scatter area gating not shown. (D) Flow cytometry plots from MOV wild-type control plantaris muscle digested with the cell-free supernatant from Tam-treated 14-day MOV Pax7-tdT plantaris muscle (“mixed”); forward and side scatter area gating not shown. (E) tdT mRNA levels in Vcam-/CD31- mononuclear cells and CD31+/Vcam- endothelial cells in resting control, Tam-treated 14-day MOV Pax7-tdT, and 14-day MOV wild-type control muscle “mixed” with cell-free supernatant from the Pax7-tdT muscle digestion, normalized to 18S rRNA and presented relative to the respective cell type in the Pax7-tdT condition using 2−ΔΔCt. See also Figures S2 and S3.
Figure 3
Figure 3
Single-cell RNA sequencing (scRNA-seq) analysis of extracellular vesicle (EV)-mediated communication from myogenic cells during 14 days of mechanical overload (MOV) (A) Flow cytometry plot illustrating a lack of tdTomato+ (tdT+) cells in Veh-treated 14 d MOV Pax7-tdT plantaris muscle (n = 1 mouse/2 plantaris muscles, used for establishing background fluorescence). (B) Flow cytometry plot illustrating tdT+ cells in Tam-treated 14 d MOV plantaris muscle (n = 4 mice/8 plantaris muscles pooled for analysis). (C) t-distributed stochastic neighbor embedding atlas representing appreciable (log2>2) tdT transcript detected in the Tam-treated Pax7-tdT MOV sample via scRNA-seq. (D) Endothelial cell cluster from t-distributed stochastic neighbor embedding (t-SNE) atlas, illustrating tdT-negative cells (Log2tdT, tdT 5′, Pax7, Myod, and Myog = 0, n = 99 blue cells) and tdT high cells (Log2tdT > 2, tdT5′, Pax7, Myod, and Myog = 0, n = 32 red cells). (E) Top unique downregulated pathways from KEGG, WikiPathways, and Reactome analyses using the top 100 differentially expressed genes in tdT high vs tdT-negative endothelial cells from the tdT+ FACS isolated cluster, organized in descending order according to p value (all were p < 0.05). ETC, electron transport chain, ECM, extracellular matrix. See also Figure S4.
Figure 4
Figure 4
scRNA-seq after 96 hr of mechanical overload (MOV) in the presence (SC+) and absence (SC-) of satellite cells (A) Experimental design schematic demonstrating the Tam treatment strategy, washout period, and 96 hr synergist ablation-induced MOV in Pax7-tdT (SC+) and Pax7-DTA (SC-) mice, n = 4 mice/8 pooled plantaris per group. (B) Uniform manifold approximation and projection (UMAP) atlas of scRNA-seq data in 96 hr MOV SC+ and SC- plantaris muscle. FAP, fibro/adipogenic progenitor cell, Treg, T-regulatory cell. (C) Expression of extracellular matrix-related genes in Pdgfrα-enriched FAPs during MOV in the presence (SC+) and absence (SC-) of SCs. (D–F) Expression of chemokine genes in the presence or absence of SCs in (D) Pdgfrα-enriched FAP clusters, (E) non-fibrogenic cells, and (F) endothelial cells. MNA, median normalized average. See also Figure S5.
Figure 5
Figure 5
Wisp1 in primary fibrogenic cells (Fbs) is regulated by primary myogenic progenitor cells (MPCs) via an EV-mediated miR-206 delivery mechanism (A) Wisp1 levels in Pdgfrα-high FAPs after 96 hr of MOV in the presence and absence of satellite cells (SCs), measured by scRNA-seq. (B) Experimental design schematic illustrating (1) MPC-Fb co-culture, (2) MPC conditioned media incubated with Fbs, (3) MPC EVs incubated with Fbs, and (4) miR-206 mimic or scrambled oligonucleotide transfected into Fbs for 24 hr. (C) Wisp1 gene expression in Fbs in conditions 1–4, relative to their respective control condition (dotted line), normalized to the geomean of 18S rRNA and Gapdh and presented as 2−ΔΔCt. #p = 0.05, ∗p < 0.05, data are presented as mean ± SEM.
Figure 6
Figure 6
scRNA-seq trajectory inference analyses after 96 hr of mechanical overload (MOV) in the presence and absence of satellite cells (SCs) (A) Statistical differences in Log2 cell proportions in scRNA-seq experiments between 96 hr of MOV in SC+ and SC- plantaris muscles. (B) Partition-based graph abstraction (PAGA) analysis illustrates the appearance of a Pdgfrα-negative fibrogenic cell population in the absence of satellite cells. (C) RNA velocity analysis shows FAPs predicted to be transitioning toward two distinct cell populations in the absence of satellite cells. (D) Magnified view of the FAP cluster from RNA velocity showing a Pdgfrα-negative fibrogenic cell population in close proximity to FAPs, as well as an osteogenic-like cell population predicted to arise from FAPs preferentially in the absence of SCs during MOV.
Figure 7
Figure 7
The presence of satellite cells (SCs) for the first 96 hr of mechanical overload (MOV) is sufficient to control extracellular matrix deposition and support long-term hypertrophy of the plantaris muscle (A) Experimental design schematic demonstrating the Veh and Tam treatment strategy after 96 hr of MOV (SC+96 hr and SC-96 hr, respectively) followed by 47 days of MOV (to 8 total weeks) in Pax7-DTA mice. Three mice were removed from this analysis: two in the tamoxifen-treated MOV group due to poor satellite cell depletion and one vehicle-treated MOV due to marked signs of regeneration and/or fiber splitting (numerous central nuclei and large heterogeneity in fiber size) (Murach et al., 2019), resulting in n = 4 for sham and n = 5 for MOV in each condition. (B) Satellite cell quantity in Veh- and Tam-treated mice. p < 0.05 effect of tamoxifen, #p < 0.05 effect of MOV. (C) Myonuclei per fiber in SC+96 hr and SC-96 hr muscles, measured in isolated single muscle fibers. p < 0.05 interaction effect. (D) Muscle weight in the presence and absence of satellite cells. #p < 0.05 effect of MOV. (E) Total muscle fiber cross-sectional area (CSA) distribution in SC+96 hr and SC-96 hr muscles. (F) Muscle fiber CSA presented as relative frequency. #p < 0.05 effect of MOV. (G) Fiber number on cross section, #p < 0.05 effect of MOV. (H) Representative image of extracellular matrix via picrosirius red (PSR) staining after MOV in SC+96 hr and SC-96 hr, scale bar, 100 μm. (I) PSR area normalized to muscle area, p = 0.07 main effect for MOV. Data are presented as mean ± SEM.

References

    1. Adler M., Mayo A., Zhou X., Franklin R.A., Meizlish M.L., Medzhitov R., Kallenberger S.M., Alon U. Principles of cell circuits for tissue repair and fibrosis. iScience. 2020;23:100841. - PMC - PubMed
    1. Álvarez-Aznar A., Martinez-Corral I., Daubel N., Betsholtz C., Mäkinen T., Gängel K. Tamoxifen-independent recombination of reporter genes limits lineage tracing and mosaic analysis using CreER T2 lines. Trans. Res. 2020;29:53–68. - PMC - PubMed
    1. Aswad H., Forterre A., Wiklander O.P.B.,, Guillaume V., Danty-Berger E., Jalabert A., Lamaziere A., Meugnier E., Pesenti S., Ott C. Exosomes participate in the alteraion of muscle homeostasis during lipid-induced insulin resistance in mice. Diabetologia. 2014;57:2155–2164. - PMC - PubMed
    1. Bachman J.F., Klose A., Liu W., Paris N.D., Blanc R.S., Schmalz M., Knapp E., Chakkalakal J.V. Prepubertal skeletal muscle growth requires Pax7-expressing satellite cell-derived myonuclear contribution. Development. 2018;145:dev167197. - PMC - PubMed
    1. Bergen V., Lange M., Peidli S., Wolf F.A., Theis F.J. Generalizing RNA velocity to transient cell states through dynamical modeling. Nat. Biotech. 2020;38:1408–1414. - PubMed

LinkOut - more resources