. 2021 Apr 9;2(4):100227.
doi: 10.1016/j.xcrm.2021.100227. eCollection 2021 Apr 20.

Hypoxia-sensing CAR T cells provide safety and efficacy in treating solid tumors

Affiliations

Hypoxia-sensing CAR T cells provide safety and efficacy in treating solid tumors

Paris Kosti et al. Cell Rep Med. .

Abstract

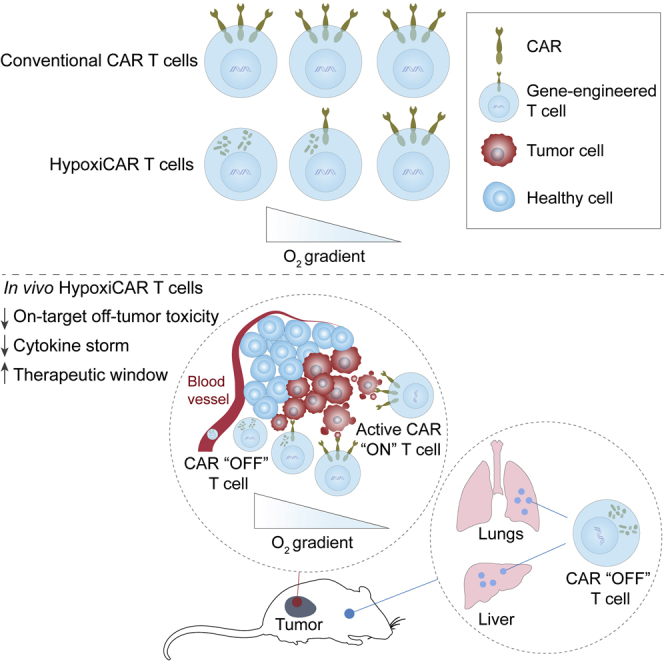
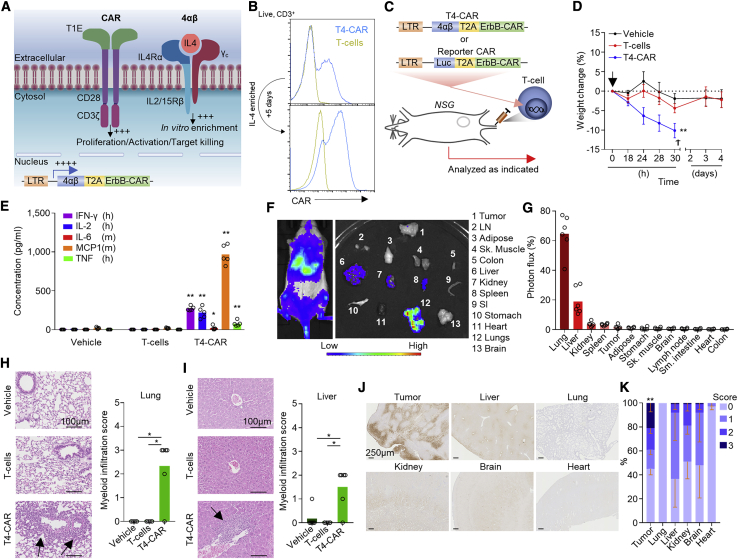
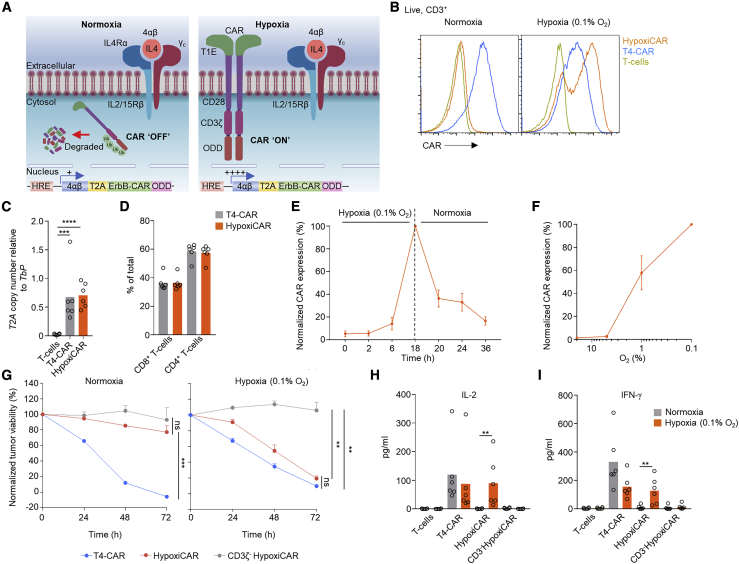
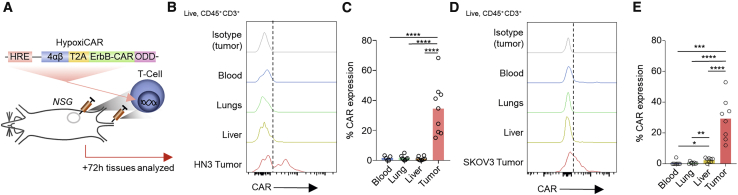
Utilizing T cells expressing chimeric antigen receptors (CARs) to identify and attack solid tumors has proven challenging, in large part because of the lack of tumor-specific targets to direct CAR binding. Tumor selectivity is crucial because on-target, off-tumor activation of CAR T cells can result in potentially lethal toxicities. This study presents a stringent hypoxia-sensing CAR T cell system that achieves selective expression of a pan-ErbB-targeted CAR within a solid tumor, a microenvironment characterized by inadequate oxygen supply. Using murine xenograft models, we demonstrate that, despite widespread expression of ErbB receptors in healthy organs, the approach provides anti-tumor efficacy without off-tumor toxicity. This dynamic on/off oxygen-sensing safety switch has the potential to facilitate unlimited expansion of the CAR T cell target repertoire for treating solid malignancies.

Keywords: CAR T cells; HIF1α; HypoxiCAR; T cell; cancer; chimeric antigen receptor; cytokine release syndrome; hypoxia; immunotherapy; toxicity.


Figures

None
Graphical abstract
Figure 1
Figure 1
I.v.-infused T4-CAR T cells cause inflammation in healthy organs (A) Diagram depicting T4-CAR. (B) Example histograms of surface CAR expression on live (7-aminoactinomycin D [7AAD]) CD3+ T4-CAR or non-transduced human T cells, assessed using flow cytometry before and after expansion in IL-4. (C–E) On day 13 after subcutaneous HN3 tumor cell inoculation, mice were infused i.v. with vehicle or 10 × 106 non-transduced or T4-CAR T cells (n = 5). (C) Schematic depicting the experiment. (D) Weight change of the mice. The arrow denotes T cell infusion, and the cross denotes the humane endpoint. (E) Serum cytokines 24 h after infusion. (F) Low-dose human ErbB-CAR/Luc T cells (4.5 × 106) were infused i.v. into SKOV3 tumor-bearing NSG mice, and 4 days later, bioluminescence imaging was performed on the whole body and dissected organs. LN, inguinal lymph node; SI, small intestine. (G) Quantification of the photons per second per unit area as percentage of all organs (n = 6). (H and I) H&E-stained sections (left) and quantitation of myeloid infiltration (right) in the lungs (H) and liver (I) 5 days after i.v. infusion of low-dose 4.5 × 106 T4-CAR, non-transduced T cells, or vehicle. Arrows indicate myeloid infiltrates. (J and K) Immunohistochemistry (IHC) staining of tissue sections for reductively activated pimonidazole in tumor bearing NSG mice (J) and quantitation of the staining, scoring between 0–3, from no staining (0) to intense staining (3), as percent area of the tissue (K). All experiments are representative of a biological repeat. In line charts, the dots mark the mean and error bars SEM. Bar charts show the mean and points individual mice. ∗p < 0.05, ∗∗p < 0.01.
Figure 2
Figure 2
HypoxiCAR T cell CAR surface expression and effector function are restricted stringently to hypoxic environments (A) Diagram depicting HypoxiCAR in normoxia and hypoxia. (B) Example histograms of surface CAR expression on live (7AAD) CD3+ T4-CAR, HypoxiCAR, and non-transduced human T cells in normoxic or 18-h hypoxic (0.1% O2) conditions, assessed using flow cytometry. (C) Genomic DNA from T4-CAR, HypoxiCAR, and non-transduced T cell preparations subjected to qPCR for T2A copy number relative to that of Tbp in the genomic DNA. (D) The relative prevalence of CD4+/CD8+ T cells among CD3+ T cells, assessed using flow cytometry in the T cell, T4-CAR, and HypoxiCAR preparations (n = 6). (E) Surface CAR expression on HypoxiCAR T cells at the indicated times under hypoxia (0.1% O2) and re-exposure to normoxia, assessed normalized to 18-h hypoxia (n = 6). (F) Surface CAR expression on HypoxiCAR T cells after 18-h exposure to 20%, 5%, 1%, and 0.1% O2 (n = 6)’ values are normalized to 0.1% O2. (G–I) In vitro SKOV3 tumor cell killing by T4-CAR, HypoxiCAR, CD3ζ-truncated HypoxiCAR (CD3ζ-; to prevent intracellular signaling), and non-transduced T cells (effector to target cell ratio 1:1) under normoxic and 0.1% O2 hypoxic conditions. (H and I) Quantification of IL-2 (H) and IFN-γ (I) released into the medium from the respective T cells after 24-h and 48-h exposure to SKOV3 cells, respectively, under normoxic and 0.1% O2 hypoxic conditions. All experiments are representative of a biological repeat. Bars on charts show the mean and points an individual healthy donor. In line charts, the dots mark the mean and error bars SEM. ∗p < 0.05, ∗∗p < 0.01, ∗∗∗p < 0.001, ∗∗∗∗p < 0.0001.
Figure 3
Figure 3
HypoxiCAR T cells express CAR on their surface specifically in tumors (A) Schematic depicting the experiment. (B–E) Subcutaneous tumor-bearing NSG mice were injected concurrently i.v. and i.t. with human HypoxiCAR T cells (2.5 × 105 i.t. and 7.5 × 105 i.v.) 72 h prior to sacrifice. Representative histograms showing surface CAR expression on live nucleated (7AAD, Ter119) CD45+ CD3+ HypoxiCAR T cells in the indicated enzyme-dispersed tissues and blood (B) and frequency of CAR expression (C) in HN3 tumor-bearing mice (n = 9). (D) and (E) represent the same respective analysis in SKOV3 tumor-bearing NSG mice (n = 8). All experiments are representative of a biological repeat. Bar charts shows the mean and each point an individual mouse. ∗p < 0.05, ∗∗p < 0.01, ∗∗∗p < 0.001, ∗∗∗∗p < 0.0001.
Figure 4
Figure 4
HypoxiCAR T cells provide anti-tumor efficacy without systemic toxicity (A-C) Sixteen days after subcutaneous HN3 tumor cell inoculation, mice were infused i.v. with vehicle or 10 × 106 T4-CAR, HypoxiCAR, or non-transduced human T cells (control) (n = 4 mice). (A) Schematic depicting the experiment. (B) Weight change of the mice. (C) Serum cytokines 24 h after infusion. (D and E) Low-dose (4.5 × 106) T4-CAR or HypoxiCAR T cells were infused i.v. into NSG mice, and five days later, the indicated tissues were excised, and myeloid infiltration was scored in the lungs (D) and liver (E) (n = 5–6). (F) HN3 tumor growth curves from (A)–(C), with an arrow marking the point of CAR T cell infusion. (G–J) Schematic depicting the experiment in which HypoxiCAR T cells or T cells were transduced to express a constitutive rLuc/EGFP reporter to allow in vivo tracking (G). Mice bearing established SKOV3 tumors were infused i.v. with vehicle (n = 6) or 10 × 106 reporter HypoxiCAR (n = 7) or reporter T cells (n = 5) (H). Bioluminescence imaging was performed on the whole body of mice to track the biodistribution of the infused HypoxiCAR T cells on day 26 after infusion. The red box marks the SKOV3 tumor (I). Also shown is quantification of the percent photon flux (photons per second per unit area) signal detected specifically in the tumor out of total photon flux across the whole body (J). (K–M) Example IHC-stained human HNSCC section for HIF1α (red) and CD3 (brown) (K). The abundance of inter-epithelial T cells (IETs) (L) (example marked by a black arrow in K), low/absent n = 40 and high n = 52, was assessed against the HIF1α stabilization score of the tumor (L). For tumors where IETs were high, tumor-infiltrating lymphocytes (TILs) directly infiltrating HIF-1α stabilized regions of the tumor (H-TILs; examples marked by white arrows in K) were scored as absent (n = 6 of 52 tumors) or present (n = 46 of 52 tumors) and plotted against the HIF1α stabilization score of the tumor (M). (N) Immunofluorescence images from a human oral tongue carcinoma stained with DAPI (nuclei, blue) and antibodies against CD3 (green) and HIF1α (red); white denotes CD3 and HIF1α co-localization. All experiments are representative of a biological repeat. Bar charts shows the mean and each point an individual mouse. In line charts, the dots mark the mean and error bars SEM. Boxplots show median and upper/lower quartiles, and whiskers show the highest and lowest value.∗p < 0.05, ∗∗p < 0.01, ∗∗∗p < 0.001, ∗∗∗∗p < 0.0001.

Comment in

References

    1. Johnson L.A., June C.H. Driving gene-engineered T cell immunotherapy of cancer. Cell Res. 2017;27:38–58. - PMC - PubMed
    1. Kosti P., Maher J., Arnold J.N. Perspectives on Chimeric Antigen Receptor T-Cell Immunotherapy for Solid Tumors. Front. Immunol. 2018;9:1104. - PMC - PubMed
    1. Morgan R.A., Yang J.C., Kitano M., Dudley M.E., Laurencot C.M., Rosenberg S.A. Case report of a serious adverse event following the administration of T cells transduced with a chimeric antigen receptor recognizing ERBB2. Mol. Ther. 2010;18:843–851. - PMC - PubMed
    1. Holbro T., Hynes N.E. ErbB receptors: directing key signaling networks throughout life. Annu. Rev. Pharmacol. Toxicol. 2004;44:195–217. - PubMed
    1. Karachaliou N., Lazzari C., Verlicchi A., Sosa A.E., Rosell R. HER3 as a Therapeutic Target in Cancer. BioDrugs. 2017;31:63–73. - PubMed

Publication types

Substances