. 2021 Apr 12;2(4):100243.
doi: 10.1016/j.xcrm.2021.100243. eCollection 2021 Apr 20.

A highly multiplexed droplet digital PCR assay to measure the intact HIV-1 proviral reservoir

Affiliations

A highly multiplexed droplet digital PCR assay to measure the intact HIV-1 proviral reservoir

Claire N Levy et al. Cell Rep Med. .

Abstract

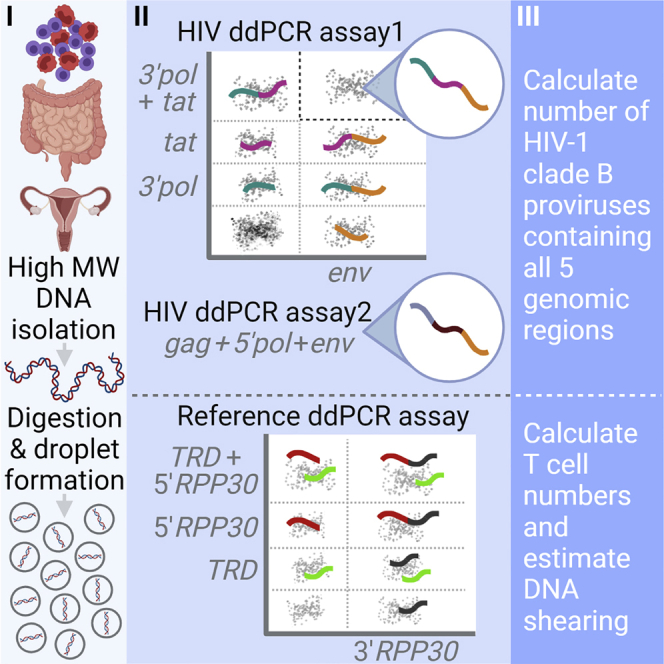
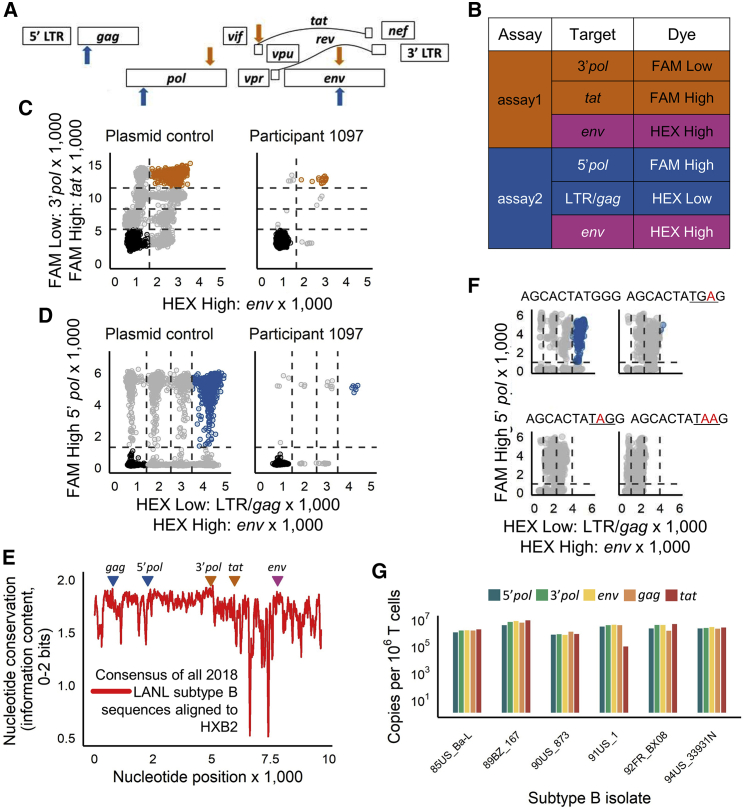
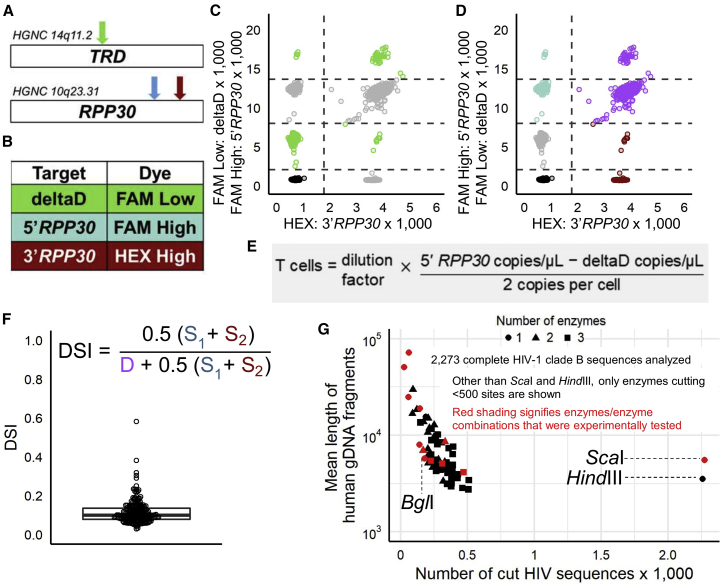
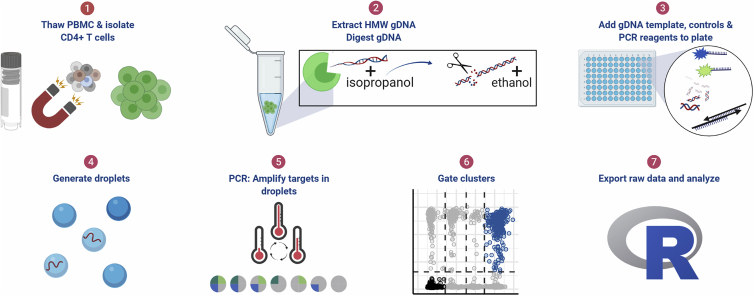
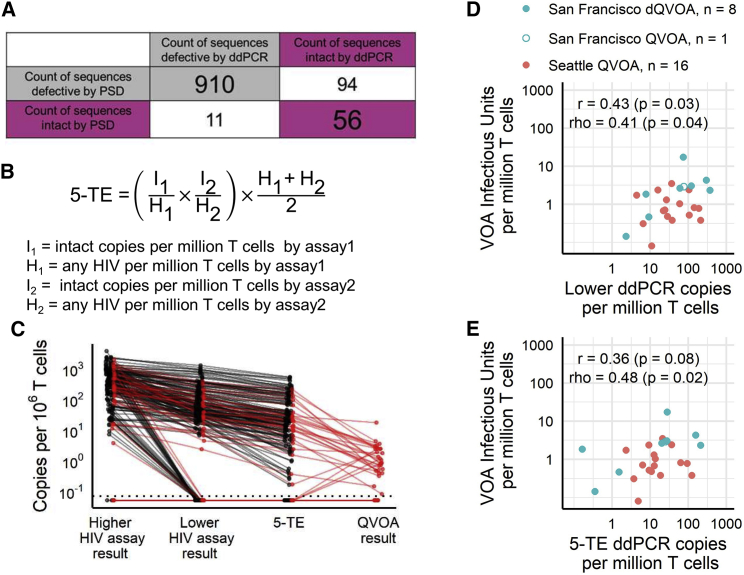
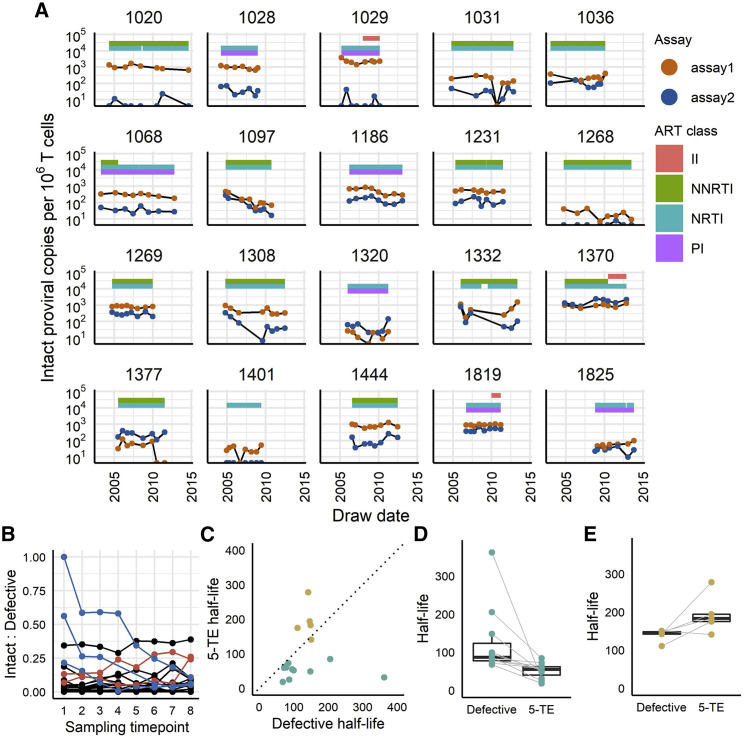
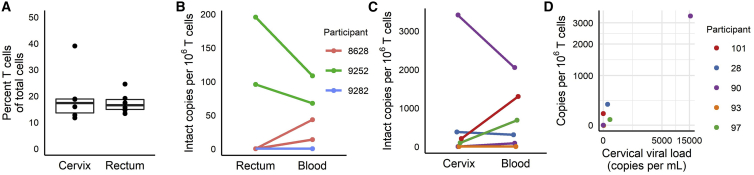
Quantifying the replication-competent HIV reservoir is essential for evaluating curative strategies. Viral outgrowth assays (VOAs) underestimate the reservoir because they fail to induce all replication-competent proviruses. Single- or double-region HIV DNA assays overestimate it because they fail to exclude many defective proviruses. We designed two triplex droplet digital PCR assays, each with 2 unique targets and 1 in common, and normalize the results to PCR-based T cell counts. Both HIV assays are specific, sensitive, and reproducible. Together, they estimate the number of proviruses containing all five primer-probe regions. Our 5-target results are on average 12.1-fold higher than and correlate with paired quantitative VOA (Spearman's ρ = 0.48) but estimate a markedly smaller reservoir than previous DNA assays. In patients on antiretroviral therapy, decay rates in blood CD4+ T cells are faster for intact than for defective proviruses, and intact provirus frequencies are similar in mucosal and circulating T cells.

Keywords: HIV cure; HIV reservoir; IPDA; digital PCR; genital mucosa; intact proviral DNA assay; intestinal mucosa; multiplexing; rectal; viral outgrowth assay.


Conflict of interest statement

The authors declare no competing interests.

Figures

None
Graphical abstract
Figure 1
Figure 1
Design of the two HIV-1 triplex ddPCR assays (A) Primer/probe locations within the HIV-1 genome. Orange arrows, assay1 targets; blue arrows, assay2 targets. (B) Probe dyes and targets that constitute the two assays. Pink shading signifies the common env target. (C) ddPCR results from assay1 run on a plasmid control (plasmid mixtures of all possible single, dual, and triple combinations of all assay target regions) and participant 1097 (DNA extracted from CD4+ T cells isolated from an HIV-infected patient on ART). Orange dots indicate droplets positive for all three targets in assay1. (D) DNA templates as in (C). ddPCR results from assay2. Blue dots indicate droplets positive for all three targets in assay2. Three replicate wells were run for each HIV assay, and droplet counts were pooled. (E) Nucleotide conservation based on available subtype B HIV genome sequences from the Los Alamos National Laboratory (LANL) database aligned to HXB2. Triangles indicate position of the five probes. (F) Impact of hypermutation in the env probe sequences on ddPCR assay performance. A shift in HEX signal occurs when env plasmid sequences with introduced stop codons are used as the ddPCR template. Each test plasmid sequence, corresponding to coordinates 7352-7362 in HIV-1 NC_001802 (env), is indicated above its respective plot. Red bases show where G was substituted by A in the plasmid. These G-to-A hypermutations introduce stop codons (underlined). The upper left plot represents the pattern when the probe matches the plasmid coding strand sequence. The other three plots show the consequence of hypermutations on env target detection. The depicted plots are representative of 7 replicates of assay2. (G) DNA from PBMCs infected with five distinct HIV-1 subtype B viral isolates (indicated on the x axis) was quantified with both assay1 and assay2. Shown are the total number of copies detected for each target region. For each isolate, 2–4 replicate wells each were run for assay1 and assay2. One or 2 wells were run for the corresponding reference assay.
Figure 2
Figure 2
ddPCR reference assay (A) Target locations for the ddPCR reference assay within the human genome. The D region target in the T cell receptor gene (TRD) (green arrow) is located on chromosome 14 and is lost during T cell receptor rearrangement (“deltaD”). Thus, the assay directly quantitates all non-T cells. The two RPP30 targets are located ~11 kbp apart from each other within the RPP30 gene on chromosome 10 (blue and red arrows). (B) Probe targets and corresponding dyes. (C) Representative PBMC sample indicating droplets positive for the deltaD target (green dots), used to estimate non-T cell numbers. (D) Same plot as (C) but indicating droplets positive for only the 5′RPP30 (blue dots), only the 3′RPP30 target (red dots), or both RPP30 targets (purple dots). The RPP30 targets are analyzed independently from the deltaD target to quantify shearing and total cells. (E) Formula used to calculate the number of total T cells. Division by 2 is necessary because each cell contains two gene copies. Dilution factor signifies dilution of the test sample for cell counting relative to the template for the HIV-1 ddPCR assay, which is undiluted. (F) DSI distribution for 225 PBMC-derived CD4+ T cell samples. The formula for the DNA Shearing Index (DSI), the DSI-corrected number of triple-positive proviral copies, is given, where D represents the count of droplets positive for both RPP30 targets (i.e., double positive) and S1 and S2 represent counts of droplets that are single positive for the 5′RPP30 and 3′RPP30 targets, respectively. (G) In silico analysis of the number of cutting sites in the HIV genome and mean human gDNA fragment length resulting from digestion by individual or combinations of commonly available restriction enzymes. The red symbols indicate those enzymes we subsequently tested in vitro. Two to four replicate wells were run for each test. ScaI and HindIII are typically recommended for digestion of gDNA prior to ddPCR. BglI yielded the best compromise between cutting very few HIV-1 sequences in the LANL HIV sequence database and cutting the human genome into ideal fragments for droplet generation, averaging ~6 kbp.
Figure 3
Figure 3
ddPCR protocol workflow (1) Thaw cryopreserved cells and isolate CD4+ T cells. For tissue samples, CD4+ T cells were not isolated. (2) Extract high molecular weight genomic DNA (gDNA) using guanidinium salts and isopropanol precipitation and then digest gDNA with the restriction enzyme BglI and precipitate the DNA with ethanol. (3) Add specimen gDNA, control plasmids, and PCR reagents to plate. (4) Generate droplets. (5) Conduct PCR reaction for amplification of targets in droplets. (6) Gate populations in QuantaSoft AP. (7) Analyze results in R.
Figure 4
Figure 4
Assay validation and estimation of true intactness (A) 2 × 2 table showing the number of sequences with predicted intact or defective calls using our protocol and the calls based on sequence analysis in the Proviral Sequence Database. (B) Equation to calculate the expected number of HIV genome copies per 106 T cells that would give triple-positive results from both HIV assays (5-target estimate [“5-TE”]): the probability of intactness by assay1 and intactness by assay2, multiplied by the average number of HIV copies (both intact and defective) that were detected across the two assays. (C) Approximation of true provirus intactness using the ddPCR protocol and relationship to quantitative viral outgrowth assay (QVOA). Shown are the lower and higher of the two HIV assay results (both n = 192), the 5-TE n = 192), and the QVOA result where available (red lines; n = 35). (D and E) Correlation between QVOA or dQVOA and the lower of the two assays (D) or 5-TE (E). Not included are samples where QVOA or ddPCR results were zero. Spearman’s rho and Pearson’s r are given, with p values resulting from tests of the null hypotheses that there is no monotonic (Spearman) or linear (Pearson) relationship between the two parameters. For the UW-CFAR_QVOA cohort (n = 14 PLH), two samples were tested at two different dilutions. For the San Francisco cohort (n = 9 PLH), one sample did not have a dQVOA result but did have a QVOA result (open blue circle). All tests were done with three replicate wells for the HIV assays and two replicate wells for the reference gene assay.
Figure 5
Figure 5
Longitudinal analysis of 20 PLH (A) Longitudinal testing of 20 PLH in Seattle. CD4+ T cells negatively selected from cryopreserved PBMC samples from 20 participants in the UW-CFAR_KINETICS cohort were tested at 8 time points (n = 17), 7 time points (n = 1), or 6 time points (n = 2) over a period of 4.5 – 10 years on ART. Shown are the results for intact proviral copy numbers measured by HIV-1 multiplex assay1 (orange circles) and assay2 (blue circles). All tests were done with three replicate wells for the HIV assays and two replicate wells for the reference gene assay. Data points falling on the x axis represent “undetectable.” Colored bars represent the participants’ drug regimens, categorized by class of drug action, over time. II, integrase inhibitors; NNRTI, non-nucleoside reverse transcriptase inhibitors; NRTI, nucleoside/nucleotide transcriptase inhibitors; PI, protease inhibitors. (B) Ratio of intact (5-TE) to defective proviral copies at each sampling time point for all 20 participants. Blue lines indicate a downward trend, and red lines indicate an upward trend. (C) Half-lives (months) of defective versus intact (5-TE) proviral copies (n = 16; 4 participants had no decay in intact copies). Teal circles indicate participants with intact (5-TE) half-life <10 years; light brown circles indicate >10 years. The diagonal dotted line signifies equal 5-TE and defective half-lives. (D) Defective and intact (5-TE) provirus half-lives for participants with 5-TE half-life <10 years. Boxes and whiskers: median; interquartile range, <1.5 × IQR and >1.5 × IQR. (E) Defective and intact (5-TE) provirus half-lives for participants with 5-TE half-life >10 years.
Figure 6
Figure 6
Paired testing of mucosal and blood specimens from 8 PLH (A) Percent T cells of total cells in rectal and ectocervical biopsies; n = 6 per tissue type. Boxes and whiskers: median; interquartile range, <1.5 × IQR and >1.5 × IQR. (B) DSI-corrected intact proviral copies per 1 million T cells in PBMCs and rectal biopsies. (C) DSI-corrected intact proviral copies per 1 million T cells in PBMCs and cervical biopsies. (D) Correlation between viral loads measured from cervicovaginal lavage versus intact proviral copies in cervical T cells by ddPCR. Axes in (D) are pseudo-log10 scaled, transitioning to a linear scale approaching zero. Samples from the Discordant Shedding Cohort were run with 6 replicate wells for assay2 (assay1 was not performed on these samples) and two replicate wells for the reference assay. For the ACTU-2100 Cohort, we ran 3–11 replicate wells for assay2 and 2–6 wells for the reference assay, depending on how much gDNA was available.

Comment in

Similar articles

Cited by

References

    1. Laird G.M., Eisele E.E., Rabi S.A., Lai J., Chioma S., Blankson J.N., Siliciano J.D., Siliciano R.F. Rapid quantification of the latent reservoir for HIV-1 using a viral outgrowth assay. PLoS Pathog. 2013;9:e1003398. - PMC - PubMed
    1. Sanyal A., Mailliard R.B., Rinaldo C.R., Ratner D., Ding M., Chen Y., Zerbato J.M., Giacobbi N.S., Venkatachari N.J., Patterson B.K. Novel assay reveals a large, inducible, replication-competent HIV-1 reservoir in resting CD4+ T cells. Nat. Med. 2017;23:885–889. - PMC - PubMed
    1. Wonderlich E.R., Subramanian K., Cox B., Wiegand A., Lackman-Smith C., Bale M.J., Stone M., Hoh R., Kearney M.F., Maldarelli F. Effector memory differentiation increases detection of replication-competent HIV-l in resting CD4+ T cells from virally suppressed individuals. PLoS Pathog. 2019;15:e1008074. - PMC - PubMed
    1. Ho Y.C., Shan L., Hosmane N.N., Wang J., Laskey S.B., Rosenbloom D.I., Lai J., Blankson J.N., Siliciano J.D., Siliciano R.F. Replication-competent noninduced proviruses in the latent reservoir increase barrier to HIV-1 cure. Cell. 2013;155:540–551. - PMC - PubMed
    1. Cohn L.B., Silva I.T., Oliveira T.Y., Rosales R.A., Parrish E.H., Learn G.H., Hahn B.H., Czartoski J.L., McElrath M.J., Lehmann C. HIV-1 integration landscape during latent and active infection. Cell. 2015;160:420–432. - PMC - PubMed

Publication types