

Effect of longevity genetic variants on the molecular aging rate
- PMID: 33948810
- PMCID: PMC8190315
- DOI: 10.1007/s11357-021-00376-4
Effect of longevity genetic variants on the molecular aging rate
Erratum in
-
Correction to: Effect of longevity genetic variants on the molecular aging rate.Geroscience. 2021 Aug;43(4):2101. doi: 10.1007/s11357-021-00400-7. Geroscience. 2021. PMID: 34143375 Free PMC article. No abstract available.
Abstract
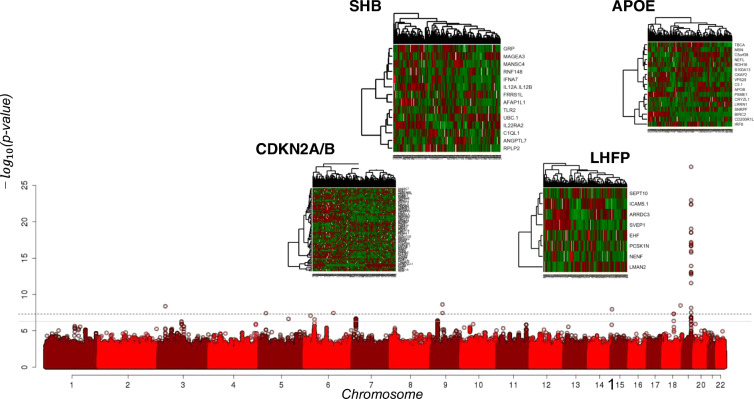
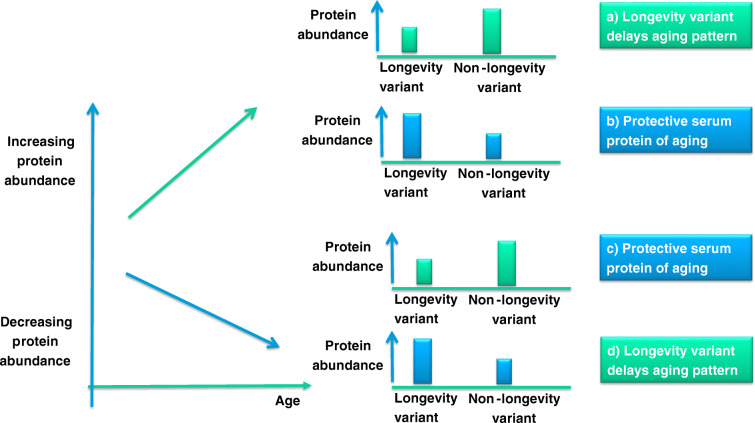
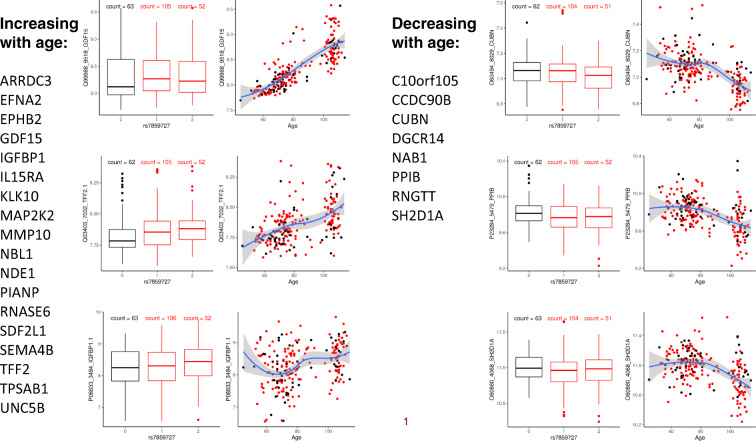
We conducted a genome-wide association study of 1320 centenarians from the New England Centenarian Study (median age = 104 years) and 2899 unrelated controls using >9 M genetic variants imputed to the HRC panel of ~65,000 haplotypes. The genetic variants with the most significant associations were correlated to 4131 proteins that were profiled in the serum of a subset of 224 study participants using a SOMAscan array. The genetic associations were replicated in a genome-wide association study of 480 centenarians and ~800 controls of Ashkenazi Jewish descent. The proteomic associations were replicated in a proteomic scan of approximately 1000 Ashkenazi Jewish participants from a third cohort. The analysis replicated a protein signature associated with APOE genotypes and confirmed strong overexpression of BIRC2 (p < 5E-16) and under-expression of APOB in carriers of the APOE2 allele (p < 0.05). The analysis also discovered and replicated associations between longevity variants and slower changes of protein biomarkers of aging, including a novel protein signature of rs2184061 (CDKN2A/CDKN2B in chromosome 9) that suggests a genetic regulation of GDF15. The analyses showed that longevity variants correlate with proteome signatures that could be manipulated to discover healthy-aging targets.
Keywords: Extreme human longevity; Genetic variants; Molecular aging rate; SOMAscan array.
Conflict of interest statement
L.L.J. is an employee and stock-holder of Novartis. D.J.G is an employee and stock-holder of Regeneron Pharmaceuticals.
Figures
References
Publication types
MeSH terms
Grants and funding
- R24 GM134210/GM/NIGMS NIH HHS/United States
- U19 AG056278/AG/NIA NIH HHS/United States
- U19-AG023122/AG/NIA NIH HHS/United States
- T32 AG023475/AG/NIA NIH HHS/United States
- R01 AG061155/AG/NIA NIH HHS/United States
- S10 OD021728/OD/NIH HHS/United States
- R01 AG061844/AG/NIA NIH HHS/United States
- UH2AG064704/AG/NIA NIH HHS/United States
- F31 DE029701/DE/NIDCR NIH HHS/United States
- UH2 AG064704/AG/NIA NIH HHS/United States
- U19 AG023122/AG/NIA NIH HHS/United States
- R01 AG046949/AG/NIA NIH HHS/United States
- P30AG038072/AG/NIA NIH HHS/United States
- R01 AG044829/AG/NIA NIH HHS/United States
- R01 AG057909/AG/NIA NIH HHS/United States
- P30 AG038072/AG/NIA NIH HHS/United States
- UH3 AG064704/AG/NIA NIH HHS/United States
LinkOut - more resources
Full Text Sources
Miscellaneous
