. 2021 Sep;63(6):e22126.
doi: 10.1002/dev.22126. Epub 2021 May 4.

Using gastrointestinal distress reports to predict youth anxiety risk: Implications for mental health literacy and community care

Affiliations

Using gastrointestinal distress reports to predict youth anxiety risk: Implications for mental health literacy and community care

Paul Alexander Bloom et al. Dev Psychobiol. 2021 Sep.

Abstract

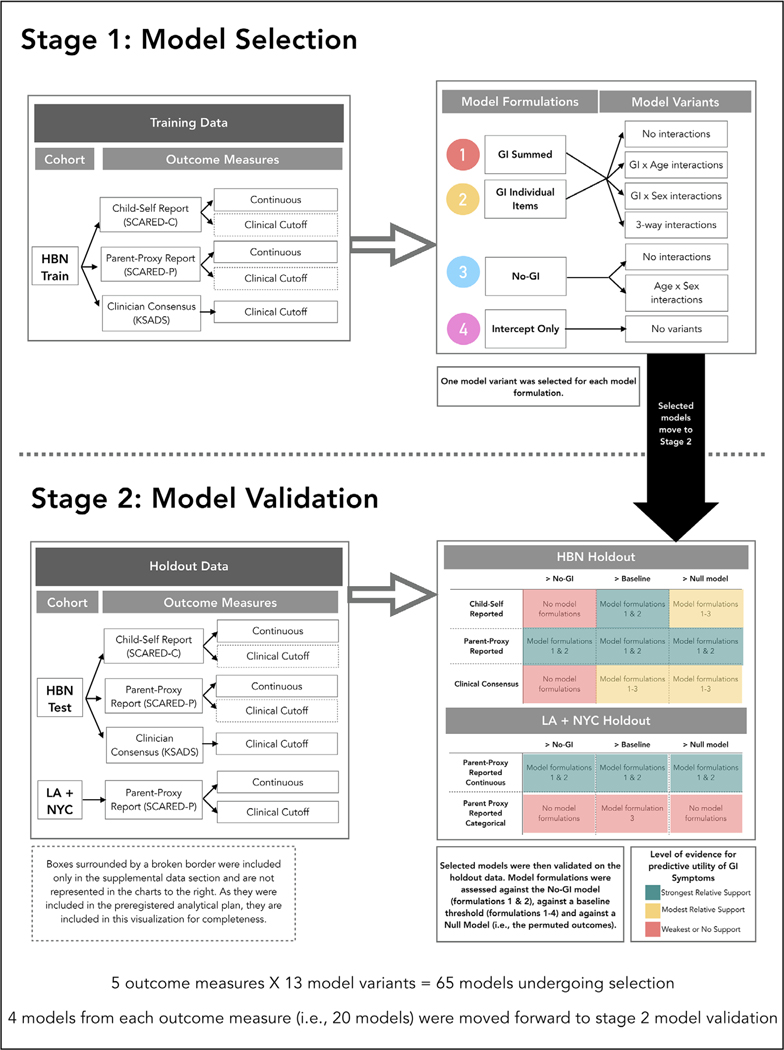
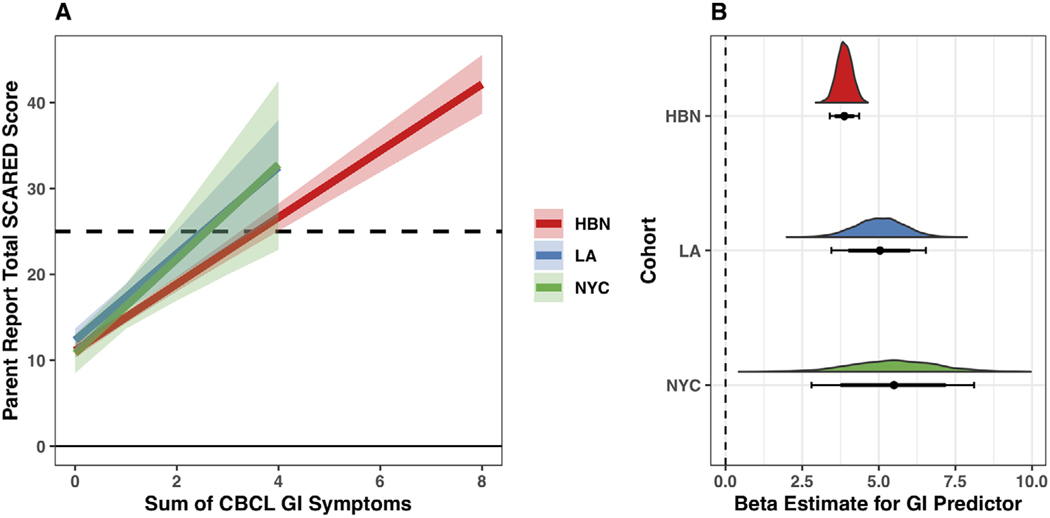
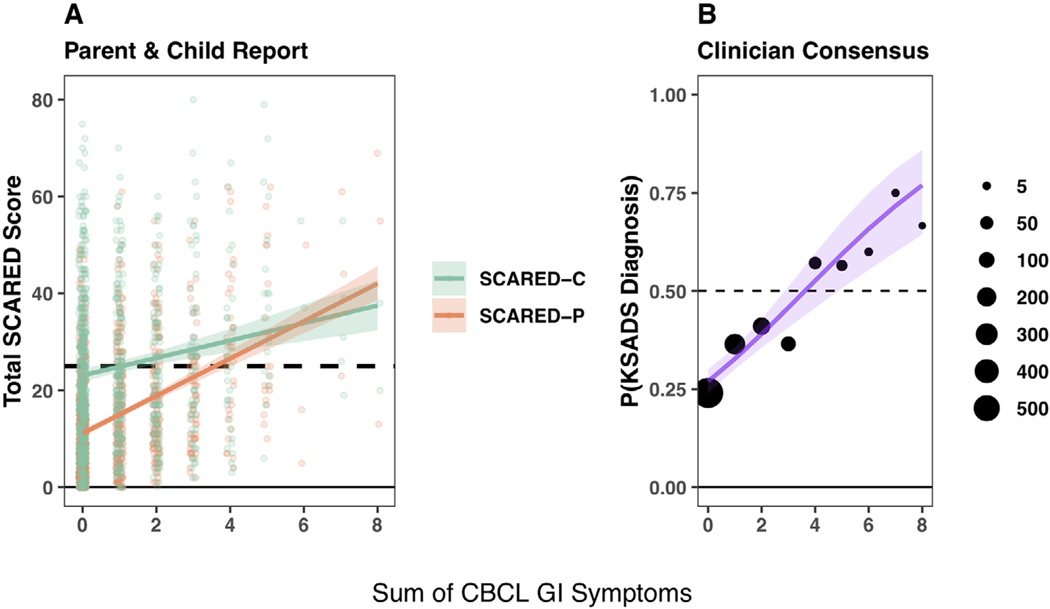
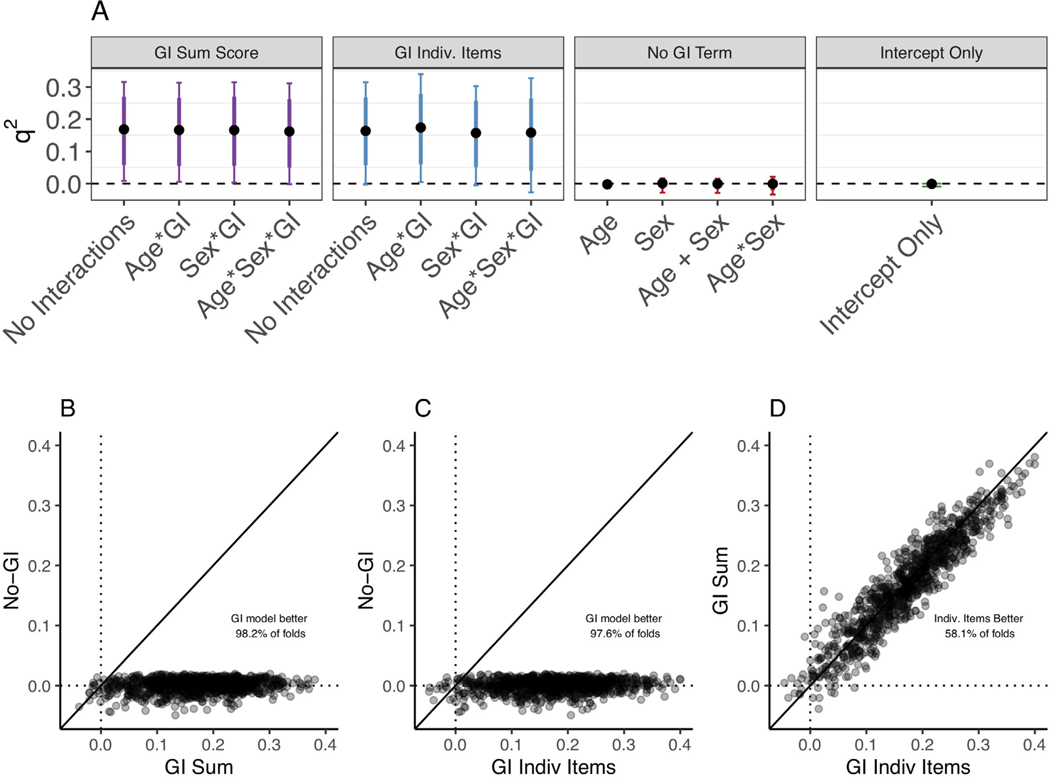
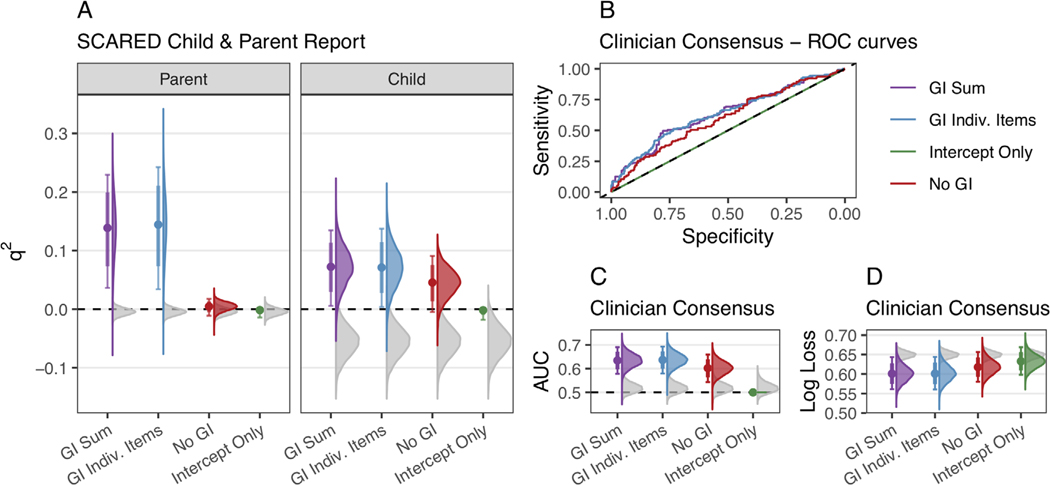
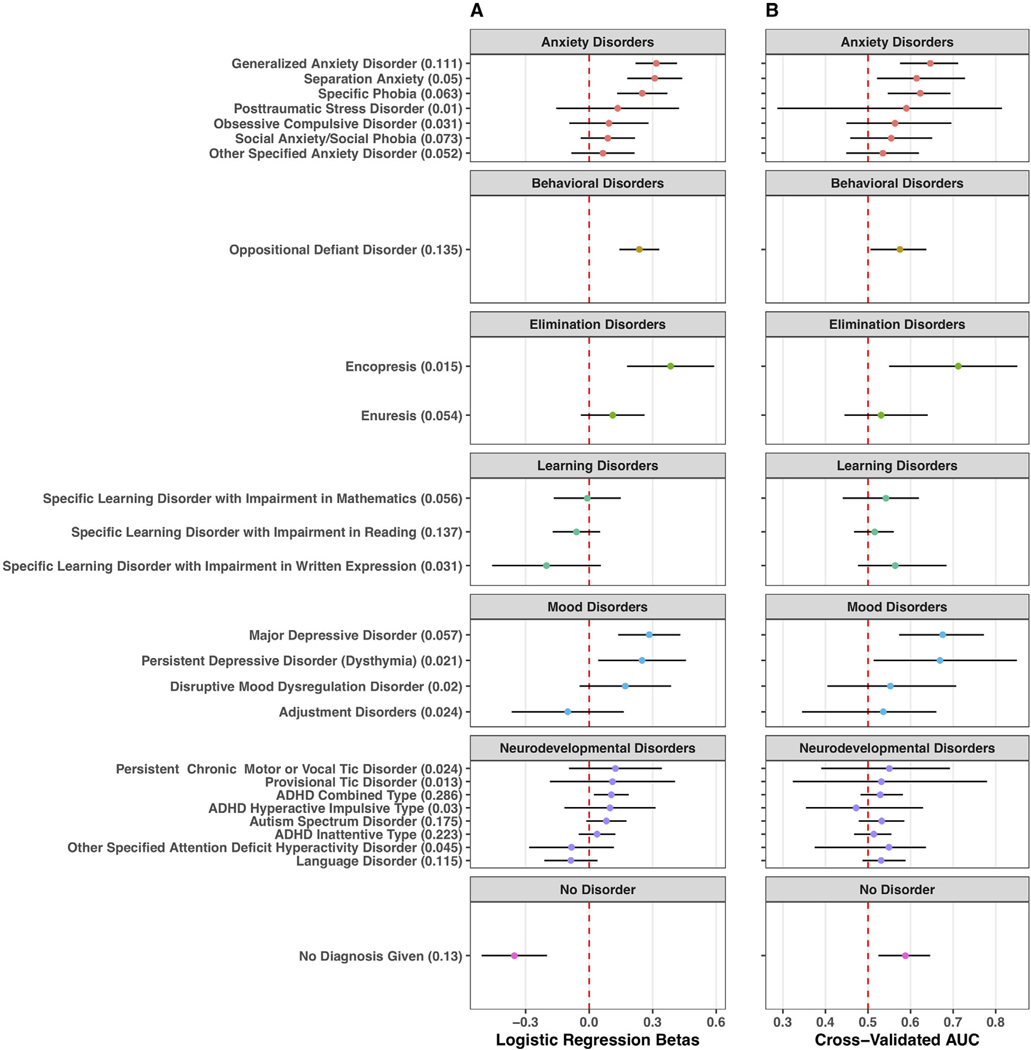
This study investigates the generalizability and predictive validity of associations between gastrointestinal (GI) symptoms and youth anxiety to establish their utility in community mental health decision-making. We analyzed data from youth ages 3 to 21 years in volunteer cohorts collected in Los Angeles (N = 327) and New York City (N = 102), as well as the Healthy Brain Network cohort (N = 1957). Youth GI distress was measured through items taken from the parent-reported Child Behavior Checklist (CBCL). We examined generalizability of GI-anxiety associations across cohorts and anxiety reporters, then evaluated the performance of these models in predicting youth anxiety in holdout data. Consistent with previous work, higher levels of gastrointestinal distress were associated with more parent-reported youth anxiety behaviors in all three cohorts. Models trained on data from the Healthy Brain Network cohort predicted parent-reported and child-reported anxiety behaviors, as well as clinician-evaluated anxiety diagnoses, at above chance levels in holdout data. Models which included GI symptoms often, but not always, outperformed models based on age and sex alone in predicting youth anxiety. Based on the generalizability and predictive validity of GI-anxiety associations investigated here, GI symptoms may be an effective tool for child-facing professionals for identifying children at risk for anxiety (Preprint: https://psyarxiv.com/zgavu/).

Keywords: anxiety; gastrointestinal; prediction; replication; youth.


Conflict of interest statement

CONFLICT OF INTEREST

The authors declare no conflict of interest.

Figures

FIGURE 1
FIGURE 1
Flowchart summarizing our procedures and results for measuring the predictive validity of models predicting anxiety from gastrointestinal (GI) symptoms. Step 1: Model selection includes the models that were built on the HBN training dataset. There were four different model formulations built on the outcome measures: (1) GI summed (including age and sex), (2) GI individual items (including age and sex), (3) no GI (just age and sex), (4) intercept only. Within those model formulations, several model variants were tested which included models with no interactions between predictors, as well as models that interacted with GI symptoms, age, sex, or included three-way interactions with GI symptoms age and sex. One model variant was selected for each model formulation and carried through to Step 2. Step 2: Model validation occurred on the holdout data (Healthy Brain Network (HBN) test dataset, as well as the combined Los Angeles (LA) + New York City (NYC) cohorts). The LA and NYC cohorts were combined into a single holdout dataset due to highly similar demographics and to increase the sample size. Some of the models (i.e., those built on the clinical cutoff scores from SCARED-C and SCARED-P within the HBN training data—see boxes surrounded by broken lines) were tested within the HBN holdout data but were not discussed in the main manuscript and are not represented in the colored boxes to the bottom right of the graph. Colored boxes in the bottom right of the figure represent the relative level of evidence for the predictive validity of each model for each of the validation tests (>No-GI: better than a model with no-GI symptoms included; >Baseline: better than baseline threshold formulation, e.g., AUC = 0.5; >Null model: better than chance performance based on a permuted null distribution). The level of evidence represented is relative, rather than absolute, meaning that relative to the other models, those highlighted in green provide the strongest evidence for predictive performance of GI models
FIGURE 2
FIGURE 2
Replication of linear associations between gastrointestinal (GI) symptoms and anxiety across the New York City (NYC) (green) and Los Angeles (LA) (blue) cohorts, and Healthy Brain Network (HBN) training data (red). (a) Fitted model predictions (solid lines) plus 95% uncertainty intervals (semi-transparent overlays) for linear regressions fit to each of the three cohorts. Dotted line represents a score of 25, which is the clinical threshold for this measure. Predictions for the NYC and LA cohorts are cut off above a GI sum score of 4 because no participants in these datasets scored over 4 for GI symptoms. Model predictions are displayed for an average participant of age 10.5 years. (b) Posterior distributions for the GI sum score predictor in the linear regression models fit to each cohort (colored distributions). Underneath the colored distributions are the 80% (thick line) and 95% (thin line) uncertainty intervals. The posterior estimates for the GI predictor represent the predicted increase in Screen for Child Anxiety Related Disorders–Parent (SCARED-P) scores associated with a 1 unit increase in GI symptoms for an average participant of age 10.5 years. The dotted line at 0 indicates no estimated average change in SCARED-P scores as a function of GI symptoms
FIGURE 3
FIGURE 3
Robustness of associations between parent reports of child gastrointestinal (GI) symptoms and both child-reported and clinician-evaluated anxiety in the Healthy Brain Network (HBN) training set. All panels show model fitted predictions (solid lines) for an average participant of age 10.5 years with a 95% uncertainty interval (semi-transparent overlay). (a) Linear regression with parent-reported anxiety behaviors on Screen for Child Anxiety Related Disorders–Parent (SCARED-P) (orange) and child-reported anxiety behaviors on SCARED-C (green) as the outcomes. Points show individual participant scores on each measure. (b) Logistic regression with clinician-consensus anxiety diagnosis based on the Kiddie Schedule for Affective Disorders and Schizophrenia (KSADS) as the outcome. Points indicate proportions of participants at each possible GI score with diagnoses, and point size indicates the number of participants in a given bin
FIGURE 4
FIGURE 4
Cross-validation of linear regression models predicting Screen for Child Anxiety Related Disorders–Parent (SCARED-P) from gastrointestinal (GI) symptoms within the Healthy Brain Network (HBN) training data. (a) For each model formulation (GI summed, GI individual items, No-GI Term, and Intercept Only, represented by the different boxes) the median q2, 80% uncertainty interval (thick line), and 95% uncertainty interval (thin line) from all cross-validated folds are plotted for each model variant. (b–d) q2, calculated for the model variants selected in Step 1 across all folds (each data point represents a fold). Data points that fall above the line indicate a higher q2, for the model represented on the y-axis, whereas those that fall below the solid line indicate higher q2, from the model represented on the x-axis. Both the GI summed model (b) and the GI individual items model (c) outperformed the No-GI model, and there were no consistent differences in performance between the two types of GI models (individual items and summed; d)
FIGURE 5
FIGURE 5
Bootstrapped model predictive performance and null permuted distributions on Healthy Brain Network (HBN) holdout data for parent-report Screen for Child Anxiety Related Disorders–Parent (SCARED-P, panel a), child-report (SCARED-C, panel a), and clinician consensus Kiddie Schedule for Affective Disorders and Schizophrenia (KSADS) anxiety diagnoses (panels b–d). Bootstrapped distributions of model performance are shown in color (purple = GI summed (model formulation 1), blue = GI individual items (model formulation 2), red = No-GI (model formulation 3), green = Intercept only (model formulation 4)), and bootstrapped medians (colored points) are compared to the distribution of the best-performing null model (gray). (a) Bootstrapped distributions of q2, metrics from resampling of the HBN holdout data for both parent-reported (SCARED-P) and child-reported (SCARED-C) anxiety symptoms. For the parent-reported anxiety, only GI models (GI summed and GI individual items) performed better than the null. For the child-reports, all models except for the intercept-only model tended to perform better than the null, with generally positive q2, scores. (b) Receiver-operating characteristic curves for all model formulations for the full HBN holdout dataset. The x-axis represents specificity (proportion of those true diagnoses correctly predicted), and the y-axis represents sensitivity (proportion of true diagnoses correctly predicted). The diagonal black line represents chance. (c and d) Bootstrapped distributions of area under the curve (AUC) (panel C) and log loss metrics (panel d) from resampling of the HBN holdout data for clinician-consensus diagnoses on the KSADS. GI summed, GI individual items, and No-GI models
FIGURE 6
FIGURE 6
Exploring gastrointestinal (GI) model performance for predicting a range of mental illness diagnoses (left y-axis). Numbers in parenthesis next to the name of each diagnosis (left y-axis) indicate the proportion of participants in the full Healthy Brain Network (HBN) cohort with that diagnosis. Each outcome is grouped into a diagnostic category (box), with the grey title indicating the diagnostic category (e.g., “behavioral disorders”). The beta estimate is indicated with a colored point and the lines around the point indicate the 95% uncertainty interval. (a) Estimated logistic regression betas for a summed GI symptom term (including age and sex covariate) in models fit to the entire HBN cohort, associated with likelihood of each respective outcome. Estimates are in log-odds. (b) Cross-validated area under the curve (AUC) estimates for each respective disorder from iterative rounds of cross-validation leaving out 25% of the HBN dataset. While the models in (a) included covariates for age and sex, cross-validated models only had a GI predictor, but no terms for age or sex to avoid inflated model performance based on age-related differences in specific psychopathologies. Points represent median AUC, and lines represent 95% uncertainty intervals across rounds of cross-validation

References

    1. Achenbach TM (1991). Integrative guide for the 1991 CBCL/4–18, Ysr, and Trf profiles (1st US-1st Printing ed.). Department of Psychiatry, University of Vermont.
    1. Achenbach TM, & Edelbrock CS (1983). Manual for the child behavior checklist and revised child behavior profile. Department of Psychiatry, University of Vermont.
    1. Alegria M, Shrout PE, Canino G, Alvarez K, Wang Y, Bird H, Markle SL, Ramos-Olazagasti M, Rivera DV, Cook BL, Musa GJ, Falgas-Bague I, NeMoyer A, Dominique G, & Duarte C. (2019). The effect of minority status and social context on the development of depression and anxiety: A longitudinal study of Puerto Rican descent youth. World Psychiatry, 18(3), 298–307. 10.1002/wps.20671 - DOI - PMC - PubMed
    1. Alexander LM, Escalera J, Ai L, Andreotti C, Febre K, Mangone A, Vega-Potler N, Langer N, Alexander A, Kovacs M, Litke S, O’Hagan B, Andersen J, Bronstein B, Bui A, Bushey M, Butler H, Castagna V, Camacho N, ..., Milham MP (2017). An open resource for transdiagnostic research in pediatric mental health and learning disorders. Scientific Data, 4, 170181. 10.1038/sdata.2017.181 - DOI - PMC - PubMed
    1. Ambekar A, Ward C, Mohammed J, Male S, & Skiena S. (2009). Name-ethnicity classification from open sources. Proceedings of the 15th ACM SIGKDD International Conference on Knowledge Discovery and Data Mining, USA, 49–58. 10.1145/1557019.1557032 - DOI

Publication types

LinkOut - more resources