. 2021 Jul;129(7):438-451.
doi: 10.1111/apm.13140. Epub 2021 Jun 6.

Electronic reporting of diagnostic laboratory test results from all healthcare sectors is a cornerstone of national preparedness and control of COVID-19 in Denmark

Affiliations

Electronic reporting of diagnostic laboratory test results from all healthcare sectors is a cornerstone of national preparedness and control of COVID-19 in Denmark

Kristian Schønning et al. APMIS. 2021 Jul.

Abstract

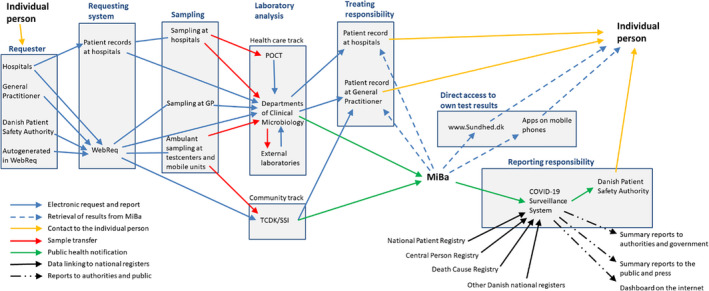
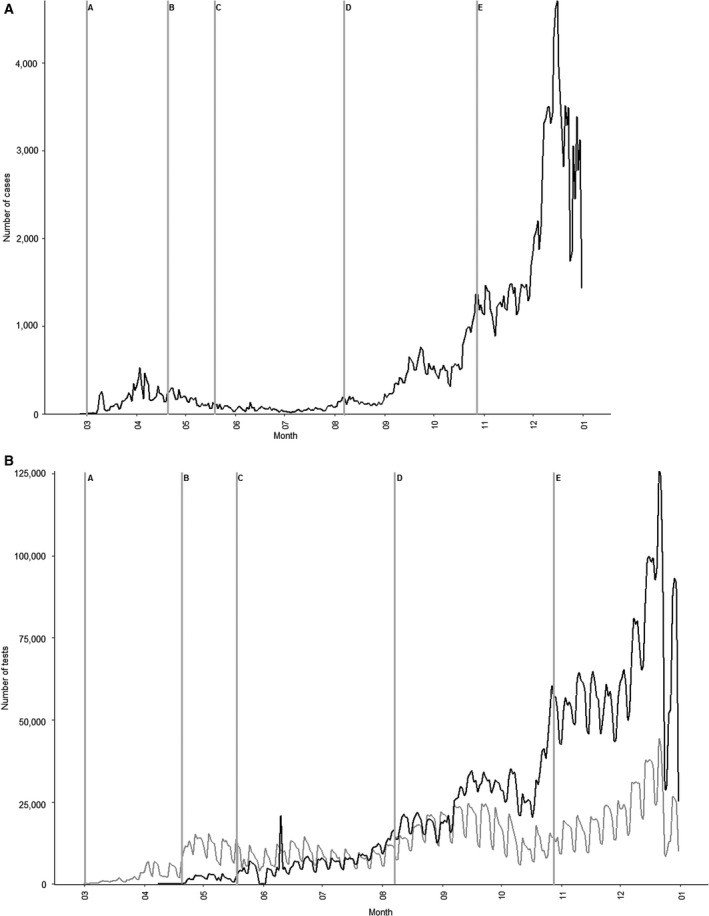
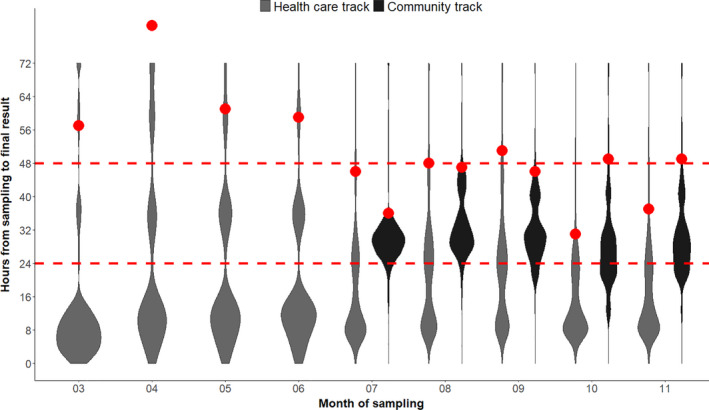
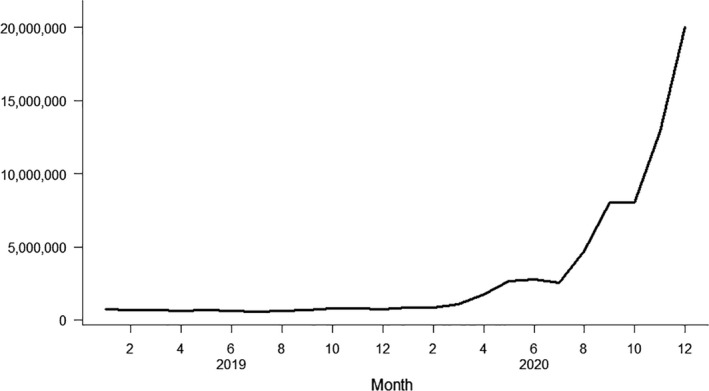
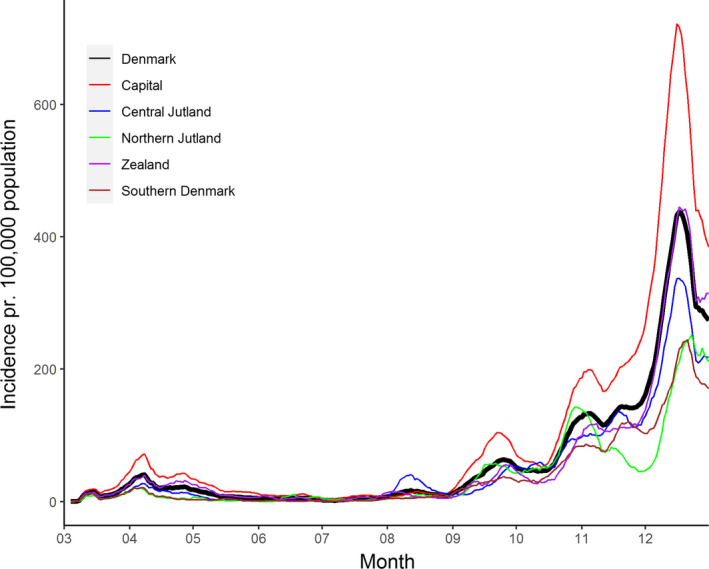
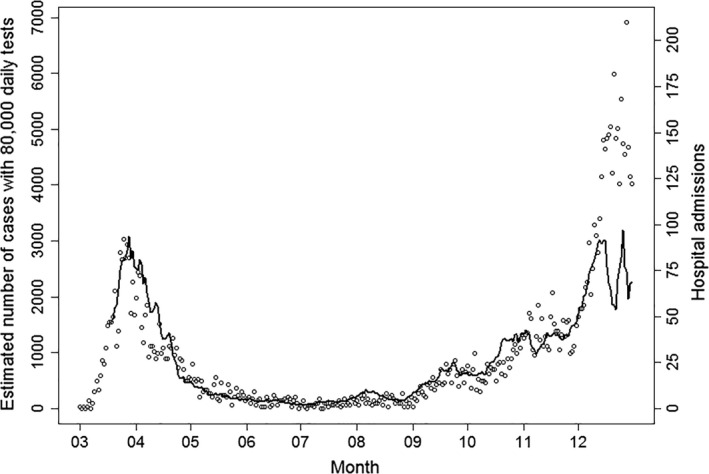
The COVID-19 pandemic has led to an unprecedented demand for real-time surveillance data in order to inform critical decision makers regarding the management of the pandemic. The aim of this review was to describe how the Danish national microbiology database, MiBa, served as a cornerstone for providing data to the real-time surveillance system by linkage to other nationwide health registries. The surveillance system was established on an existing IT health infrastructure and a close network between clinical microbiologists, information technology experts, and public health officials. In 2020, testing capacity for SARS-CoV-2 was ramped up from none to over 10,000 weekly PCR tests per 100,000 population. The crude incidence data mirrored this increase in testing. Real-time access to denominator data and patient registries enabled adjustments for fluctuations testing activity, providing robust data on crude SARS-CoV-2 incidence during the changing diagnostic and management strategies. The use of the same data for different purposes, for example, final laboratory reports, information to the public, contact tracing, public health, and science, has been a critical asset for the pandemic response. It has also raised issues concerning data protection and critical capacity of the underlying technical systems and key resources. However, even with these limitations, the setup has enabled decision makers to adopt timely interventions. The experiences from COVID-19 may motivate a transformation from traditional indicator-based public health surveillance to an all-encompassing information system based on access to a comprehensive set of data sources, including diagnostic and reference microbiology.

Keywords: COVID-19; electronic reporting; microbiological test results; national surveillance.


Figures

Fig. 1
Fig. 1
Dataflow from test request to reporting of the final result to the requesting doctor, to the tested person and to MiBa for the national surveillance and display of statistics as well as for reporting of positive cases to the Danish Patient Safety Authority. POCT, Point Of Care Testing; SSI, Statens Serum Institut; TCDK, Test Center Denmark; WebReq, Web‐based electronic request system [20]. Up load mechanisms for private vendors and school screening is not included in this outline of the system, for clarity reasons.
Fig. 2
Fig. 2
Case numbers and test activity in the Health care track and the Community track from March to December 2020. (A) Total number of COVID‐19 cases per day and (B) test activity in the Health care track and the Community track per day. Letters indicate changes in test strategy: A: Only test of hospitalized patients with symptoms or relevant exposure, B: Test of all hospitalized patients and patients with relevant symptoms, C: Access to test for all persons, D: Local outbreak in Aarhus with excessive testing, E: Systematic testing of staff in selected sectors.
Fig. 3
Fig. 3
Distributions of turnaround times in hours. For the Health care track, turnaround times are shown for 1,936,468 samples analyzed at the regional clinical microbiology laboratories from March to November 2020. For the Community track, turnaround times are shown for 2,907,660 samples analyzed at TestCenter Denmark from July to November. The red points are the 95% quantiles. The plot is a so‐called violinplot showing the density distribution of the turnaround times (the areas are normalized to the same size). Samples with turnaround times below 4 h are due to point of care testing.
Fig. 4
Fig. 4
Number of all enquiries to MiBa per month, including enquiries for non‐COVID‐19‐related reports in the period from January 2019 to December 2020. During the year 2015, the monthly number of enquiries increased from on average x to y. Each time a person’s test results is accessed in MiBa, it is counted as one enquiry, regardless of the number of reports accessed.
Fig. 5
Fig. 5
Rolling 7‐day incidences of COVID‐19 cases at national and regional levels from March to December 2020. The curves show the data from the whole country, Capital Region of Denmark; Central Jytland: Central Denmark Region; Northern Jutland: North Denmark Region; Zealand: Region Zealand; Southern Denmark: Region of Sothern Denmark.
Fig. 6
Fig. 6
Estimated number of new cases using a correction factor for test activity (solíd black line), which empirically corrects for time‐varying testing behavior, test capacity, and targeted testing efforts. For ease of interpretation, the calculation is made relative to a fixed reference number of 80.000 daily tests. Points show the daily number of hospital admissions of cases with COVID‐19 for comparison. The estimated number of new cases follows hospital admission closely up to the middle of December, but the model fit was impacted by the substantial variation in testing activity in the last half of December due to seasonal changes in testing behavior around Christmas and the New Year.
Fig. 7
Fig. 7
Effective reproduction number (Rt) corrected for variations in test activity at the national level (A) and the Central Denmark Region (B). The Rt calculations are based on the model also described in Fig. 6. For further details about these calculations (https://www.ssi.dk/‐/media/ssi‐files/ekspertrapport‐af‐den‐23‐oktober‐2020‐incidens‐og‐fremskrivning‐af‐covid19‐tilflde.pdf?la=da). In short, the model is a consideration of the complex testing behavior and uses a 7 day smoothing. The letters designate: A: Early limited reopening on April 15, B: Late reopening on May 19, C: Border reopening June 18, D: School summer holiday starts June 28, E: School summer holiday ends August 10, F: Mandatory use of masks in public transport August 15, G: Universities open September 1, H: Work from home recommendations September18, I: Mandatory use of masks in public areas (in doors) October 28, J: Second lockdown.

References

    1. Thacker SB, Qualters JR, Lee LM. Public health surveillance in the United States: evolution and challenges. MMWR Suppl 2012;61:3–9. - PubMed
    1. Leitmeyer KC, Espinosa L, Broberg EK, Struelens MJ. Automated digital reporting of clinical laboratory information to national public health surveillance systems, results of a EU/EEA survey, 2018. Eurosurveillance 2020;25. - PMC - PubMed
    1. Voldstedlund M, Haarh M, Mølbak K. The Danish Microbiology Database (MiBa) 2010 to 2013. Euro Surveill 2014;19. - PubMed
    1. Coronaprover.dk. Available from: https://www.coronaprover.dk [25‐01‐2021].
    1. SSI . Daglige covid‐19‐tal på kommunalt, regional samt nationalt niveau. Available from: https://covid19.ssi.dk/overvagningsdata/daglige‐covid‐19‐tal