

Protein Kinase D2 drives chylomicron-mediated lipid transport in the intestine and promotes obesity
- PMID: 33949105
- PMCID: PMC8103097
- DOI: 10.15252/emmm.202013548
Protein Kinase D2 drives chylomicron-mediated lipid transport in the intestine and promotes obesity
Abstract
Lipids are the most energy-dense components of the diet, and their overconsumption promotes obesity and diabetes. Dietary fat content has been linked to the lipid processing activity by the intestine and its overall capacity to absorb triglycerides (TG). However, the signaling cascades driving intestinal lipid absorption in response to elevated dietary fat are largely unknown. Here, we describe an unexpected role of the protein kinase D2 (PKD2) in lipid homeostasis. We demonstrate that PKD2 activity promotes chylomicron-mediated TG transfer in enterocytes. PKD2 increases chylomicron size to enhance the TG secretion on the basolateral side of the mouse and human enterocytes, which is associated with decreased abundance of APOA4. PKD2 activation in intestine also correlates positively with circulating TG in obese human patients. Importantly, deletion, inactivation, or inhibition of PKD2 ameliorates high-fat diet-induced obesity and diabetes and improves gut microbiota profile in mice. Taken together, our findings suggest that PKD2 represents a key signaling node promoting dietary fat absorption and may serve as an attractive target for the treatment of obesity.
Keywords: chylomicron; fat absorption; intestine; obesity; protein kinase D2/PKD2/PRKD2.
© 2021 The Authors. Published under the terms of the CC BY 4.0 license.
Conflict of interest statement
The authors declare that they have no conflict of interest.
Figures
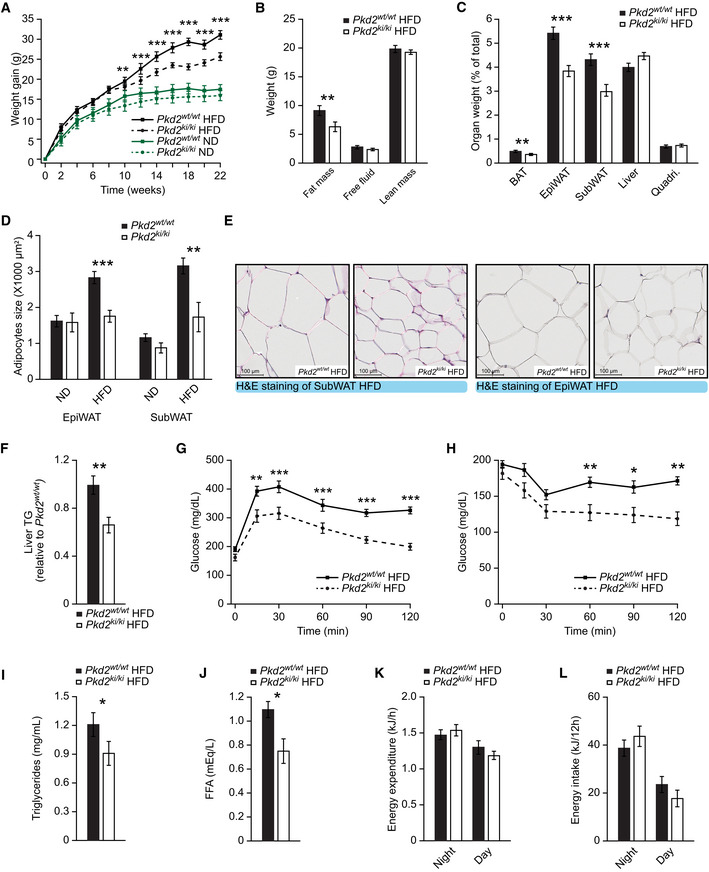
- A
Body weight gain of male mice with the specified genotypes under normal (ND) or high‐fat diet (HFD).
- B
Quantification of fat, free fluid, and lean mass by nuclear magnetic resonance (NMR) of mice in HFD in panel (A).
- C
Organ weight (percentage of total weight) of different fat depots, liver, and quadriceps of Pkd2wt / wt and Pkd2ki / ki male mice after 22 weeks in HFD.
- D
Quantification of the average adipocyte size in SubWAT and EpiWAT of male mice of the specified genotypes in normal and high‐fat diet.
- E
Representative pictures of H&E staining of SubWAT and EpiWAT of indicated male mice fed HFD.
- F
Triglyceride content in liver of Pkd2wt / wt and Pkd2ki / ki male mice in panel (A). Relative to Pkd2wt / wt.
- G
Glucose tolerance test of the specified genotypes after 16 weeks in HFD.
- H
Insulin tolerance test of Pkd2wt / wt and Pkd2ki / ki male mice after 18 weeks in HFD.
- I, J
Triglycerides (I) and free fatty acids (J) in circulation of specified mice after 18 weeks in HFD.
- K, L
Energy expenditure (K) and energy intake (L) of mice after 20 weeks in HFD.
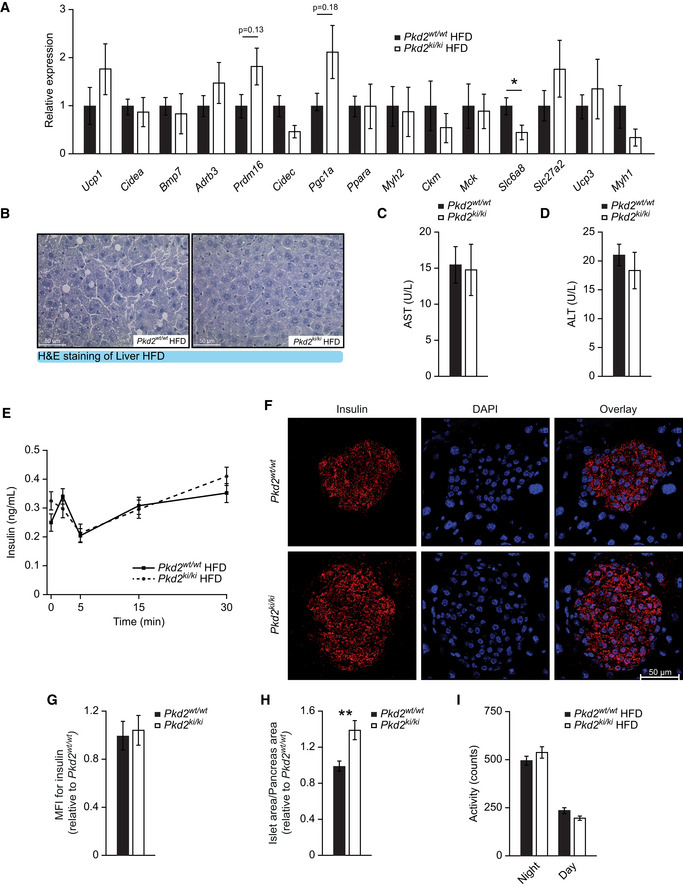
- A
Relative expression of specified genes in SubWAT of Pkd2wt / wt and Pkd2ki / ki male mice after 22 weeks in HFD. n = 6.
- B
Representative pictures of H&E staining of liver of indicated male mice in panel (A).
- C, D
Aspartate aminotransferase (C) and alanine aminotransferase (D) levels in serum of male mice in panel (A). n = 5.
- E
Glucose‐stimulated insulin secretion of Pkd2wt / wt and Pkd2ki / ki male mice after 8 weeks in HFD. n = 8.
- F
Representative pictures of immunofluorescent staining for insulin (red) and DAPI (blue) of Pkd2wt / wt and Pkd2ki / ki male mice. n = 3. For each subject, three different sections of the pancreas were taken and a distance of 50 μm was kept between the sections.
- G
Mean fluorescence intensity (MFI) for insulin of mice in panel (F). Relative to Pkd2wt / wt. n = 3. MFI was quantified from all the islets found in each of the three sections per experimental subject.
- H
Islet area compared to pancreas area of mice in panel (F). Relative to Pkd2wt / wt. All the islets found in each of the three sections per mouse were quantified.
- I
Activity of Pkd2wt / wt and Pkd2ki / ki male mice after 20 weeks in HFD. Expressed as counts per 12 h of intervals. n = 7 for Pkd2wt / wt and n = 8 for Pkd2ki / ki.
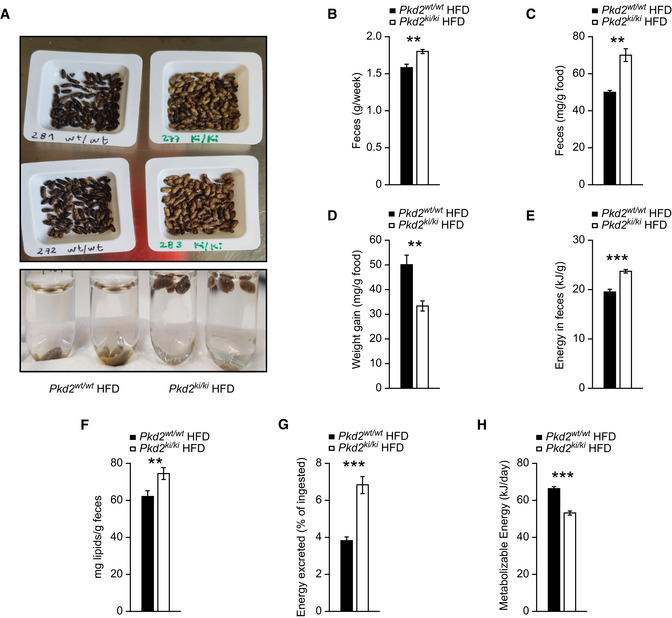
- A
Pictures of feces collected from male mice fed HFD and photo of them placed in water.
- B
Weight of feces collected in a week.
- C
Feces excreted per gram of food consumed.
- D
Body weight gained per gram of food consumed.
- E, F
Energy content (E) and lipid content (F) per gram of feces.
- G
Percentage of energy excreted in feces from the total energy ingested.
- H
Metabolizable energy calculated from intake minus excreted and assuming a urinary excretion of 2%.
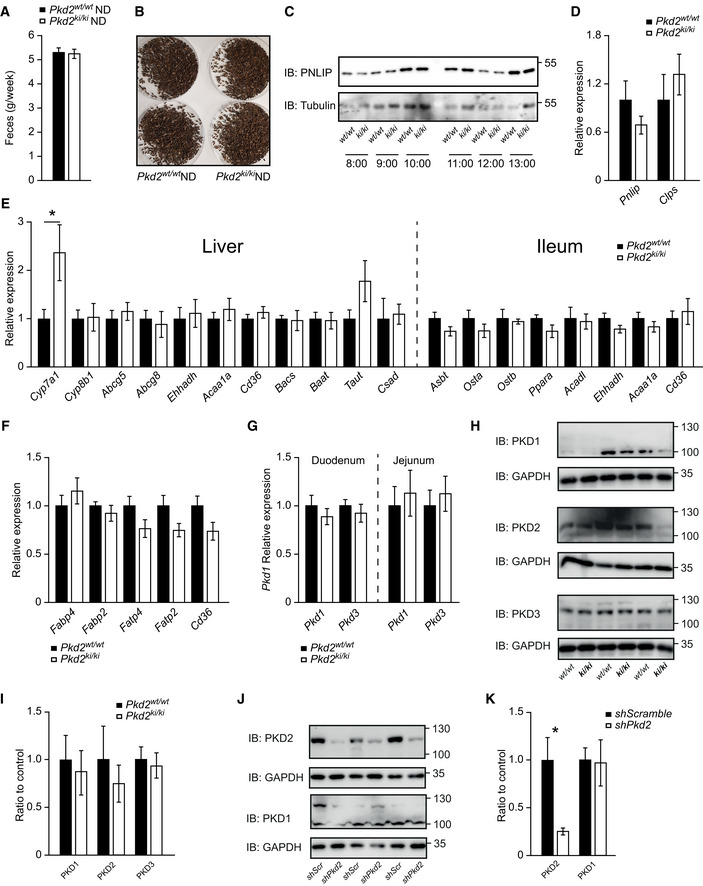
Weight of feces collected from Pkd2wt / wt and Pkd2ki / ki male mice fed normal diet per week. n = 6.
Pictures of feces from Pkd2wt / wt and Pkd2ki / ki male mice under normal diet. n = 6.
Western blot for pancreatic lipase in duodenum of Pkd2wt / wt and Pkd2ki / ki male mice 1 h after olive oil gavage. n = 6. The animals were dissected at the indicated time of the day.
Relative expression of specified genes in pancreas of Pkd2wt / wt and Pkd2ki / ki male mice. n = 6.
Relative expression of genes involved in bile acids production, metabolism, and transport in liver and ileum of male mice with indicated genotypes after 1 week of HFD. n = 6.
Relative expression of genes involved in fatty acid transport in jejunum of indicated male mice. n = 6.
Pkd1 and Pkd3 expression levels in duodenum and jejunum of male mice with indicated genotypes. n = 6.
Western blot analysis of protein kinase D1 (PKD1), protein kinase D2 (PKD2), and protein kinase D3 (PKD3) in small intestine of Pkd2wt / wt and Pkd2ki / ki male mice. n = 3.
Quantification of the Western blots from intestine samples in panel (H). n = 3.
Western blot analysis of protein kinase D2 (PKD2) and protein kinase D1 (PKD1) in Caco2 cells expressing shscramble or shPkd2. n = 3.
Quantification of the Western blots from Caco2 cells presented in panel (J). n = 3.
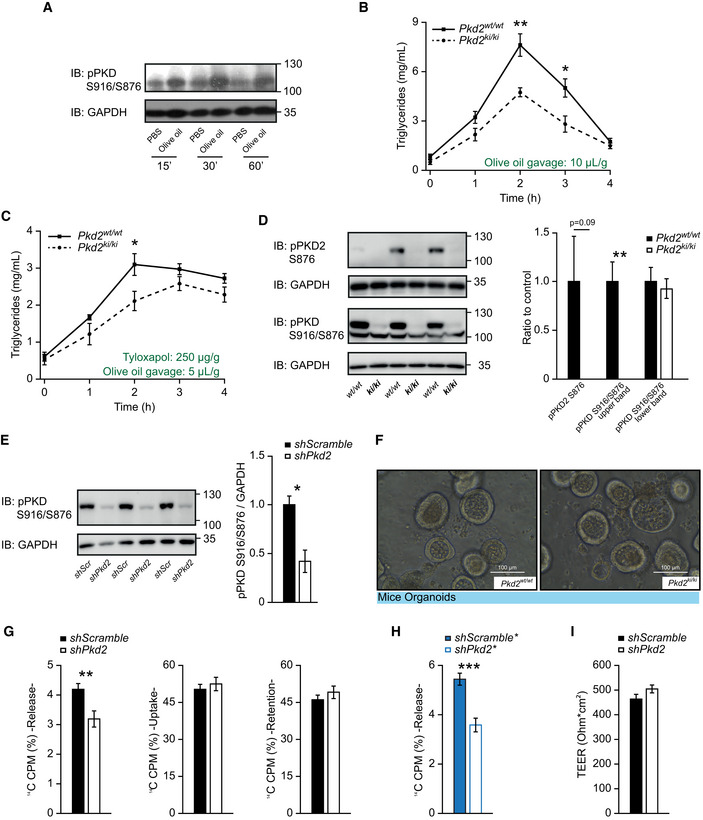
Western blot analysis of phosphorylated PKD (S916/S876) in small intestine of male C57BL/6 mice after overnight fasting, olive oil gavage (or PBS in controls), and dissection at different time‐points.
Lipid tolerance test after oral gavage of olive oil (10 µl per gram of body weight). n = 6.
Lipid tolerance test 30 min after tyloxapol i.p. injection (250 µg/g body weight). In this case, only 5 µl of olive oil per gram of body weight was gavaged orally. n = 6.
Western blot analysis and quantification of phosphorylated PKD2 (S876) and phosphorylated PKD (S916/S876) in small intestine of Pkd2wt / wt and Pkd2ki / ki male mice. n = 3.
Western blot analysis and quantification of phosphorylated PKD (S916/S876) in Caco2 cells expressing shscramble or shPkd2. n = 3.
Representative light microscopy pictures of organoids derived from jejunum crypts of indicated male mice.
Percentage of released, uptaken and retained 14C‐labeled fatty acids from Caco2 cells shscramble or shPkd2 (sequence 1) in a Transwell system. n = 6.
Percentage of released 14C‐labeled fatty acids by Caco2 cells expressing shscramble* or shPkd2* (sequence 2) grown in a Transwell system. n = 6.
Transepithelial electric resistance of the Caco2 cells shscramble or shPkd2 (sequence 1). n = 6.
- A
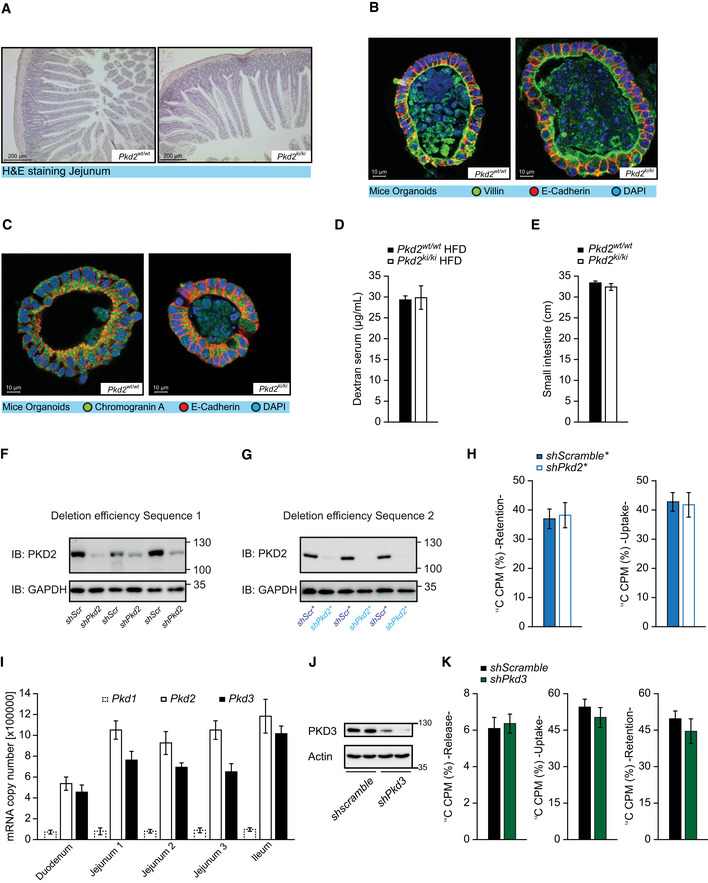
Representative pictures of H&E staining of jejunum of Pkd2wt / wt and Pkd2ki / ki male mice.
- B, C
Confocal microscopy images of mice‐derived organoids stained for E‐cadherin, DAPI and villin (B), or chromogranin A (C).
- D
Dextran concentration in serum after oral gavage of indicated male mice. n = 4
- E
Length of small intestine of indicated male mice. n = 7 for Pkd2wt / wt and n = 8 for Pkd2ki / ki.
- F
Western blot of PKD2 in Caco2 cell control (shScramble) and depleted from PKD2 by shRNA (sequence 1). n = 3.
- G
Western blot of PKD2 in Caco2 cells expressing shscramble or shPkd2 (sequence 2). Labeled as shscramble* or shPkd2*. n = 3.
- H
Percentage of retention and uptake of 14C‐labeled fatty acids in Caco2 cells expressing shscramble* or shPkd2* (sequence 2) grown in a Transwell system for 14 days. n = 6.
- I
Absolute mRNA quantification of Pkd1, Pkd2, and Pkd3 in different parts of intestine of C57BL/6 mice. n = 4
- J
Western blot of PKD3 in Caco2 cell control (shScramble) and depleted from PKD3 by shRNA. n = 2.
- K
Percentage of release, uptake, and retention of 14C‐labeled fatty acids in Caco2 cells expressing shscramble or shPkd3 grown in a Transwell system for 14 days. n = 5.
- A
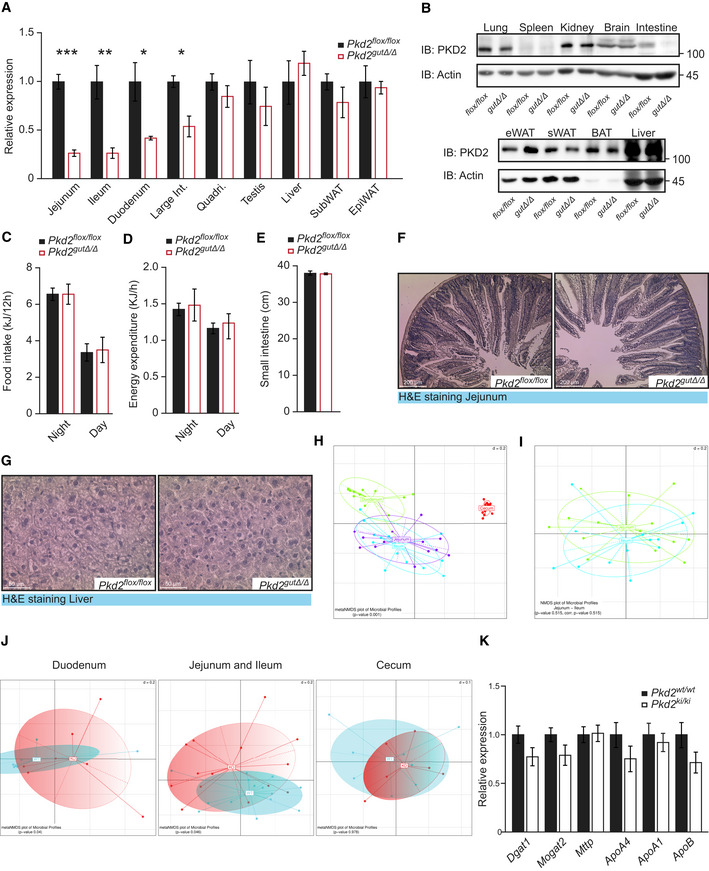
Relative expression of Pkd2 in specified organs of Pkd2flox / flox and Pkd2gutΔ / Δ male mice. n = 4.
- B
Western blot of PKD2 in specified organs of Pkd2flox / flox and Pkd2gutΔ / Δ mice.
- C, D
Food intake (C) and energy expenditure (D) of Pkd2flox / flox and Pkd2gutΔ / Δ male mice after 13 weeks in HFD. n = 4.
- E
Length of small intestine of indicated male mice. n = 4.
- F, G
Representative H&E pictures of jejunum (F) and liver (G) of male mice with indicated genotypes after 17 weeks in HFD.
- H
MetaNMDs plots of bacterial composition show specific differences in small intestinal section. n = 7.
- I
Pairwise PERMANOVA indicates no significant differences in compositions of jejunum and ileum. n = 7.
- J
Beta diversity visualized by metaNMDS plots present differences in the microbial composition in duodenum and ileum & jejunum. n = 7.
- K
Relative expression of genes involved in triglyceride and chylomicron synthesis in jejunum of Pkd2wt / wt and Pkd2ki / ki male mice after 1 week in HFD. n = 7.
- A
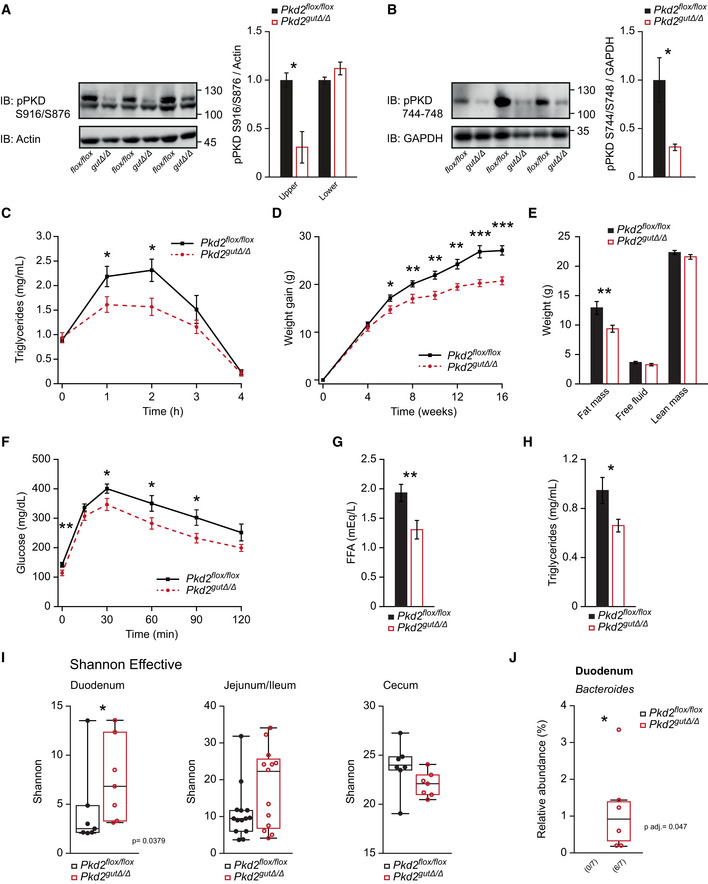
Western blot and quantification of phosphorylated PKD (S916/S876) in small intestine of Pkd2flox / flox and Pkd2gutΔ / Δ male mice. n = 3.
- B
Western blot and quantification of phosphorylated PKD (S744–748) in small intestine of Pkd2flox / flox and Pkd2gutΔ / Δ male mice. n = 3.
- C
Lipids tolerance test after oral gavage of olive oil to Pkd2flox / flox and Pkd2gutΔ / Δ male mice after 6 weeks in HFD. n = 10.
- D
Body weight gain of male mice of indicated genotypes in HFD. n = 10.
- E
Quantification of fat, free fluid, and lean mass by nuclear magnetic resonance of mice in panel (B). n = 10.
- F
Glucose tolerance test of male mice with indicated genotypes after 16 weeks in HFD. n = 10.
- G, H
(G) Free fatty acids and (H) Triglyceride content in serum of male mice after 17 weeks in HFD. n = 10.
- I
Differences in bacterial alpha diversity as indicated by Shannon Index. n = 7.
- J
Changes in specific operational taxonomic unit (OTU) in small intestinal samples. n = 7.
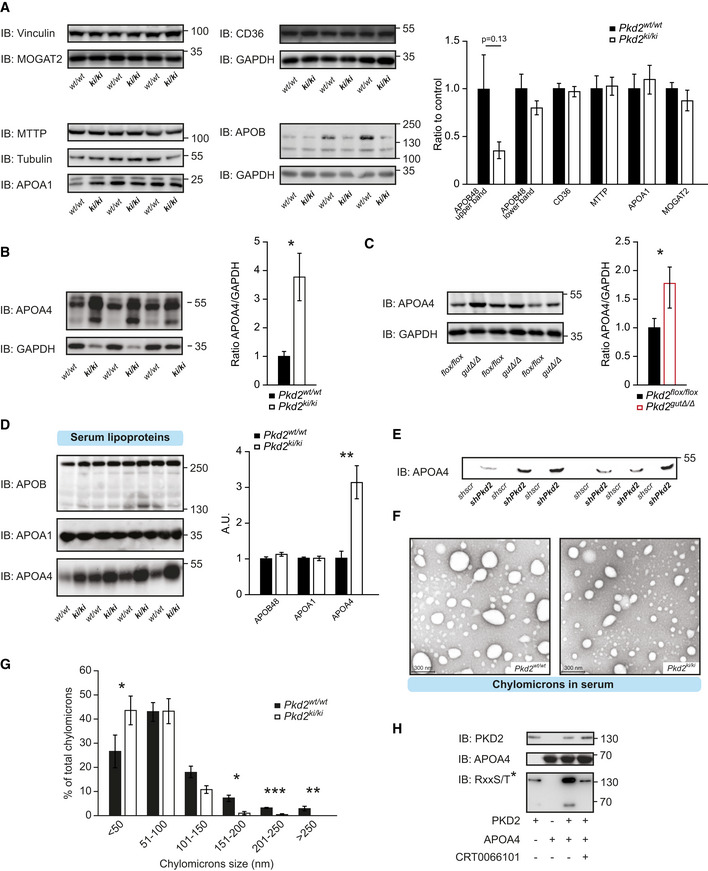
Western blot (WB) analysis of specified proteins in small intestine of Pkd2wt / wt and Pkd2ki / ki male mice after 1 week of HFD. Quantification of the bands for each protein normalized to loading control and relative to Pkd2wt / wt. n = 3.
WB of apoliprotein A4 in jejunum of Pkd2wt / wt and Pkd2ki / ki male mice after 1 week of HFD. Quantification of bands normalized to loading control and relative to Pkd2wt / wt. n = 3.
WB of apoliprotein A4 in jejunum of Pkd2flox / flox and Pkd2gutΔ / Δ male mice after 1 week of HFD. Quantification of bands normalized to loading control and relative to Pkd2flox / flox n = 7.
WB analysis of specified apolipoproteins in 10 µl of serum of overnight fasted, 2 h refed male animals after 1 week in HFD. Quantification of bands relative to Pkd2wt / wt. n = 4.
WB of 20 µl of basal medium of Caco2 cells expressing shscramble or shPkd2 in Transwell system after 12 h of stimulation with oleic acid. n = 6.
Electron microscopy pictures of chylomicrons obtained by ultracentrifugation of plasma from Pkd2wt / wt and Pkd2ki / ki male mice as specified in methods.
Quantification of the diameter of the chylomicrons shown in panel (F). n = 3.
WB with specified antibodies after an in vitro kinase assay.
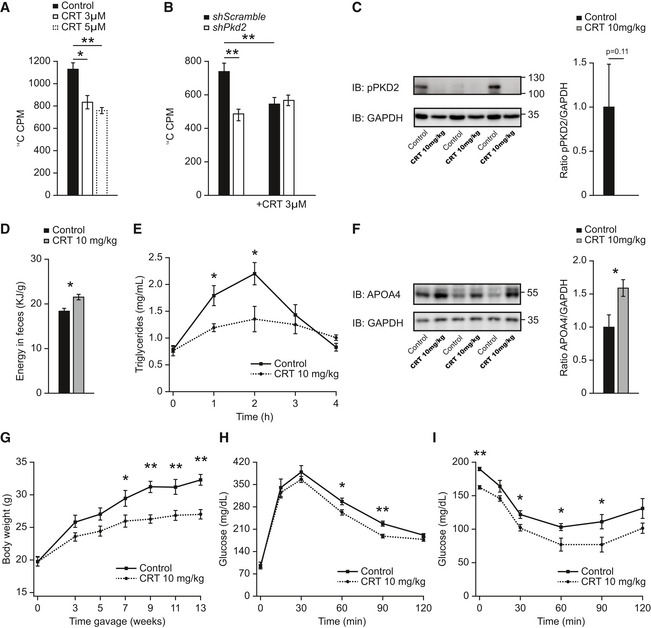
Basolateral release of 14C‐labeled fatty acids in Caco2 cells grown in a Transwell system and treated with CRT0066101 at the indicated concentrations for 24 h. n = 6.
Basolateral release of 14C‐labeled fatty acids in Caco2 cells expressing shscramble or shPkd2 in a Transwell system and treated with CRT0066101 for 24 h. n = 8.
Western blot analysis of phosphorylated PKD2 in jejunum of male C57BL/6 mice in HFD and treated with CRT0066101 or control (water) for 13 weeks. n = 3.
Energy content per gram of feces of male mice in HFD and receiving daily gavage of CRT0066101 or water as control. n = 6 for control and n = 5 for CRT0066101.
Lipid tolerance test after oral gavage of olive oil to male mice after 9 weeks in HFD and receiving daily CRT0066101 or control. n = 6 for control and n = 5 for CRT0066101.
WB of Apolipoprotein A4 (APOA4) in jejunum of male C57BL/6 mice in HFD and treated with CRT0066101 or control (water) for 13 weeks. Quantification of bands normalized to GAPDH and relative to control (water) n = 6.
Body weight of male C57BL/6 mice in HFD and treated with CRT0066101 or control (water) for 13 weeks. n = 6 for control and n = 5 for CRT0066101.
Glucose tolerance test in male C57BL/6 mice which received CRT0066101 or water (control). Measurements after 10 weeks of treatment and HFD feeding. n = 6 for control and n = 5 for CRT0066101.
Insulin tolerance test in male C57BL/6 mice which received CRT0066101 or water (control). Measurements after 11 weeks of treatment and HFD. n = 6 for control and n = 5 for CRT0066101.
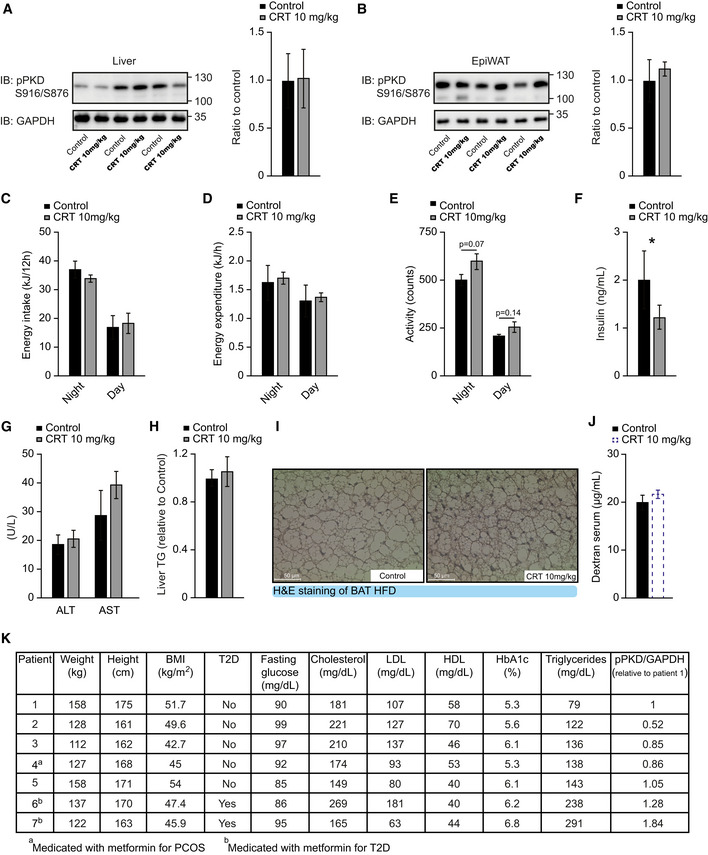
- A
Western blot and quantification of phosphorylated PKD (S916/S876) in liver of male C57BL/6 mice in HFD which received CRT0066101 or water (control) for 13 weeks. n = 3.
- B
Western blot and quantification of phosphorylated PKD (S916/S876) in EpiWAT of male C57BL/6 mice fed HFD which received CRT0066101 or water (control) for 13 weeks. n = 3.
- C–E
Energy intake (C), energy expenditure (D), and activity (E) of male C57BL/6 mice which received CRT0066101 or water (control). Measurements after 7 weeks of treatment and HFD. n = 4.
- F
Insulin levels of male C57BL/6 mice fed with HFD which received CRT0066101 or water (control) for 13 weeks. Samples taken after 4 h fasting and 1‐h refeeding. n = 6 for control and n = 5 for CRT0066101.
- G
Alanine aminotransferase (ALT) and aspartate aminotransferase (AST) levels in serum of male C57BL/6 mice fed HFD which received CRT0066101 or water (control) for 13 weeks. n = 6 for control and n = 5 for CRT0066101.
- H
Triglyceride content in the liver of male C57BL/6 mice fed HFD which received CRT0066101 or water (control) for 13 weeks. Relative to control. n = 6 for control and n = 5 for CRT0066101.
- I
Representative H&E pictures of brown adipose tissue (BAT) of male C57BL/6 mice in HFD which received CRT0066101 or water (control) for 13 weeks.
- J
Intestinal permeability measured by dextran gavage of mice in Fig 7A. n = 8.
- K
Anthropometric, metabolic, and biochemical data from human female patients in Fig 7F–I. n = 7.
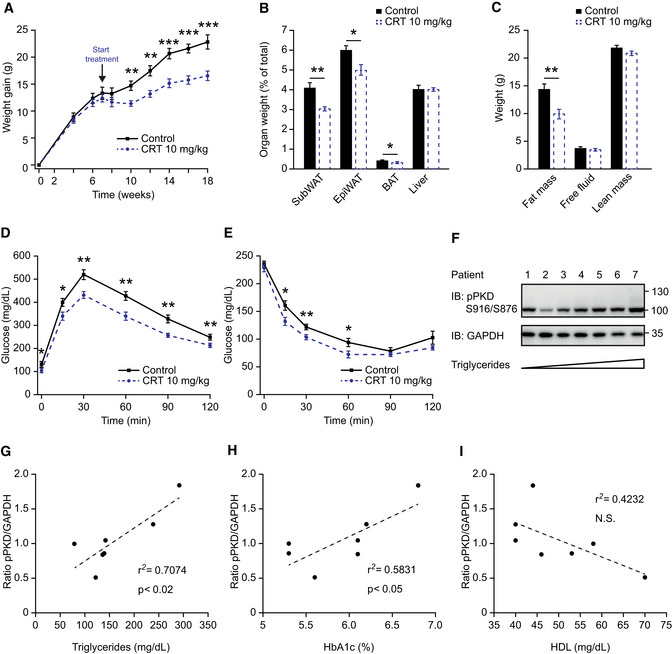
Body weight gain of male C57BL/6 mice that, after 7 weeks in HFD, started receiving treatment with CRT0066101 or water. HFD continued along with treatment. n = 8.
Organ weight (expressed as percentage of total body weight) of different fat depots and liver of male mice in panel (A).
Quantification of fat, free fluid, and lean mass by nuclear magnetic resonance (NMR) of male mice in panel (A).
Glucose tolerance test 8 weeks after starting the treatment of mice in panel (A).
Insulin tolerance test 10 weeks after starting the treatment of mice in panel (A).
Western blot analysis of PKD phosphorylation in proximal jejunum of morbidly obese female patients. Samples are loaded according to fasting triglyceride levels (lower to higher). n = 7.
Scatter plot of PKD phosphorylation in jejunum (normalized to GAPDH) vs. triglycerides of morbidly obese female patients. n = 7.
Scatter plot of PKD phosphorylation in jejunum (normalized to GAPDH) vs. percentage of glycated hemoglobin (HbA1c) of morbidly obese female patients. n = 7.
Scatter plot of PKD phosphorylation in jejunum (normalized to GAPDH) vs. high‐density lipoprotein (HDL) of morbidly obese female patients. n = 7.
Similar articles
-
Sar1b transgenic male mice are more susceptible to high-fat diet-induced obesity, insulin insensitivity and intestinal chylomicron overproduction.J Nutr Biochem. 2014 May;25(5):540-8. doi: 10.1016/j.jnutbio.2014.01.004. Epub 2014 Feb 5. J Nutr Biochem. 2014. PMID: 24657056
-
Glucagon-Like Peptide 2 (GLP-2) Stimulates Postprandial Chylomicron Production and Postabsorptive Release of Intestinal Triglyceride Storage Pools via Induction of Nitric Oxide Signaling in Male Hamsters and Mice.Endocrinology. 2015 Oct;156(10):3538-47. doi: 10.1210/EN.2015-1110. Epub 2015 Jul 1. Endocrinology. 2015. PMID: 26132919
-
Characterization of cytoplasmic lipid droplets in each region of the small intestine of lean and diet-induced obese mice in response to dietary fat.Am J Physiol Gastrointest Liver Physiol. 2021 Jul 1;321(1):G75-G86. doi: 10.1152/ajpgi.00084.2021. Epub 2021 May 19. Am J Physiol Gastrointest Liver Physiol. 2021. PMID: 34009042 Free PMC article.
-
Signposts in the assembly of chylomicrons.Front Biosci. 2001 Mar 1;6:D320-31. doi: 10.2741/hussain. Front Biosci. 2001. PMID: 11229873 Review.
-
Intestinal lipid absorption and transport in type 2 diabetes.Diabetologia. 2022 Oct;65(10):1587-1600. doi: 10.1007/s00125-022-05765-8. Epub 2022 Jul 30. Diabetologia. 2022. PMID: 35908083 Review.
Cited by
-
Protein kinase D2 modulates hepatic insulin sensitivity in male mice.Mol Metab. 2024 Dec;90:102045. doi: 10.1016/j.molmet.2024.102045. Epub 2024 Oct 12. Mol Metab. 2024. PMID: 39401614 Free PMC article.
-
Genetic variants associated with circulating liver injury markers in Mexican Americans, a population at risk for non-alcoholic fatty liver disease.Front Genet. 2022 Oct 26;13:995488. doi: 10.3389/fgene.2022.995488. eCollection 2022. Front Genet. 2022. PMID: 36386790 Free PMC article.
-
Curcumin suppresses cell proliferation and reduces cholesterol absorption in Caco-2 cells by activating the TRPA1 channel.Lipids Health Dis. 2023 Jan 14;22(1):6. doi: 10.1186/s12944-022-01750-7. Lipids Health Dis. 2023. PMID: 36641489 Free PMC article.
-
When fat meets the gut-focus on intestinal lipid handling in metabolic health and disease.EMBO Mol Med. 2022 May 9;14(5):e14742. doi: 10.15252/emmm.202114742. Epub 2022 Apr 19. EMBO Mol Med. 2022. PMID: 35437952 Free PMC article. Review.
-
A phosphoproteomic approach reveals that PKD3 controls PKA-mediated glucose and tyrosine metabolism.Life Sci Alliance. 2021 Jun 18;4(8):e202000863. doi: 10.26508/lsa.202000863. Print 2021 Aug. Life Sci Alliance. 2021. PMID: 34145024 Free PMC article.
References
-
- Aalto‐Setälä K, Bisgaier CL, Ho A, Kieft KA, Traber MG, Kayden HJ, Ramakrishnan R, Walsh A, Essenburg AD, Breslow JL (1994) Intestinal expression of human apolipoprotein A‐IV in transgenic mice fails to influence dietary lipid absorption or feeding behavior. J Clin Investig 93: 1776–1786 - PMC - PubMed
-
- Clara R, Schumacher M, Ramachandran D, Fedele S, Krieger JP, Langhans W, Mansouri A (2017) Metabolic adaptation of the small intestine to short‐and medium‐term high‐fat diet exposure. J Cell Physiol 232: 167–175 - PubMed
-
- Edgar RC (2013) UPARSE: highly accurate OTU sequences from microbial amplicon reads. Nat Methods 10: 996–998 - PubMed
Publication types
MeSH terms
Substances
LinkOut - more resources
Full Text Sources
Other Literature Sources
Molecular Biology Databases
Miscellaneous
