. 2021 Jul 14;11(7):jkab154.
doi: 10.1093/g3journal/jkab154.

Genomic patterns of structural variation among diverse genotypes of Sorghum bicolor and a potential role for deletions in local adaptation

Affiliations

Genomic patterns of structural variation among diverse genotypes of Sorghum bicolor and a potential role for deletions in local adaptation

Kittikun Songsomboon et al. G3 (Bethesda). .

Abstract

Genomic structural mutations, especially deletions, are an important source of variation in many species and can play key roles in phenotypic diversification and evolution. Previous work in many plant species has identified multiple instances of structural variations (SVs) occurring in or near genes related to stress response and disease resistance, suggesting a possible role for SVs in local adaptation. Sorghum [Sorghum bicolor (L.) Moench] is one of the most widely grown cereal crops in the world. It has been adapted to an array of different climates as well as bred for multiple purposes, resulting in a striking phenotypic diversity. In this study, we identified genome-wide SVs in the Biomass Association Panel, a collection of 347 diverse sorghum genotypes collected from multiple countries and continents. Using Illumina-based, short-read whole-genome resequencing data from every genotype, we found a total of 24,648 SVs, including 22,359 deletions. The global site frequency spectrum of deletions and other types of SVs fit a model of neutral evolution, suggesting that the majority of these mutations were not under any types of selection. Clustering results based on single nucleotide polymorphisms separated the genotypes into eight clusters which largely corresponded with geographic origins, with many of the large deletions we uncovered being unique to a single cluster. Even though most deletions appeared to be neutral, a handful of cluster-specific deletions were found in genes related to biotic and abiotic stress responses, supporting the possibility that at least some of these deletions contribute to local adaptation in sorghum.

Keywords: Sorghum; k-mean clustering; local adaptation; structural variation.


Figures

Figure 1
Figure 1
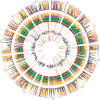
Genome-wide pattern of SVs among 347 sorghum genotypes. The outer ring shows the overall distribution of SVs, where each dash represents a single SV. Red dashes represent deletions, yellow dashes represent inversions, and green dashes represent duplications. The blue and yellow lines in the outermost ring show the π of deletions and SNPs, respectively, in 500 kb sliding windows. The middle ring shows the relative abundance of deletions in 500 kb sliding windows within each of the five groups identified by k-means clustering: group 1 (red), 2 (light blue), 3 (dark green), 4 (light green), 5 (purple), 6 (orange), 7 (yellow), and 8 (pink). The innermost ring is the significance [-log(p)] value of each 500 kb window, indicating whether or not the relative abundance in the window is significantly different from the expected distribution of SVs among the eight groups. The red line shows the Bonferroni corrected significance threshold. The cluster-specific deletions are labeled with the cluster colors on their starting positions.
Figure 2
Figure 2
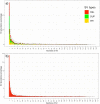
Global site frequency spectrum of SVs. (A) All types of SVs identified in the data. Yellow bars indicate inversions, green bars indicate duplications, and red bars indicate deletions. The dotted black line shows the expected distribution under neutral evolution. (B) Deletions only.
Figure 3
Figure 3
Genome-wide decay of LD between deletions among 347 genotypes. LD was calculated as the correlation coefficient (R2). Blue, red, and black curves represent a moving average calculated in 100 bp sliding windows. The black curve shows the decay of LD for deletions (7766); the blue curve shows the decay for only deletions aligned within genes (1903); the red curve shows the decay for only deletions aligned within CDS regions (641). Vertical dashed lines indicate the point where the average LD decayed to half of its original value (LD1/2).
Figure 4
Figure 4
K-means clustering of SNP data into eight groups. (A) Average silhouette width for different values of K. The vertical dashed line indicates the k-value with the highest silhouette width (k = 8). (B, C) PCA plot for the PC1-PC2 and PC1-PC5. Colors indicate the eight groups identified as the optimal number of clusters. Shapes indicate the races and the regions of origin. Percentages indicate the percent variation explained by each PC.
Figure 5
Figure 5
ADMIXTURE results with K = 8. (A) Cluster membership for each individual in the eight clusters identified by both ADMIXTURE and k-means clustering. (B) The geographic distributions of populations sampled in this study, with colors corresponding to the cluster membership of each population. (C) The distribution and cluster membership of African populations in this study.
Figure 6
Figure 6
TopGO analysis of all genes affected by deletions based on high or moderate impact from snpEff result. Colors indicate the significance of enrichment for a particular GO term, with red indicating the most significantly enriched category.

References

    1. Abyzov A, Urban AE, Snyder M, Gerstein M.. 2011. CNVnator: an approach to discover, genotype, and characterize typical and atypical CNVs from family and population genome sequencing. Genome Res. 21:974–984. - PMC - PubMed
    1. Alexa A, Rahnenfuhrer J.. 2020. topGO: Enrichment Analysis for Gene Ontology. R package version 2.42.0. Rahnenfuhrer.
    1. Alexander DH, Shringarpure SS, Novembre J, Lange K.. 2015. Admixture 1.3 software manual. Los Angeles, CA: UCLA Human Genetics Software Distribution.
    1. Banerjee A, Roychoudhury A.. 2017. Abscisic-acid-dependent basic leucine zipper (bZIP) transcription factors in plant abiotic stress. Protoplasma. 254:3–16. - PubMed
    1. Barton KE, Jones C, Edwards KF, Shiels AB, Knight T.. 2020. Local adaptation constrains drought tolerance in a tropical foundation tree. J Ecol. 108:1540–1552.

Publication types

LinkOut - more resources