. 2021 Nov;40(11):3249-3260.
doi: 10.1109/TMI.2021.3077857. Epub 2021 Oct 27.

On Hallucinations in Tomographic Image Reconstruction

On Hallucinations in Tomographic Image Reconstruction

Sayantan Bhadra et al. IEEE Trans Med Imaging. 2021 Nov.

Abstract

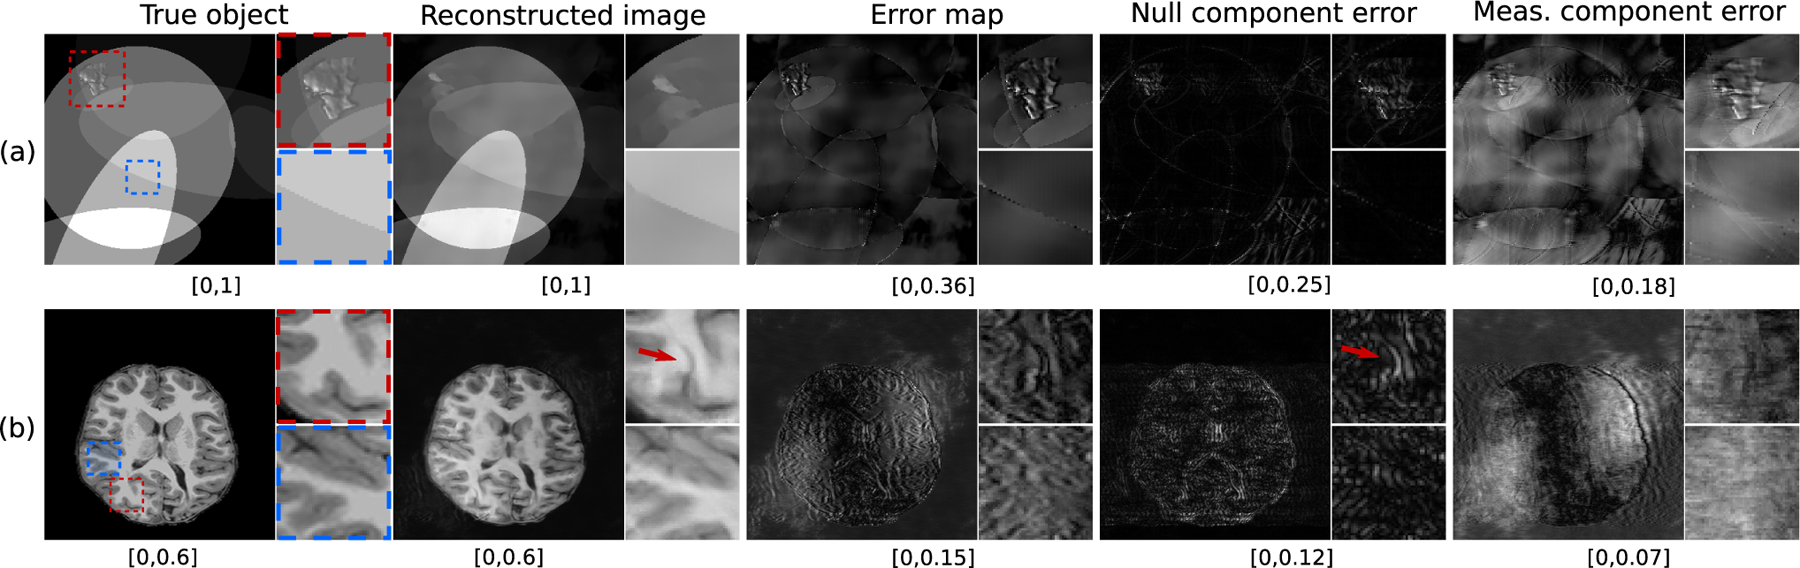
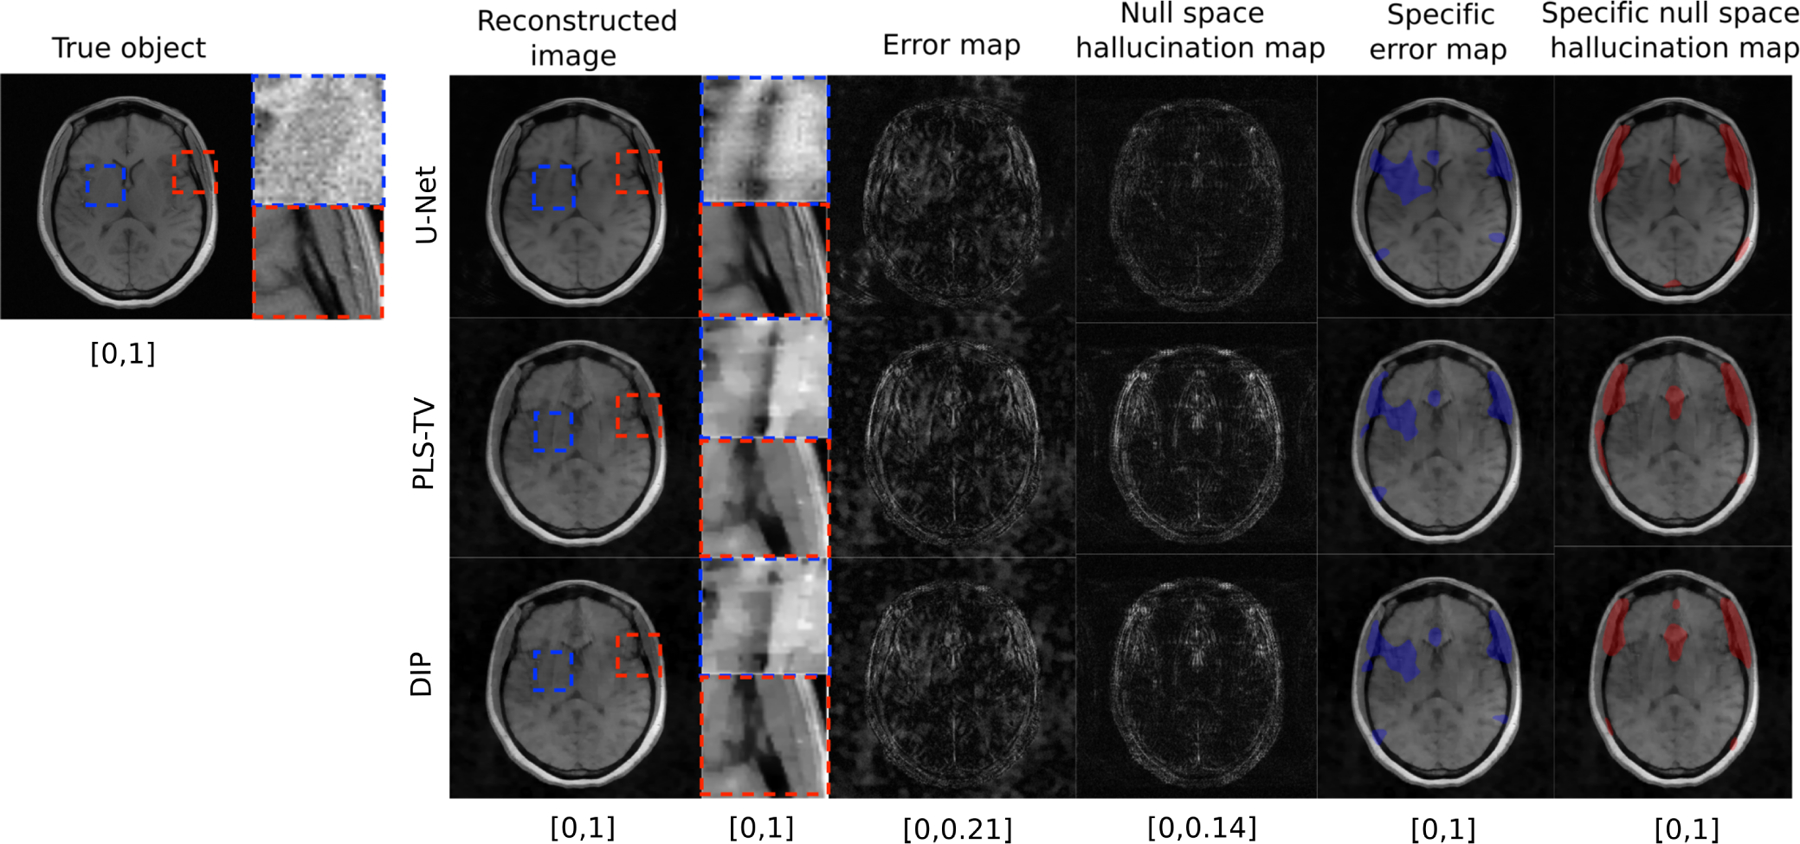
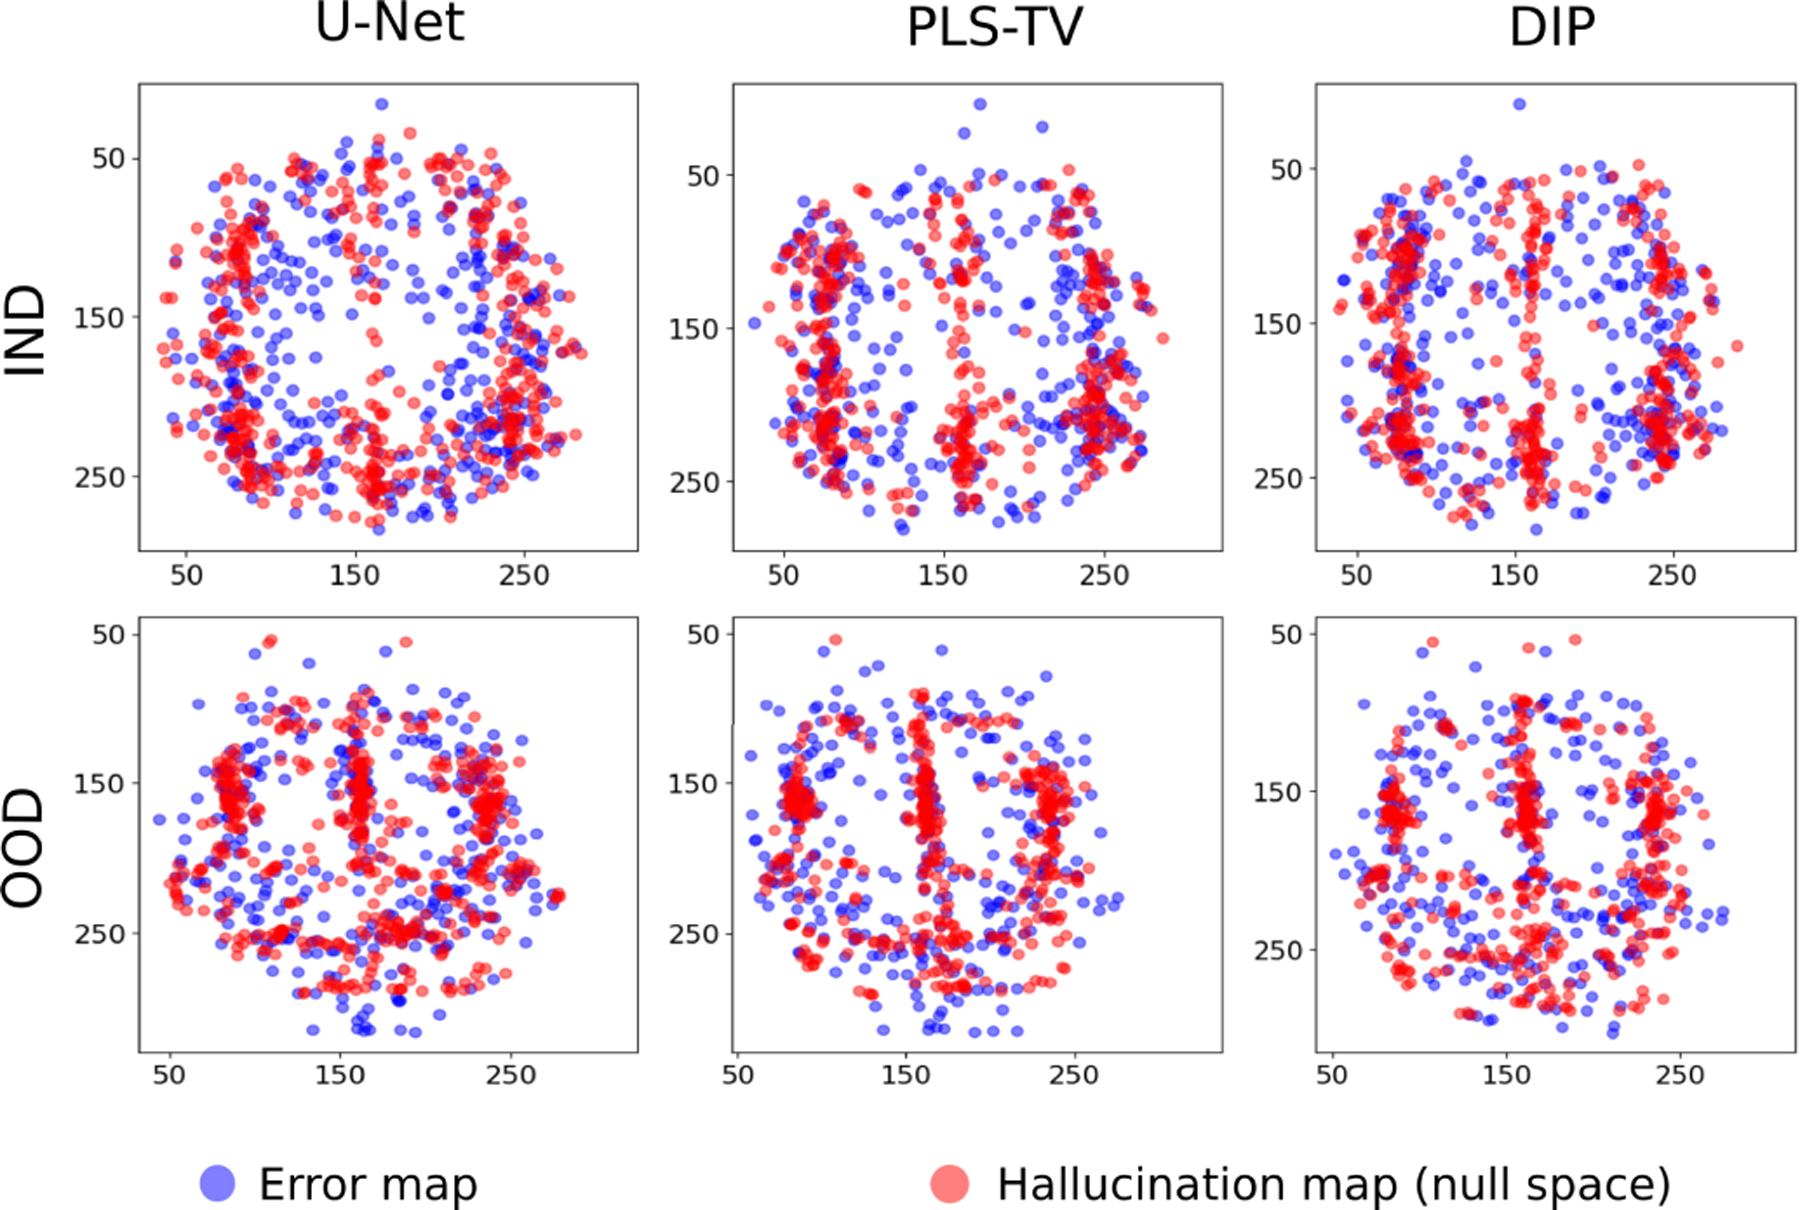
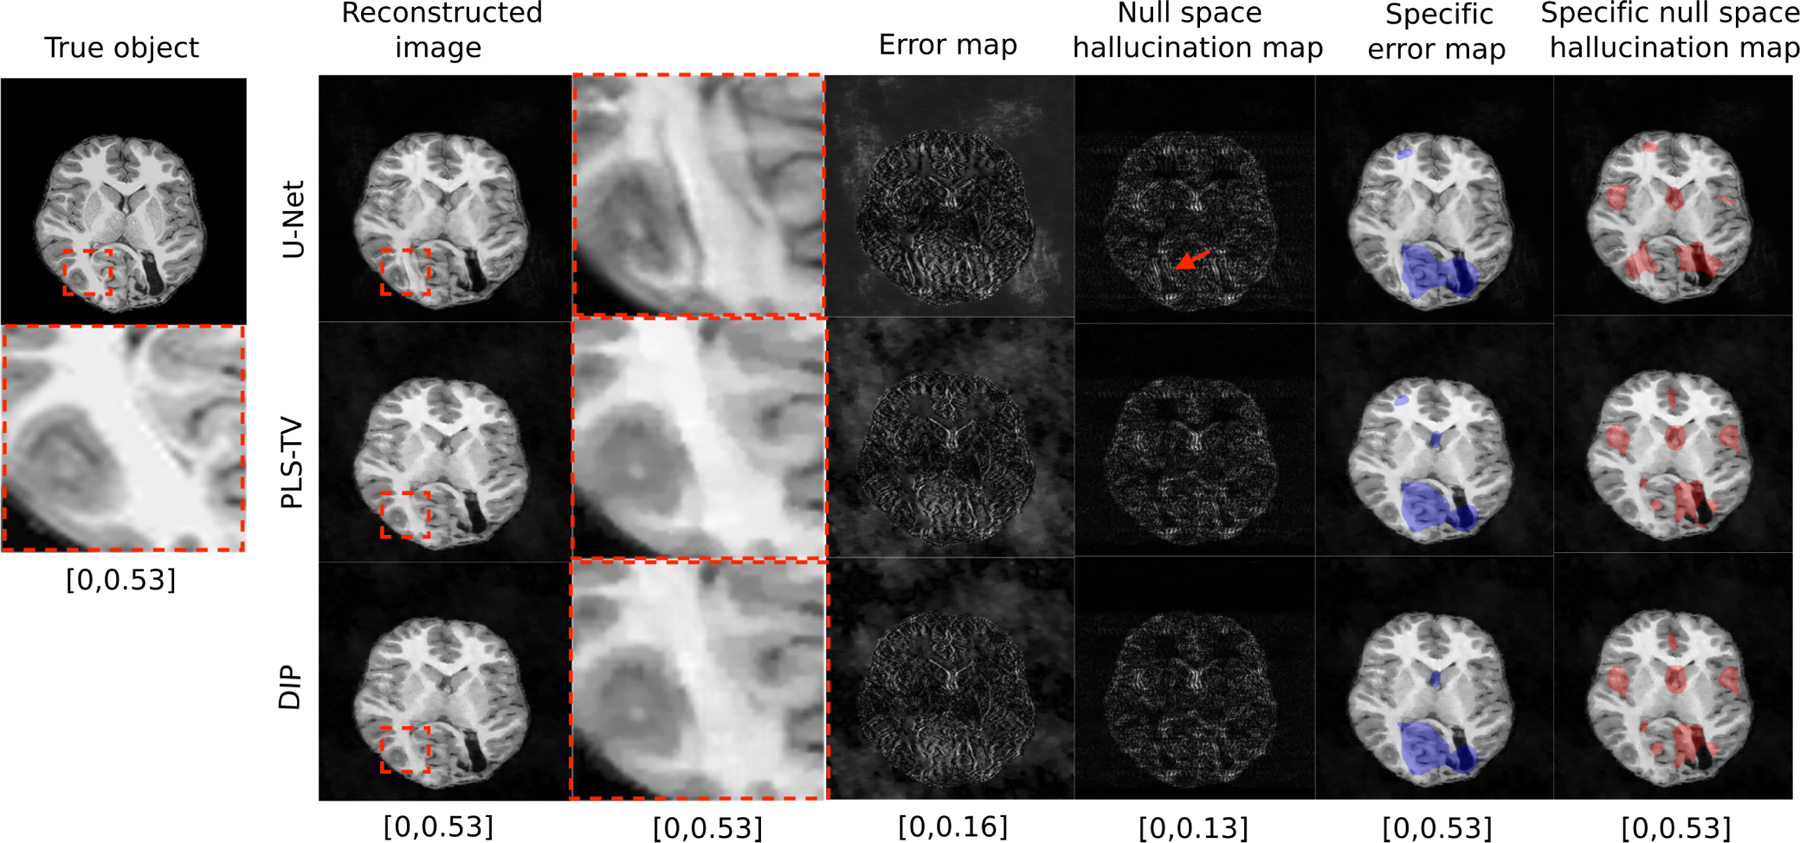
Tomographic image reconstruction is generally an ill-posed linear inverse problem. Such ill-posed inverse problems are typically regularized using prior knowledge of the sought-after object property. Recently, deep neural networks have been actively investigated for regularizing image reconstruction problems by learning a prior for the object properties from training images. However, an analysis of the prior information learned by these deep networks and their ability to generalize to data that may lie outside the training distribution is still being explored. An inaccurate prior might lead to false structures being hallucinated in the reconstructed image and that is a cause for serious concern in medical imaging. In this work, we propose to illustrate the effect of the prior imposed by a reconstruction method by decomposing the image estimate into generalized measurement and null components. The concept of a hallucination map is introduced for the general purpose of understanding the effect of the prior in regularized reconstruction methods. Numerical studies are conducted corresponding to a stylized tomographic imaging modality. The behavior of different reconstruction methods under the proposed formalism is discussed with the help of the numerical studies.


Figures

Fig. 1.
Fig. 1.
From left-to-right are examples of a true object, a reconstructed estimate of the object produced by use of a U-Net from tomographic measurements, the total error map, the error in the null component of the reconstructed object, and the error in the measurement component of the reconstructed object. The two rows correspond to different objects. In each case, the true object is outside the respective training data distribution of the U-Net and phase noise was added to the measurements prior to image reconstruction.
Fig. 2.
Fig. 2.
Example of a true object and reconstructed images along with error maps and hallucination maps (null space) for IND data with different reconstruction methods – U-Net (top), PLS-TV (middle) and DIP (bottom). Expanded regions are shown to the right of the reconstructed images. The specific error map (blue) and specific null space hallucinations map (red) are overlaid on the reconstructed images for each method. The image estimated by the U-Net method has visibly lower hallucinations in the null space compared to PLS-TV and DIP. The region within the red bounding box is one of the locations that contains hallucinations for all the reconstruction methods. In this region, the U-Net method shows mild hallucinations compared to PLS-TV and DIP. Fine structures in this region appear to be oversmoothed in the image estimates obtained by use of PLS-TV and DIP. A false structure is also shown (within the blue bounding box region) that appears for all the reconstruction methods due to the phase noise and not due to the imposed prior, and hence cannot be classified as a hallucination.
Fig. 3.
Fig. 3.
Scatter plots for centroids of localized regions in specific error maps and specific null space hallucination maps with different reconstruction methods for IND (top) and OOD (bottom) data. Note that for each type of data distribution and for all the reconstruction methods, the centroids of the regions detected from the error map have a higher variance compared to the hallucination map as well as some degree of non-overlap.
Fig. 4.
Fig. 4.
Example of true object and reconstructed images along with error map and hallucination maps (null space) for OOD data with different reconstruction methods – U-Net (top), PLS-TV (middle) and DIP (bottom). Expanded regions are shown to the right of the reconstructed images. The specific error map (blue) and specific null space hallucinations map (red) are overlaid on the reconstructed images for each method. The image estimated by the U-Net method has some distinct false structures (region within red bounding box) that do not exist in the reconstructed images obtained by using PLS-TV and DIP. This region is also highlighted in the specific null space hallucination map for the U-Net method which suggests that the false structure is a hallucination.
Fig. 5.
Fig. 5.
(a) Empirical PDF of SSIM values in the structured hallucination regions (support of θ^nullSHM) and the regions spanned by the remaining pixels in the support of the image (background), respectively, for the U-Net method with OOD data. (b) and (c) Empirical PDFs of SSIM values in the structured hallucination regions for all three reconstruction methods with IND and OOD data, respectively.
Fig. 6.
Fig. 6.
An error map, a null space hallucination map and a bias map for IND and OOD images estimated by use of the U-Net method. The corresponding true objects are shown in Figs. 2 and 1(b) respectively. The bias map was computed over a dataset of 100 images estimated from a single set of simulated measurements with fixed phase noise and different realizations of the iid Gaussian noise. The bias map contains contributions from both the model error, as well as inaccuracies in the prior.

References

    1. Kak AC, Slaney M, and Wang G, “Principles of computerized tomographic imaging,” Med. Phys, vol. 29, no. 1, p. 107, 2002.
    1. Yang AC-Y, Kretzler M, Sudarski S, Gulani V, and Seiberlich N, “Sparse reconstruction techniques in MRI: Methods, applications, and challenges to clinical adoption,” Investigative Radiol., vol. 51, no. 6, p. 349, 2016. - PMC - PubMed
    1. Donoho DL, “For most large underdetermined systems of linear equations the minimal ℓ1-norm solution is also the sparsest solution,” Commun. Pure Appl. Math., J. Issued Courant Inst. Math. Sci, vol. 59, no. 6, pp. 797–829, 2006.
    1. Donoho DL and Elad M, “Optimally sparse representation in general (nonorthogonal) dictionaries via ℓ1 minimization,” Proc. Nat. Acad. Sci. USA, vol. 100, no. 5, pp. 2197–2202, 2003. - PMC - PubMed
    1. Candès EJ, Romberg JK, and Tao T, “Stable signal recovery from incomplete and inaccurate measurements,” Commun. Pure Appl. Math., J. Issued Courant Inst. Math. Sci, vol. 59, no. 8, pp. 1207–1223, 2006.

Publication types