. 2021 Jun 7;60(24):13331-13342.
doi: 10.1002/anie.202100273. Epub 2021 May 5.

Comprehensive Analysis of Binding Sites in Tubulin

Affiliations

Comprehensive Analysis of Binding Sites in Tubulin

Tobias Mühlethaler et al. Angew Chem Int Ed Engl. .

Abstract

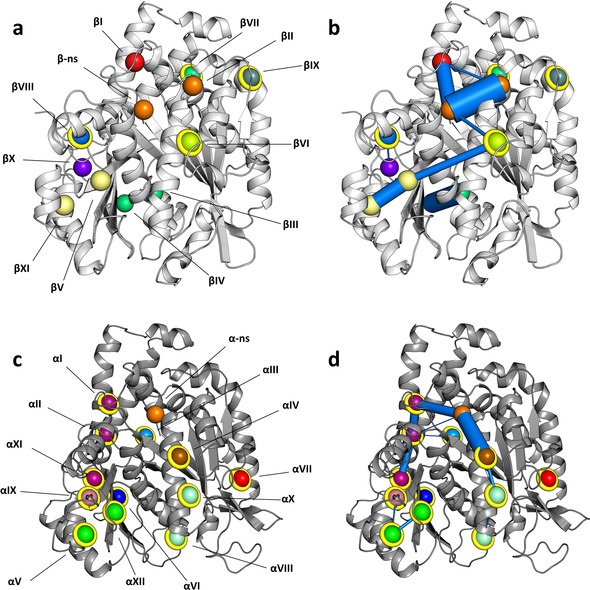
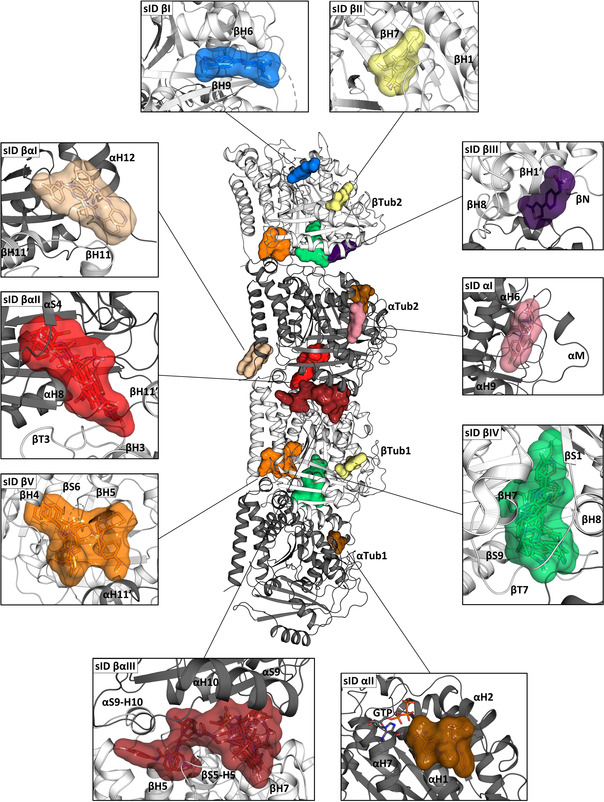
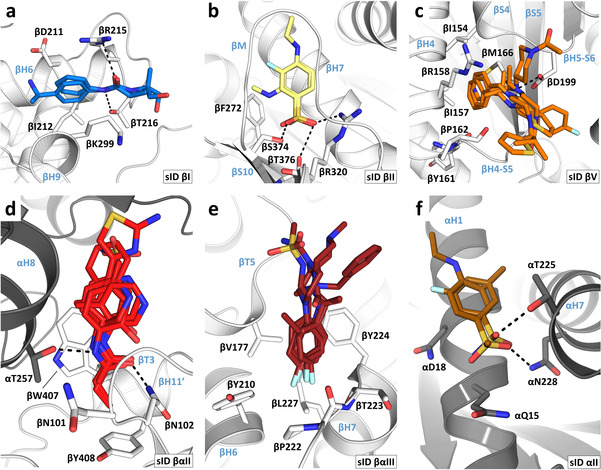
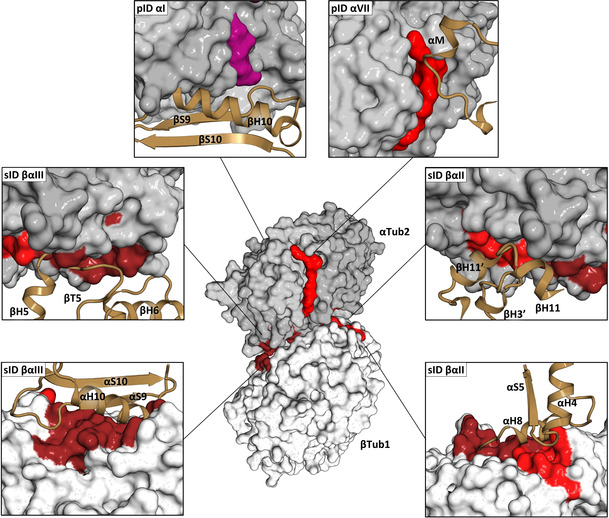
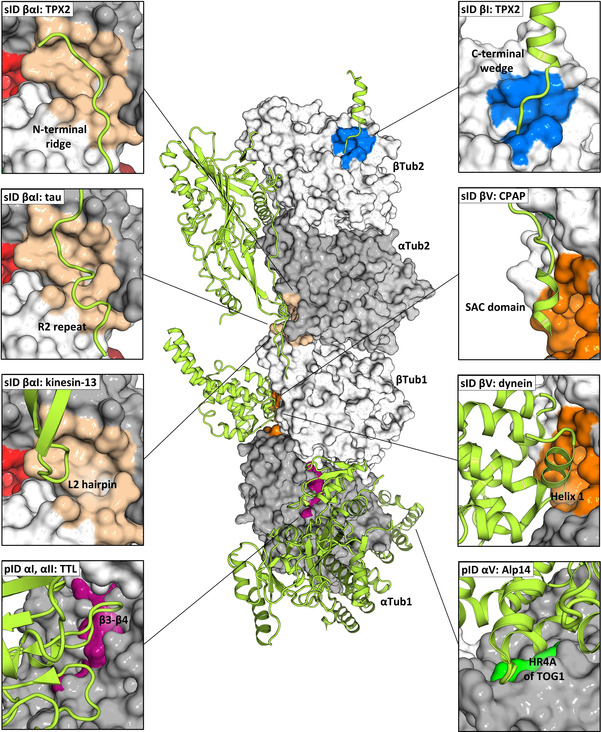
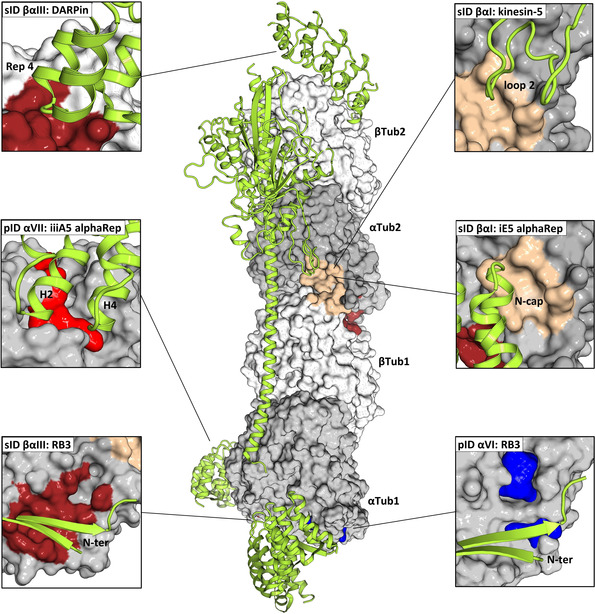
Tubulin plays essential roles in vital cellular activities and is the target of a wide range of proteins and ligands. Here, using a combined computational and crystallographic fragment screening approach, we addressed the question of how many binding sites exist in tubulin. We identified 27 distinct sites, of which 11 have not been described previously, and analyzed their relationship to known tubulin-protein and tubulin-ligand interactions. We further observed an intricate pocket communication network and identified 56 chemically diverse fragments that bound to 10 distinct tubulin sites. Our results offer a unique structural basis for the development of novel small molecules for use as tubulin modulators in basic research applications or as drugs. Furthermore, our method lays down a framework that may help to discover new pockets in other pharmaceutically important targets and characterize them in terms of chemical tractability and allosteric modulation.

Keywords: crystallographic fragment screening; microtubules; molecular dynamics simulation; protein-ligand interactions; tubulin.


Conflict of interest statement

The authors declare no conflict of interest.

Figures

Figure 1
Figure 1
Tubulin pockets and their communication networks predicted by MD simulation. a, c) Predicted pockets in β‐tubulin ((a), light gray ribbon representation) and α‐tubulin ((c), dark gray ribbon representation). b, d) Predicted pocket communication networks in β‐tubulin (b) and α‐tubulin (d). Marine blue lines depict connected network nodes; their widths are displayed proportional to the respective communication frequency between two nodes. Spheres represent center of masses of the pockets (corresponding to network nodes) and are shown in different colors. Identical colors indicate pockets that are often merged during the simulation. Spheres coated with yellow rings highlight novel sites. See also Table S1.
Figure 2
Figure 2
Fragment‐binding sites in tubulin determined by X‐ray crystallography. In the center of the figure, the structure of the two tubulin heterodimers αTub1‐βTub1 and αTub2‐βTub2 are depicted as they are observed in the T2R‐TTL complex. For simplicity, the RB3 and TTL molecules have been omitted. The α‐ and β‐tubulin monomers are shown in dark and light gray ribbon representation, respectively. The surrounding panels show close up views of the revealed fragment sites; the views in the individual panels differ in orientation from the central overview. Only one site is shown in cases where equivalent ones were found in both tubulin dimers. Secondary structural elements defining the sites are labelled. See also Table S3.
Figure 3
Figure 3
Interaction modes and common binding motifs of fragments. a) Fragments 01 and 53 in sID βI. b) Fragments 02 and 03 in sID βII. c) Fragments 20, 21, 22, 23 and 24 in sID βV. d) Fragments 04, 11 31, 32, 35, 40 and 43 in sID βαII. e) Fragments 22, 44, 45, 49, 51 and 54 in sID βαIII. f) Fragments 02 and 25 in sID αII. For all panels, the α‐ and β‐tubulin monomers are depicted in dark and light gray ribbon representation, respectively. Side chains interacting with common fragment binding motifs are shown in stick representation. Secondary structural elements are labeled in blue. Fragments are shown in stick representation using the same color code for their carbon atoms as in Figure 2. Oxygen, nitrogen, sulfur, fluorine and bromine atoms are colored red, blue, yellow, cyan, and brown, respectively. The chemical structures of all 59 fragments identified in this study are shown in Figure S3.
Figure 4
Figure 4
Analysis of tubulin–tubulin contact points. In the center of the Figure, β‐tubulin (βTub1, light gray) and α‐tubulin (αTub2, dark gray) monomers forming a longitudinal inter‐dimer contact along a protofilament in a microtubule (PDB ID 3JAR) are shown in surface representation. The computationally predicted pockets and experimentally determined fragment sites, which are involved in tubulin‐tubulin contacts either along or across protofilaments in microtubules are highlighted in the same color as in Figure 1 and Figure 2. The surrounding panels show close up views of all contact points. The interacting secondary structural elements of neighboring tubulin monomers in the microtubule lattice are shown in brown ribbon representation. See also Table S4.
Figure 5
Figure 5
Analysis of tubulin–protein contact points (part 1). In the center of the panel, the structure of the two tubulin heterodimers αTub1‐βTub1 and αTub2‐βTub2 of the T2R‐TTL complex are depicted in surface representation; the α‐ and β‐tubulin monomers are colored in dark and light gray, respectively. The computationally predicted pockets and experimentally determined fragment sites, which are targeted by protein partners are represented and colored as in Figure 1 and Figure 2. Protein partners are shown in light green ribbon representation. The surrounding panels show close up views of all interaction sites; the views in the individual panels differ in orientation from the central overview. The following PDB IDs were used for the analysis: 5ITZ (CPAP), 6B0I (kinesin‐13), 6MZG (Alp14), 5LXT (TTL), 6BJC (TPX2), 6CVN (tau), and 6RZA (dynein). See also Table S5.
Figure 6
Figure 6
Analysis of tubulin–protein contact points (part 2). In the center of the panel, the structure of the two tubulin heterodimers αTub1‐βTub1 and αTub2‐βTub2 of the T2R‐TTL complex are depicted in surface representation; the α‐ and β‐tubulin monomers are colored in dark and light gray, respectively. The computationally predicted pockets and experimentally determined fragment sites, which are targeted by protein partners are represented and colored as in Figure 1 and Figure 2. Protein partners are shown in light green ribbon representation. The surrounding panels show close up views of all interaction sites; the views in the individual panels differ in orientation from the central overview. The following PDB IDs were used for the analysis: 5EYP (DARPin), 5MM7 (kinesin‐5), 5LXT (RB3), 6GX7 (iiiA5 alphaREP), and 6GWC (iE5 alphaRep). See also Table S5.

References

    1. Downing K. H., Annu. Rev. Cell Dev. Biol. 2000, 16, 89–111. - PubMed
    1. Steinmetz M. O., Prota A. E., Trends Cell Biol. 2018, 28, 776–792. - PubMed
    1. None
    1. Baas P. W., Ahmad F. J., Brain 2013, 136, 2937–2951; - PMC - PubMed
    1. Dumontet C., Jordan M. A., Nat. Rev. Drug Discovery 2010, 9, 790–803. - PMC - PubMed

Publication types