. 2021 May 4;33(5):1042-1061.e7.
doi: 10.1016/j.cmet.2021.04.004.

KIM-1 mediates fatty acid uptake by renal tubular cells to promote progressive diabetic kidney disease

Affiliations

KIM-1 mediates fatty acid uptake by renal tubular cells to promote progressive diabetic kidney disease

Yutaro Mori et al. Cell Metab. .

Abstract

Tubulointerstitial abnormalities are predictive of the progression of diabetic kidney disease (DKD), and their targeting may be an effective means for prevention. Proximal tubular (PT) expression of kidney injury molecule (KIM)-1, as well as blood and urinary levels, are increased early in human diabetes and can predict the rate of disease progression. Here, we report that KIM-1 mediates PT uptake of palmitic acid (PA)-bound albumin, leading to enhanced tubule injury with DNA damage, PT cell-cycle arrest, interstitial inflammation and fibrosis, and secondary glomerulosclerosis. Such injury can be ameliorated by genetic ablation of the KIM-1 mucin domain in a high-fat-fed streptozotocin mouse model of DKD. We also identified TW-37 as a small molecule inhibitor of KIM-1-mediated PA-albumin uptake and showed in vivo in a kidney injury model in mice that it ameliorates renal inflammation and fibrosis. Together, our findings support KIM-1 as a new therapeutic target for DKD.

Keywords: DNA damage response; HAVCR1; TIM-1; albuminuria; chronic kidney disease; diabetic nephropathy; proximal tubule; renal fibrosis; senescence; tubulointerstitial disease.


Conflict of interest statement

Declaration of interests J.V.B. and T.I. are co-inventors on KIM-1 patents assigned to Mass General Brigham. J.V.B. and A.K.A. have filed a patent for the discovery of TW-37 as inhibitor of KIM-1 to alleviate chronic kidney disease. J.V.B. is a consultant to Cadent, Praxis, Seattle Genetics, Aldeyra, Sarepta, Praxis, and Angion and owns equity in Goldfinch, Innoviva, MediBeacon, DxNow, Verinano, Autonomous Medical Devices, Renalytix, Pacific Biosciences, and Sentien. V.K.K. has an ownership interest in Tizona Therapeutics, Celsius Therapeutics, and Bicara Therapeutics. V.K.K. has financial interests in Biocon Biologic, BioLegend, Elpiscience Biopharmaceutical Ltd., Equilium Inc., and Syngene Intl. V.K.K. is a member of SABs for Elpiscience Biopharmaceutical Ltd., GSK, Rubius Therapeutics, and Tizona Therapeutics. J.V.B.’s and V.K.K.’s interests were reviewed and are managed by Brigham and Women’s Hospital and Mass General Brigham in accordance with their conflict-of-interest policies. S.X. is an employee and shareholder of Celsius Therapeutics. J.H. is a full-time employee of Boehringer Ingelheim Pharmaceuticals, Inc. TW-37 was identified as a KIM-1 inhibitor in a screen supported by Boehringer Ingelheim Pharmaceuticals, Inc.

Figures
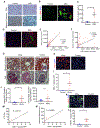
Figure 1.
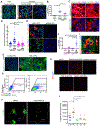
Figure 1.. KIM-1 is expressed in proximal tubules of human individuals with DKD and KKAy DKD-model mice, strongly correlating with tubulointerstitial fibrosis and inflammation.
(A) Representative images of PAS staining (n = 15 (DKD) or 10 (Control) images recorded) and Masson’s Trichrome staining (n = 15 (DKD) or 10 (Control) images recorded) of kidney sections from individuals with DKD and individuals with primary glomerular-limited disease with little tubular-interstitial involvement. Scale bars: 100 μm. (B) Representative immunostaining images of KIM-1 and α-smooth muscle actin (αSMA) in human renal biopsy samples (n = 60 (DKD) or 15 (control) images recorded). KIM-1 was expressed in DKD proximal tubules. KIM-1-positive tubules were surrounded by αSMA-positive myofibroblasts. Scale bars: 20 μm. (C)The number of KIM-1-positive tubules in human renal biopsy samples. All data in the manuscript are plotted as mean ± SEM, *P = 0.0014. (D) Representative immunostaining images of KIM-1 and CD3 in human renal biopsy samples (n = 61 (DKD) or 25 (control) images recorded). KIM-1-positive tubules were surrounded by CD3 positive lymphocytes. Scale bars: 20 μm. (E) Positive correlation between KIM-1-positive area and αSMA-positive area as quantitated with ImageJ in each image taken by confocal microscopy. Data points represent measurements of individual fields (3 to 11 fields in each sample). P < 0.0001, R = 0.8870. (F) Positive correlation between KIM-1 positive area measured by ImageJ and number of CD3 positive lymphocytes in each picture taken by confocal microscopy. Data points represent measurements of individual images (5 to 10 images in each tissue sample). P = 0.0001, R = 0.4033. (G) Top panels: Representative images of Masson’s trichrome staining of the KKAy mouse kidney (n = 5 images recorded). Scale bars: 20 μm. Bottom panels: Representative images of PAS staining of KKAy mouse kidneys (n = 5 images recorded). Scale bars: 10 μm. (H) Representative immunostaining images of KIM-1 in kidneys from KKAy mice (n = 5 images recorded). Scale bars: 10 μm. (I) Quantification of the KIM-1 positive proximal tubules. (KKAy: n = 7; control C57BL/6 mice: n = 6). *P = 0.0144 for KKAy mice vs. control C57BL/6 mice. (J) Urinary KIM-1 and NGAL levels expressed as urinary KIM-1-to-creatinine and NGAL-to-creatinine ratio, respectively, from KKAy mice and non-diabetic control animals. Data are mean ± SEM (KKAy mice: n = 6; control C57BL/6 mice: n = 5). *P = 0.0420, KKAy mice vs. control C57BL/6 mice. (K) Representative immunostaining images for KIM-1 (green) and γH2AX (red, arrowhead) in KKAy mouse kidneys (left) and control C57BL/6 animals (right) (n = 5 images recorded). Scale bars, 10 μm. (L) Quantification of KIM-1 and γH2AX expression at 40 weeks of age when compared to control C57BL/6 animals. Data are mean ± SEM (KKAy: n = 7; control C57BL/6 mice: n = 6). *P = 0.0080, KKAy mice vs. non-diabetic control C57BL/6 animals. (M) Correlation between % interstitial fibrosis and tubular atrophy (IFTA) and the number of KIM-1 positive tubules/HPF in kidneys. Data points represent measurements of individual animals (KKAy: n = 7; control C57BL/6 mice: n = 6). (N) Correlation between the number of globally or segmentally sclerosed glomeruli and the number of KIM-1 positive tubules/HPF in kidneys. Data points represent measurements of individual animals (KKAy: n = 7; control C57BL/6 mice: n = 6).
Figure 2.
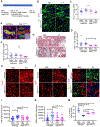
Figure 2.. KIM-1 mediates uptake of PA-bound albumin in renal tubular epithelial cells in vitro.
(A) Representative images of human primary cells transfected with KIM-1 siRNA or control, then treated with red-fluorescent-labeled BSA-PA or labeled BSA only for 2 hr (n = 10 images recorded). Scale bars: 20 μm. (B) Quantification of uptake of PA-BSA or BSA in each image. PA-BSA or BSA positive area were normalized to those of BSA-treated cells control siRNA-transfected cells (n = 10). *P < 0.0001, **P = 0.0027. (C) Representative images of uptake of PA-bound green-fluorescent-labeled BSA by primary mouse wild-type and KIM-1Δmucin mouse PTCs (n = 20 images recorded for each condition). Scale bars, 50 μm. (D) Quantification of uptake of PA-BSA or BSA measured by ImageJ. PA-BSA or BSA positive areas were normalized to average positive area of BSA-treated wild-type cells in each independent experiment. (20 fields were quantitated in each condition, from 2 independent experiments). *P = 0.0002, BSA-wild-type vs. PA-BSA-wild-type. **P < 0.0001. (E) Representative images of uptake of PA-bound red-fluorescent-labeled BSA or labeled BSA only by LLC-PK1 cells expressing KIM-1 or control pcDNA (n = 10 images recorded for each condition). Scale bars: 20 μm. (F) Quantification of uptake of PA-BSA or BSA in each image. PA-BSA or BSA positive areas were normalized to those of BSA-treated pcDNA-PK1 cells in each independent experiment. (n = 10 in each condition, from 2 independent experiments). *P < 0.0001. (G) Representative images of uptake of BODIPY FL C16 (a green-fluorescent analog of PA)-BSA by KIM-1-PK1 cells or pcDNA-PK1 cells (n = 10 images recorded for each condition). Scale bars: 20 μm. (H) Quantification of uptake of BODIPY FL C16-BSA by flow cytometry. The percentage of BODIPY FL C16-positive pcDNA-PK1 cells was 12.3 ±0.3% vs. 94.2 ±0.7% of KIM-1-PK1 cells. P < 0.0001. (I) A representative image of Z-stack analysis of KIM-1-PK1 cells treated with BODIPY FL C16-BSA and immunostained by anti-KIM-1 antibody by confocal microscopy (n = 4 images recorded). Scale bar: 10 μm. (J) Representative images of green-fluorescent-labeled BSA-PA uptake assay on KIM-1-PK1 cells treated with cytochalasin D, an endocytosis inhibitor, or control DMSO (n = 2 (DMSO) or 3 (cytochalasin D) images recorded). The cells were analyzed by confocal microscopy using Z-stacks. Scale bars: 10 μm. (K) Representative images of uptake of various fatty acids with red-fluorescent-labeled BSA on KIM-1-PK1 cells (n = 10 images recorded for each condition). Scale bars: 100 μm. (L) Quantification of uptake of FA-BSA in each image (n = 10). *P = 0.0008, **P < 0.0001. PA: palmitic acid, LA: α-linolenic acid, OA: oleic acid, SA: stearic acid.
Figure 3.
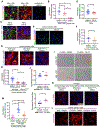
Figure 3.. KIM-1-mediated uptake of PA-albumin causes cell death and pro-inflammatory and pro-fibrotic changes in vitro.
(A) Representative images of effects of exposure of KIM-1-PK or pcDNA-PK cells to PA-BSA or BSA alone for 24 hr (n = 3 images recorded for each condition). Scale bars: 50 μm. (B) Images of effects of exposure of PTCs derived from wild-type or KIM-1Δmucin kidneys to PA-BSA or BSA alone for 24 hr. Left: Microscopic appearance of cells. Scale bars: 100 μm. Right: Cells counted manually in 40X high power fields (n = 10). *P < 0.0001, **P = 0.0168, ***P = 0.0021. (C) Cell death after 24 hr as a function of PA concentration in PTCs derived from wild-type mouse as assessed by flow cytometry. (n = 3) *P = 0.0002, **P < 0.0001. (D) Top: Representative immunostaining images of KIM-1 and caspase-3 in human primary cells treated with PA-BSA or BSA alone for 48 hr (n = 10 images recorded). Scale bars: 20 μm. Bottom: Manual counting of survived cells treated with PA-BSA or BSA alone for 48 hr in 40X high power fields (n = 10). *P < 0.0001. (E) Representative images of ROS production by KIM-1-PK1 or pcDNA-PK1 cells treated with PA or control BSA for 24 hr (n = 3 images recorded). ROS were monitored using H2DCFDA. Scale bars: 100 μm. (F) Representative images of KIM-1 and IL-1β expression in PTCs from wild-type or KIM-1Δmucin mice (n = 4 images recorded for each condition). Cells were treated with 100 μM PA for 48 hours. Scale bars: 20 μm. (G) Left: Representative graphs of DNA content analysis using flow cytometry of human primary cells treated with PA-BSA or BSA alone for 24 hr. Right: Quantification of G2/M phase cells and S phase cells after treatment with PA-BSA or BSA alone for 24 hr (n = 6 to 9, from 3 independent experiments). *P < 0.0001, **P = 0.0009, ***P = 0.0006. (H) Conditioned media (CM) were prepared from KIM-1-PK1 cells treated with PA-BSA or BSA alone. These conditioned media were evaluated for increases of α-smooth muscle actin (αSMA) expression in mouse primary baby kidney fibroblasts (MPBKF) exposed to the conditioned media (CM). Scale bars: 20 μm. (I) Manual counting of αSMA positive MPBKF cells treated by 10% FBS-DMEM or CM from BSA-treated KIM-1-PK1 cells, PA-BSA-treated KIM-1-PK1 cells or PA-BSA-treated pcDNA-PK1 cells in 40X high power fields (n = 5). *P < 0.0001. (J) Western blot image of fibronectin expression in MPBKF cells treated with 10% FBS-DMEM, 1% BSA-DMEM or CM from PA-BSA-treated pcDNA-PK1 cells, BSA-treated pcDNA-PK1 cells, PA-BSA-treated KIM-1-PK1 cells or BSA-treated KIM-1-PK1 cells. (K) Quantification of αSMA-positive area by ImageJ on mouse primary kidney fibroblasts treated with 1% BSA media with or without 400 μM PA and CM from PA-BSA treated KIM-1-PK1 cells. *P = 0.0040, **P = 0.0015.
Figure 4.
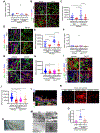
Figure 4.. KIM-1-mediated PA uptake induces inflammation and fibrogenesis in vivo using a novel mice model of aristolochic acid (AA)-induced KIM-1 expression and PA-BSA injection.
(A) Outline of the novel AA-FA mouse model. The groups of mice were: wild-type-PBS (n = 10), wild-type-PA (n = 9), KIM-1Δmucin-PBS (n = 10), KIM-1Δmucin-PA (n = 10). (B) Representative immunostaining images of KIM-1 in AA-FA model mouse kidneys at 17 days (n = 8 images recorded for each condition). Scale bars: 20 μm. (C) Manual counting of KIM-1 expressed tubules in AA-FA mouse model kidneys in 40X high power fields. (D) Quantitative PCR of KIM-1 in AA-FA mouse model kidneys. Statistical analysis was applied to delta-delta Ct value, not fold increase. *P = 0.00939. (E) Representative immunostaining images of KIM-1 and BSA in AA-FA mouse kidneys (n = 15 images recorded). Scale bars: 20 μm. (F) Serum creatinine concentration of AA-FA mice. (G) Representative images of Masson’s trichrome staining of AA-FA mouse kidneys (n = 2 to 5 images recorded for each mouse). Scale bars: 10 μm. (H) Representative immunostaining images of F4/80, a macrophage marker, in AA-FA mouse kidneys (n = 3 images recorded for each mouse). Scale bars: 20 μm. (I) Quantification of F4/80 positive area in each image. One dot indicates one field. Three fields from each mouse were taken randomly. *P < 0.0001, **P = 0.0161, ***P = 0.0238. (J) Representative immunostaining images of αSMA in AA-FA mouse kidneys (n = 3 images recorded for each mouse). Scale bars: 20 μm. (K) Quantification of αSMA positive area in each image. One dot indicates one field. Three fields from each mouse were taken randomly. *P < 0.0001, **P = 0.0185, ***P = 0.0003. (L) Representative images of staining with LTL, which stains differentiated proximal tubule marker, and KIM-1 in AA-FA mouse kidneys (n = 2 to 4 images recorded for each mouse). Scale bars: 20 μm. (M) Manual counting of LTL positive tubules in cortex and outer medulla in AA-FA mouse kidneys in 40X high power fields. One dot indicates the average of ten random fields from one mouse. *P < 0.0001, **P = 0.0040, ***P = 0.0002.
Figure 5.
Figure 5.. KIM-1Δmucin diabetic mice are resistant to development of DKD.
(A) Time course of blood glucose levels in wild-type and KIM-1Δmucin diabetic mice after STZ treatment (wild-type: n = 6; after 12 weeks, n = 5; KIM-1Δmucin: n = 7; after 8 weeks, n = 6). (B) Serum creatinine concentration of STZ-treated mice (n = 6; after 4 days, n = 3). (C) Time course of changes in urinary albumin excretion in diabetic mice (wild-type: n = 6; after 12 weeks, n = 5; KIM-1Δmucin: n = 7; after 12 weeks, n = 6). *P < 0.05. (D) Quantitative PCR of KIM-1mRNA in diabetic mouse or control mouse kidneys (wild-type: n = 4; KIM-1Δmucin: n = 3). Statistical analysis was applied to delta-delta Ct value, not fold increase. *P < 0.05. (E) Representative immunostaining images of KIM-1 in diabetic mouse or control mouse kidneys (n = 5 images recorded for each condition). Scale bars: 10 μm. (F) Top: Representative images of PAS staining of diabetic mouse kidneys (n = 5 images recorded) for each condition. Middle and Bottom: Representative images of Masson’s trichrome staining of diabetic mouse or control mouse kidneys (around cortical proximal tubules) (n = 5 images recorded for each condition). Scale bars: 10 μm. (G) Representative images of staining with fluorescence-labeled LTL in diabetic mouse kidneys (n = 5 images recorded for each condition). Left arrowhead indicates loss of brush borders of cortical proximal tubules in wild-type mouse kidneys. Right arrowhead indicates KIM-1Δmucin diabetic mouse kidneys showed normal appearing brush borders in the cortex. (H) Manual counting of LTL positive tubules in diabetic mouse kidneys in 40X high power fields (n = 3). *P = 0.0021. (I) Representative immunostaining images of KIM-1 and γH2AX in diabetic or control mouse kidneys (n = 5 images recorded for each condition). (J) Manual counting of double positive LTL+ and KIM-1+ tubules in diabetic or control (wild-type) mouse kidneys (control wild-type: n = 3; diabetic wild-type and KIM-1Δmucin: n = 4). *P = 0.0009, **P = 0.0071. (K) Representative images of electron micrographs of PTC mitochondria (arrowheads) in uninjured tubule cells (first row), wild-type (second row) and KIM-1Δmucin (third row) diabetic mice, and in wild-type, non-diabetic mice treated with cisplatin (bottom row) (each n = 5 images recorded for each condition). (L) Representative immunostaining images in diabetic mouse kidneys for KIM-1 (arrowhead) and macrophage marker F4/80 (arrow) (first row); KIM-1 (arrow) and myofibroblast marker αSMA (arrowhead) (second row); endomucin (arrow) and αSMA (bottom row) (each n = 5 images recorded for each condition). Scale bars: 10 μm. (M) Quantification of the fluorescence area stained positive for F4/80 (top), and αSMA (bottom) normalized to the average of diabetic KIM-1Δmucin mice (n = 3). *P = 0.006. (N) Representative images of Masson’s trichrome staining of diabetic or control mouse kidneys (n = 5 images recorded for each condition). Scale bars: 10 μm. (O) Representative images of electron photomicrographs of glomerular changes in diabetic mouse kidneys (n = 5 images recorded for each condition). Podocyte foot process are indicated by arrowheads. (P) Quantification of glomerular size assessed by morphometric analysis using light microscopy (n = 3 in each group). *P = 0.0041. (Q) Quantification of GBM thickness in diabetic mouse kidneys as assessed by EM (n = 3 in each group). *P = 0.0051.
Figure 6.
Figure 6.. TW-37 inhibits KIM-1-mediated PA-albumin uptake and prevents subsequent cell death, and pro-inflammatory and pro-fibrotic changes in vitro.
(A) Representative images of green-fluorescent-labeled BSA-PA uptake assay on KIM-1-PK1 cells treated with TW-37 or control DMSO for 2 hr, or control pcDNA-PK1 cells (immunostained with anti-KIM-1 antibodies) (n = 10 images recorded in each condition). Scale bars: 20 μm. (B) Quantification of uptake of green-fluorescent-labeled PA-BSA in each microscopic field (area of BSA-PA measured by ImageJ normalized to the average in pcDNA-PK1 cells, n = 10 in each condition). *P = 0.0415, **P < 0.0001. (C) Representative images of green-fluorescent-labeled BSA-PA uptake assay on 769-p cells treated with TW-37 or control DMSO (immunostained with KIM-1) (n = 20 images recorded for each condition). Scale bars: 20 μm. (D) Quantification of uptake of green-fluorescent-labeled PA-BSA in each image (area of BSA-PA measured by ImageJ normalized to the average in 769-p cells treated with control DMSO, n = 20 in each condition from 2 independent experiments). *P = 0.0253. (E) Representative images of red-fluorescent-labeled PA-BSA uptake assay on human primary cells treated with TW-37 or control DMSO for 2 hr (immunostained with KIM-1 antibodies) (n = 8 images recorded). Scale bars: 20 μm. (F) Quantification of uptake of red-fluorescent-labeled BSA-PA in each field (area of BSA-PA measured by ImageJ normalized to the average in human primary cells treated with control DMSO, n = 8 in each condition from 2 independent experiments). *P = 0.0475. (G) Representative images of green-fluorescent-labeled BSA-PA uptake assay on wild-type mouse primary cells treated with TW-37 or control DMSO, or KIM-1Δmucin cells (immunostained for KIM-1 expression) (n = 20 images recorded for each condition). Scale bars: 20 μm. (H) Quantification of uptake of green-fluorescent-labeled PA-BSA in each microscopic field (area of PA-BSA measured by ImageJ normalized to the average in wild-type mouse primary cells treated with control DMSO, n = 10 in each condition from 2 independent experiments). *P < 0.0001. (I) Representative images of effect of exposure of KIM-1-PK1 or pcDNA-PK1 cells to PA-BSA with TW-37 or control DMSO for 48 hr (n = 3 images recorded for each condition). Scale bars: 100 μm. (J) Survival rate of pcDNA-PK1 (Top) or KIM-1-PK1 (Bottom) cells treated with PA-BSA with TW-37 or control DMSO for 48 hr, normalized to control DMSO treated cells (n = 12 in each condition from 4 independent experiments). *P < 0.0001. (K) Representative immunostaining images of IL-1β in wild-type or KIM-1Δmucin mouse primary cells treated with PA-BSA with TW-37 or control DMSO for 24 hr (n = 20 images recorded).Scale bars: 20 μm. (L) Representative images of fibrosis bioassay on mouse primary kidney fibroblasts (MPKFs) and conditioned media (CM) harvested from human primary epithelial cells (n = 15 images recorded). Conditioned media were prepared from human primary renal epithelial cells treated with PA-BSA or BSA alone with TW-37 or control DMSO. These conditioned media were bioassayed by measuring αSMA expression in MPKFs. Scale bars: 100 μm. (M) Quantification of αSMA-positive area in fibrosis bioassay in each picture measured by ImageJ (n = 15 in each condition from 3 independent experiments). *P < 0.0001, **P = 0.0206.
Figure 7.
Figure 7.. TW-37 prevents PA- induced injury on day 14 in vivo and in human renal tubuloids in a KIM-1-dependent manner.
(A) Serum creatinine concentration of AA-PA-BSA (or AA-PBS) wild-type BALB/c mice treated with TW-37 or vehicle (PBS-vehicle: n = 4; PBS-TW-37: n = 4, PA-BSA-vehicle: n = 4, PA-BSA-TW-37: n = 5). (B) Representative immunostaining images for F4/80 and KIM-1 in AA-PA mouse kidneys treated with TW-37 or vehicle (n = 5 images recorded for each mouse). Scale bars: 20 μm. (C) Quantification of F4/80 positive area in each image. One dot indicates one image. Five images from each mouse were taken randomly in cortex and outer medulla. *P = 0.0284, **P < 0.0001, ***P = 0.0086. (D) Representative immunostaining images of αSMA and KIM-1 in AA-PA-BSA mouse kidneys treated with TW-37 or vehicle (n = 5 images recorded for each mouse). Scale bars: 20 μm. (E) Quantification of αSMA positive area in each image. One dot indicates one confocal image. Five fields from each mouse were taken randomly. *P < 0.0001, **P = 0.0072. (F) Serum creatinine concentration of AA-PA-BSA wild-type or KIM-1Δmucin C56/BL6 mice with TW-37 or vehicle. (G) Representative immunostaining images of F4/80 and KIM-1 in AA-PA-BSA wild-type or KIM-1Δmucin mouse kidneys treated with TW-37 or vehicle (n = 10 images recorded for each mouse). Scale bars: 20 μm. (H) Quantification of F4/80 positive area in each image. One dot indicates one field. Ten fields from each mouse were taken randomly. *P = 0.0207, **P = 0.0218. (I) Representative immunostaining images of αSMA and KIM-1 in AA-FA wild-type or KIM-1Δmucin mouse kidneys treated with TW-37 or vehicle (n = 10 images recorded for each mouse). Scale bars: 20 μm. (J) Quantification of αSMA positive area in each image. One dot indicates one field. Ten fields from each mouse were taken randomly. *P < 0.0001. (K) A representative image of our newly developed human derived model, “human renal tubuloids” (n = 5 images recorded). Scale bar: 8mm. (L) Representative staining images of KIM-1, LTL and Na-K-ATPase in human renal tubuloids (n = 71 images recorded). Scale bar: 20 μm. (M) Images of tubuloids treated with PA-BSA or control. Scale bars: 100 μm. (N) Representative images of fibrosis bioassay on mouse primary kidney fibroblasts (MPKFs) and conditioned media (CM) harvested from human renal tubuloids (n = 10 images recorded for each condition). Conditioned media were prepared from human renal tubuloids treated with PA-BSA or BSA alone with TW-37 or control DMSO. These conditioned media were bioassayed by measuring αSMA expression in MPKFs. Scale bars: 100 μm. (O) Quantification of αSMA-positive area in fibrosis bioassay in each picture measured by ImageJ (n = 10 in each condition from 2 independent experiments). *P = 0.0004, **P = 0.0026.

References

    1. Abais JM, Xia M, Zhang Y, Boini KM, and Li PL (2015). Redox regulation of NLRP3 inflammasomes: ROS as trigger or effector? Antioxid Redox Signal 22, 1111–1129. - PMC - PubMed
    1. Abraham RT (2001). Cell cycle checkpoint signaling through the ATM and ATR kinases. Genes Dev 15, 2177–2196. - PubMed
    1. Akazawa Y, Nakashima R, Matsuda K, Okamaoto K, Hirano R, Kawasaki H, Miuma S, Miyaaki H, Malhi H, Abiru S, et al. (2019). Detection of DNA damage response in nonalcoholic fatty liver disease via p53-binding protein 1 nuclear expression. Mod Pathol 32, 997–1007. - PubMed
    1. Alicic RZ, Rooney MT, and Tuttle KR (2017). Diabetic Kidney Disease: Challenges, Progress, and Possibilities. Clin J Am Soc Nephrol 12, 2032–2045. - PMC - PubMed
    1. Arici M, Chana R, Lewington A, Brown J, and Brunskill NJ (2003). Stimulation of proximal tubular cell apoptosis by albumin-bound fatty acids mediated by peroxisome proliferator activated receptor-gamma. J Am Soc Nephrol 14, 17–27. - PubMed

Publication types

MeSH terms