. 2021 Jul 20;144(3):210-228.
doi: 10.1161/CIRCULATIONAHA.120.049497. Epub 2021 May 6.

Cyclin D2 Overexpression Enhances the Efficacy of Human Induced Pluripotent Stem Cell-Derived Cardiomyocytes for Myocardial Repair in a Swine Model of Myocardial Infarction

Affiliations

Cyclin D2 Overexpression Enhances the Efficacy of Human Induced Pluripotent Stem Cell-Derived Cardiomyocytes for Myocardial Repair in a Swine Model of Myocardial Infarction

Meng Zhao et al. Circulation. .

Abstract

Background: Human induced pluripotent stem cells with normal (wild-type) or upregulated (overexpressed) levels of CCND2 (cyclin D2) expression were differentiated into cardiomyocytes (CCND2WTCMs or CCND2OECMs, respectively) and injected into infarcted pig hearts.

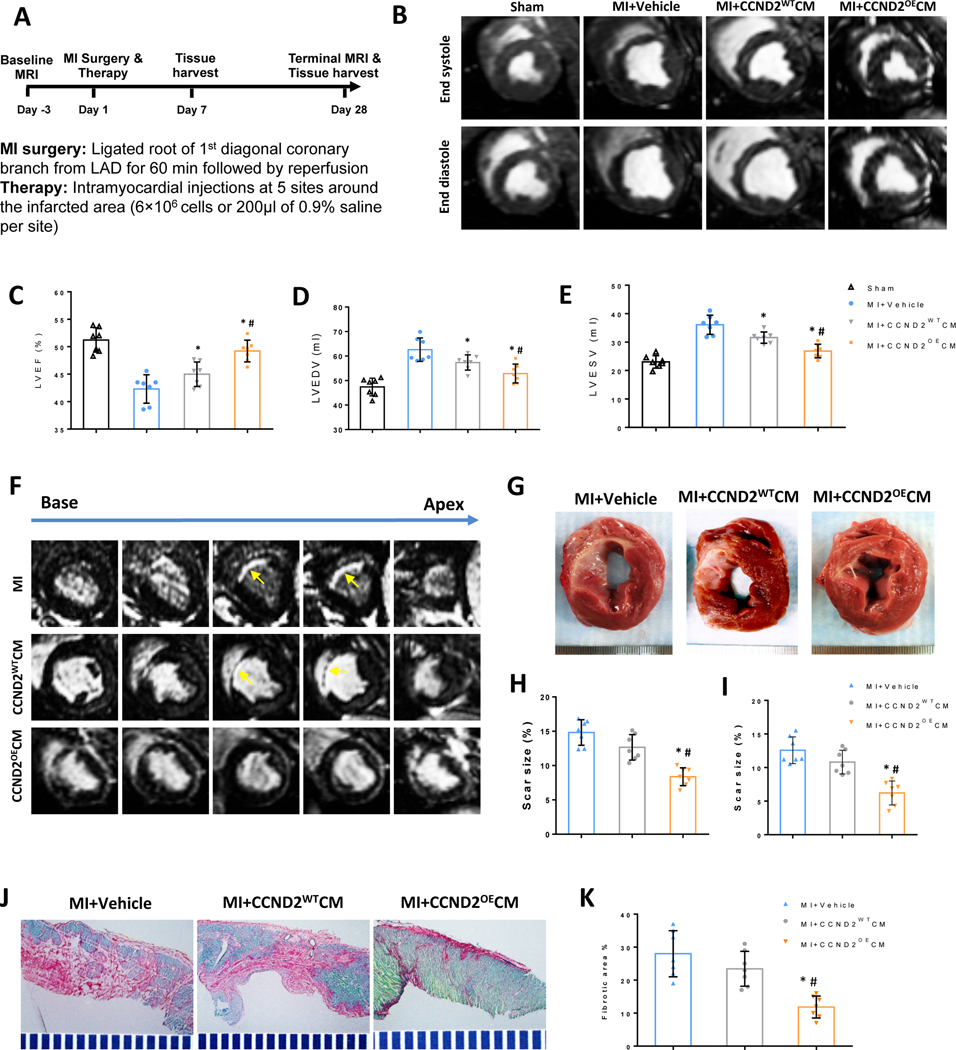
Methods: Acute myocardial infarction was induced by a 60-minute occlusion of the left anterior descending coronary artery. Immediately after reperfusion, CCND2WTCMs or CCND2OECMs (3×10⁷ cells each) or an equivalent volume of the delivery vehicle was injected around the infarct border zone area.

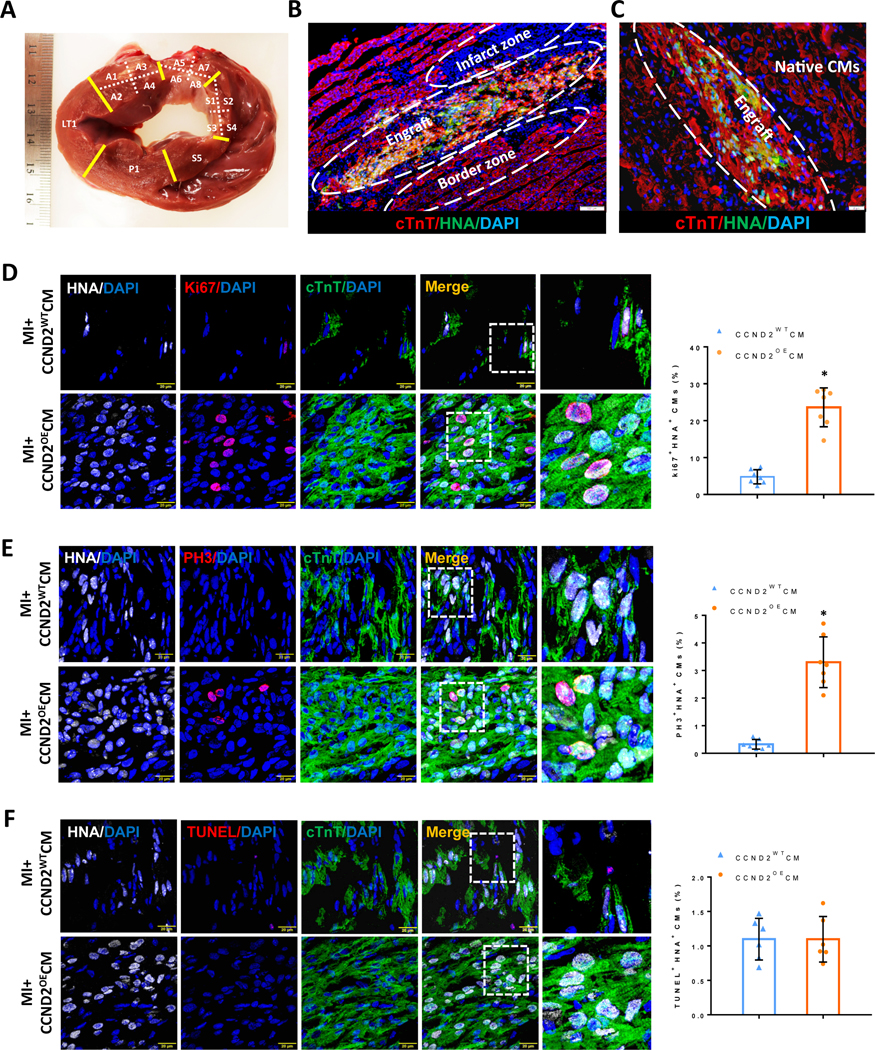
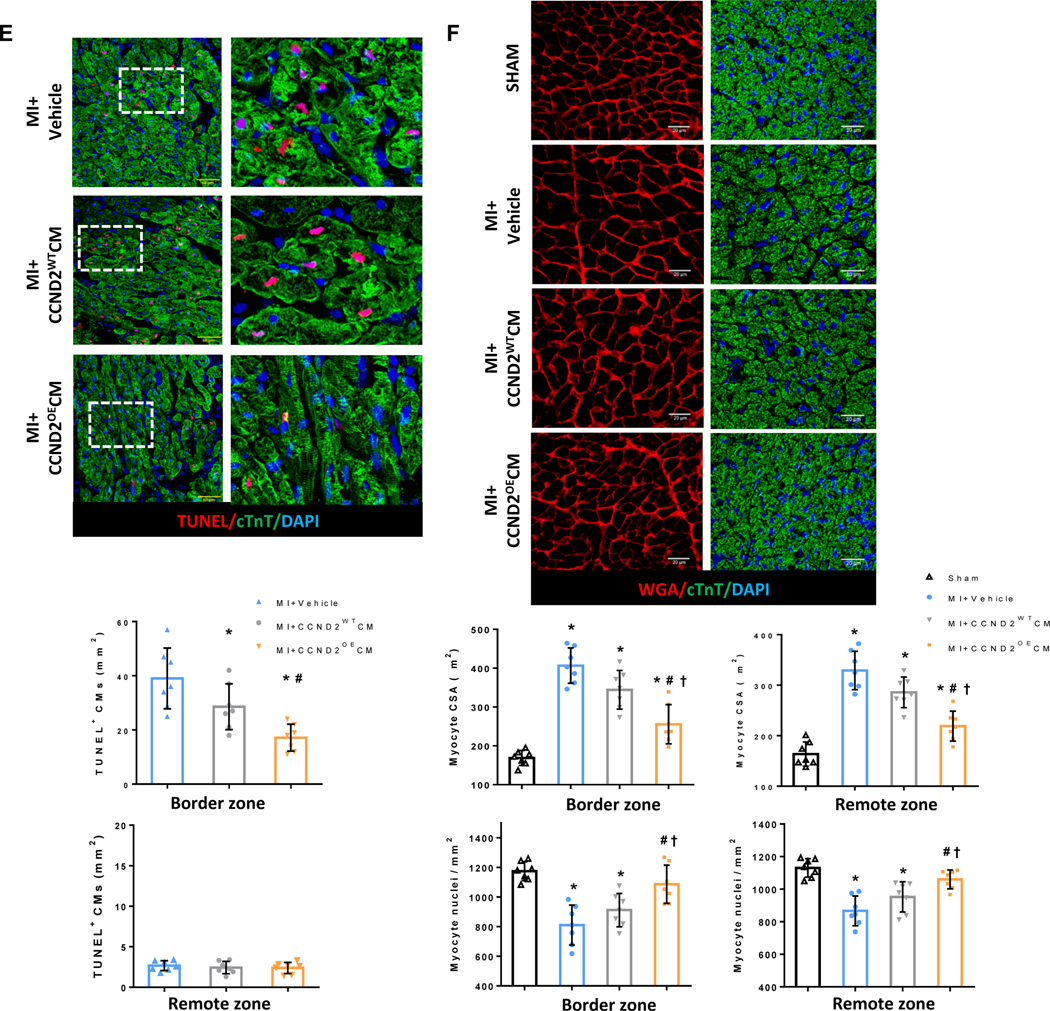
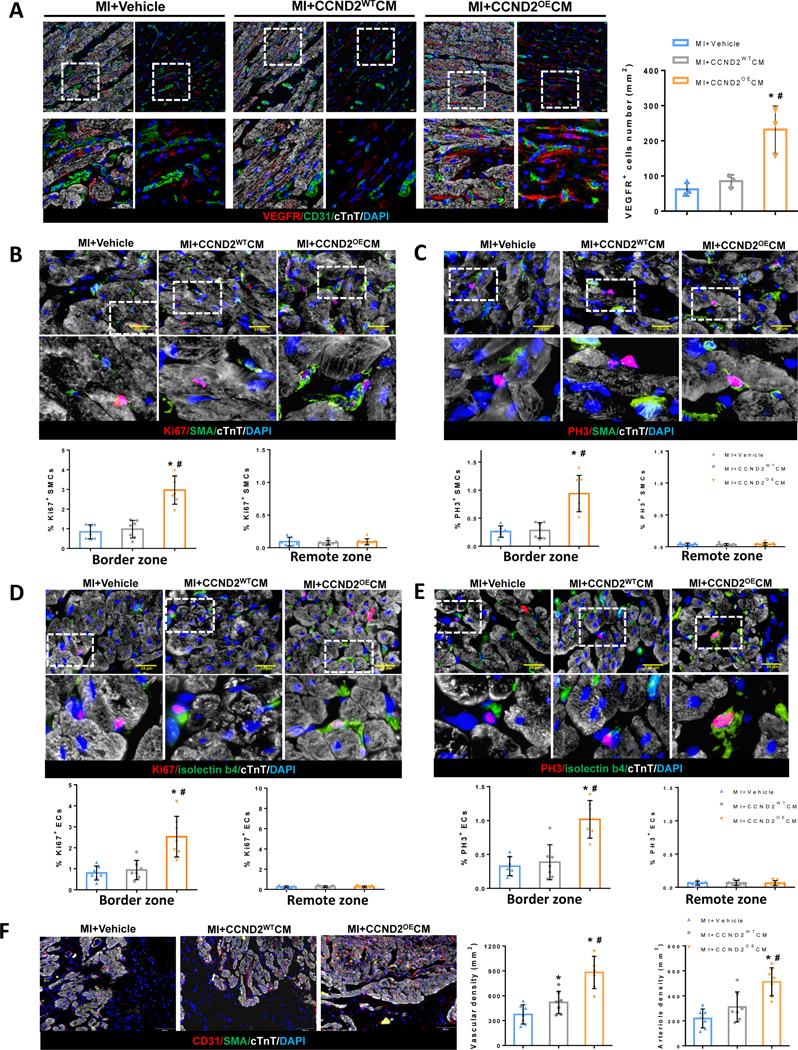
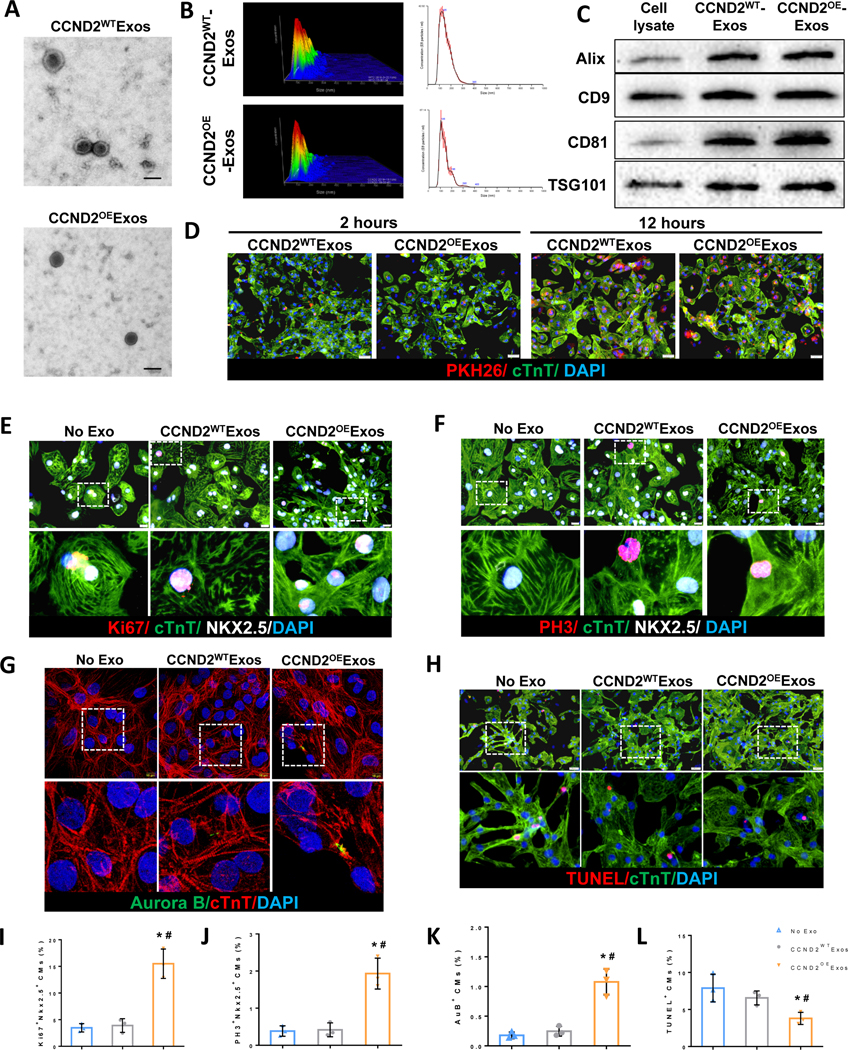
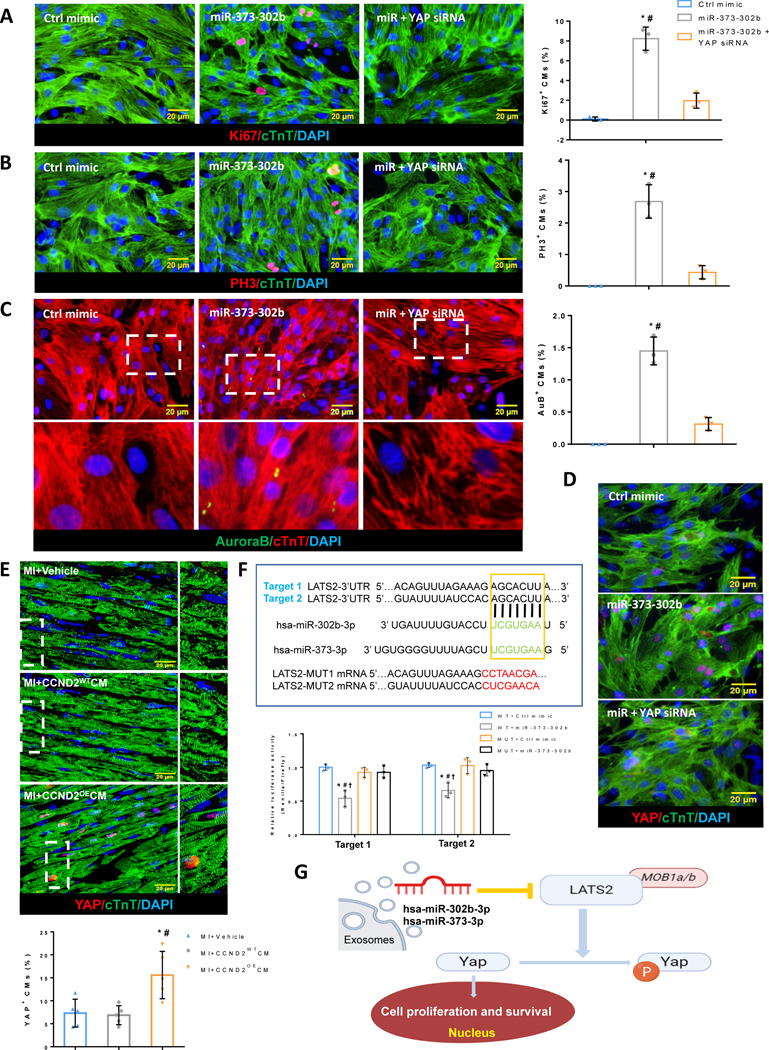
Results: The number of the engrafted CCND2OECMs exceeded that of the engrafted CCND2WTCMs from 6- to 8-fold, rising from 1 week to 4 weeks after implantation. In contrast to the treatment with the CCND2WTCMs or the delivery vehicle, the administration of CCND2OECM was associated with significantly improved left ventricular function, as revealed by magnetic resonance imaging. This correlated with reduction of infarct size, fibrosis, ventricular hypertrophy, and cardiomyocyte apoptosis, and increase of vascular density and arterial density, as per histologic analysis of the treated hearts. Expression of cell proliferation markers (eg, Ki67, phosphorylated histone 3, and Aurora B kinase) was also significantly upregulated in the recipient cardiomyocytes from the CCND2OECM-treated than from the CCND2WTCM-treated pigs. The cell proliferation rate and the hypoxia tolerance measured in cultured human induced pluripotent stem cell cardiomyocytes were significantly greater after treatment with exosomes isolated from the CCND2OECMs (CCND2OEExos) than from the CCND2WTCMs (CCND2WTExos). As demonstrated by our study, CCND2OEExos can also promote the proliferation activity of postnatal rat and adult mouse cardiomyocytes. A bulk miRNA sequencing analysis of CCND2OEExos versus CCND2WTExos identified 206 and 91 miRNAs that were significantly upregulated and downregulated, respectively. Gene ontology enrichment analysis identified significant differences in the expression profiles of miRNAs from various functional categories and pathways, including miRNAs implicated in cell-cycle checkpoints (G2/M and G1/S transitions), or the mechanism of cytokinesis.

Conclusions: We demonstrated that enhanced potency of CCND2OECMs promoted myocyte proliferation in both grafts and recipient tissue in a large mammal acute myocardial infarction model. These results suggest that CCND2OECMs transplantation may be a potential therapeutic strategy for the repair of infarcted hearts.

Keywords: cyclin D2; induced pluripotent stem cells; muscle cells; myocardial infarction.


Conflict of interest statement

Conflict of Interest Disclosures:

None.

Figures

Figure 1.
Figure 1.. CCND2OECMs show greater potency than CCND2WTCMs for recovery from MI in swine.
(A) The study design schematic. MI was surgically induced in pigs via a 60-minute ligation of the LAD coronary artery. After reperfusion, animals in the MI+CCND2OECM group were treated with CCND2-overexpressing hiPSC-CMs, animals in the MI+CCND2WTCM group were treated with hiPSC-CMs that expressed wild type (“normal”) levels of CCND2, and animals in the MI+Vehicle group were treated with the delivery vehicle alone; animals in the SHAM group underwent the same surgical procedures for MI induction except LAD coronary artery ligation and recovered without any of the experimental treatments. Four weeks after MI induction cMRI was performed, and the images (B) were used to calculate left-ventricular ejection fraction (LVEF) (C), end-diastolic volume (LVEDV) (D), end-systolic volume (LVESV) (E), cMRI images of base-to-apex cross-sections of the representative porcine hearts at 4 weeks after receiving MI+vehicle, MI+CCND2WTCMs or MI+CCND2OECMs treatments (F). A representative porcine MI heart cross-section at 4 weeks after receiving the vehicle only, the CCND2WTCMs or the CCND2OECMs injection treatment. Scar-sizes in the cross-sections were evaluated via a cMRI (H) or histological assessments in fresh tissue sections (I) and presented as a percentage of the total LV surface area (G). Fibrosis was evaluated in sections stained with Sirius Red (fibrotic tissue) and Fast Green (functional cardiac tissue) (J) and quantified as a ratio of the fibrotic area to the sum of the fibrotic and non-fibrotic areas, and presented as a percentage (K); * p<0.05 relative to MI+Vehicle control; # p<0.05 relative to MI+CCND2WTCM.
Figure 2.
Figure 2.. CCND2OECMs proliferated after transplantation into infarcted pig hearts.
(A) Gross anatomy of a single cardiac slice from a porcine heart at 4 weeks after the surgery: each slice was divided into different sub-regions for Y-chromosome quantification and other analyses. (B and C) Immunofluorescence images of tissue sections of the porcine hearts subjected to myocardial infarction and transplantation of CCND2OECMs 4 weeks after the treatment. The transplanted hiPSC-CMs were identified by co-expression of cTnT (red) and HNA (green). The Infarct zone, the border zone, the graft and the native (recipient) CMs in the infarcted porcine hearts are marked inside the white dashed ovals or simply marked (Native CMs) on the image panels (B and C), respectively. The scale bars are 100 μm and 20 μm. (D-F) Sections from the infarct border zone were stained for HNA to identify CMs of the human origin (hiPSC-CMs), for cTnT to verify CM identity, for Ki67 (D) and phosphorylated histone 3 (PH3) (E) to verify proliferating activity of the CMs. TUNEL staining was performed to assess the level of apoptosis in the CMs (F). Nuclei were counter-stained with DAPI, and hiPSC-CM proliferation was quantified and presented as a percentage of HNA-expressing cells that also expressed Ki67 or PH3; hiPSC-CM apoptosis was quantified as a percentage of the HNA-expressing cells positive for TUNEL staining. The scale bar is 20 μm; * p<0.05 relative to MI+CCND2WTCM.
Figure 3.
Figure 3.. Endogenous CMs were more proliferative and resistant to MI-induced apoptosis and hypertrophy in CCND2OECM-treated than in CCND2WTCM-treated animals.
(A-C and E-F) Sections from the BZ and RZ were stained for cTnT to visualize all CMs, for (A-C) the transcription factor Nkx2.5, which represents the cardiomyocyte nucleus, for the proliferation markers (A) Ki67, (B) PH3, and (C) Aurora B. Representative images of immunofluorescent staining (A-C) are shown for the BZ only. Nuclei were counterstained with DAPI, and then endogenous CM proliferation was quantified as the percentage of cTNT-expressing cells with the proliferation markers. (D) Representative images of dissociated single cardiomyocytes from the BZ of porcine hearts at 4 weeks after surgery. Moreover, quantification of the percentage of CMs was exhibiting different nucleation. The experiment was performed in a single-blind manner and a minimal of 1000 CMs from each group was counted. (E) Representative images of TUNEL staining and endogenous CM apoptosis were quantified as the percentage of cTnT-expressing cells with TUNEL positive cells. (F) Sections from the BZ and RZ were stained for cTnT to visualize CMs with wheat germ agglutinin (WGA) to visualize cell borders. Nuclei were counterstained with DAPI, and then cell size was quantified via measurements of CM cross-sectional surface area (CSA), and the density of CM nuclei was calculated. The scale bar=20 μm. Panels A-E: *P<0.05 vs. MI+Vehicle, #P<0.05 vs. MI+CCND2WTCM; panel F: *P<0.05 vs. SHAM, #P<0.05 vs. MI+Vehicle, P<0.05 vs. MI+CCND2WTCM.
Figure 4.
Figure 4.. Angiogenic activity in the infarcted porcine hearts was greater following their treatment with CCND2OECMs than with CCND2WTCMs.
(A) Representative images of immunofluorescence tissue staining for VEGFR and quantification of VEGFR+ cells from the BZ of the porcine hearts at 1 week after surgery. Sections from the BZ and the RZ were stained for cTnT to visualize/identify all CMs (A-E), for the proliferation markers Ki67 (B and D), PH3 (C and E), and for smooth-muscle actin (SMA) to identify smooth-muscle cells (SMCs) (B and C) or for CD31(A) or isolectin B4 (D and E) to identify endothelial cells (ECs). Nuclei were counterstained with DAPI, and proliferation of SMCs was quantified as a percentage of SMA+ also expressing Ki67 or PH3 (B, C bar graphs, respectively); Correspondingly, the proliferation of ECs was quantified as a percentage of isolectin-B4+ cells also positive for Ki67 or PH3 (D, E bar graphs, respectively). (F) BZ and RZ sections of the MI hearts stained for the endothelial marker CD31 and costained for cTnT and SMA; Nuclei were counterstained with DAPI. Arteriole and capillary densities were quantified as a number of SMA+ and CD31+ structures per area unit. * p<0.05 relative to MI+Vehicle, # p<0.05 relative to MI+CCND2WTCM.
Figure 5.
Figure 5.. hiPSC-CMs were more proliferative and more resistant to hypoxia-induced apoptosis when cultured with exosomes from CCND2OECMs than exosomes from CCND2WTCMs.
Exosomes were isolated from the culture medium of CCND2OECMs (CCND2OEExos) and CCND2WTCMs (CCND2WTExos). (A) Electron microscopy analysis of exosomes produced from CCND2WTCMs and CCND2OECMs. The scale bar=100 nm. (B) The distribution of exosome sizes was evaluated via nanoparticle-tracking analysis. Moreover, (C) the presence of exosomal marker proteins Alix, CD9, CD81, and TSG101 was confirmed via Western blot. (D) hiPSC-CMs were cultured with exosomes that had been fluorescently labeled with PKH26 for 2 hrs or 12 hrs, followed by fixing and staining for cTnT. Nuclei were counterstained with DAPI. Cellular uptake of the exosomes was confirmed via assessments of PKH26 fluorescence. (E-G) hiPSC-CMs were cultured with CCND2OEExos, CCND2WTExos, or phosphate-buffered saline (PBS) under normoxic conditions for 72 hrs, followed by fixing and staining for cTnT, and the proliferation markers (E) Ki67, (F) PH3, or (G) Aurora B. Nuclei were counterstained with DAPI, and hiPSC-CM proliferation was quantified as the percentage of cells that expressed each of the proliferation markers (I-K). (H) hiPSC-CMs were cultured with adding CCND2OEExos, CCND2WTExos, or PBS under hypoxic conditions for 48 hrs, fixed, and stained for cTnT and TUNEL. Nuclei were counterstained with DAPI. hiPSC-CM apoptosis was quantified as the percentage of cells that were TUNEL+ (L).*P<0.05 vs. PBS, #P<0.05 vs. CCND2WTExo. Each experiment was performed independently for 3 times.
Figure 6.
Figure 6.. CCND2 overexpression in the hiPSC-CMs alters the miRNA content of the hiPSC-CM-secreted exosomes.
(A-E) Identification of miRNA content of the CCND2WTExos and the CCND2OEExos by a bulk miRNA sequence analysis. (A) A Venn diagram depicting the identified exosome-derived miRNAs specific and common for each of the exosome populations (CCND2WTExos and CCND2OEExos), (B) miRNAs that are present in both CCND2WTExos and CCND2OEExos are shown as a volcano plot; the common miRNAs that were present in both exosomal populations in comparable quantities are depicted as gray dots, while the exosomes that were significantly up- or down-regulated in CCND2OEExos are depicted with red or blue dots, respectively. (C and D) Gene Ontology analysis was performed to reveal significant differences between the CCND2WTExo and the CCND2OEExo populations in miRNAs of the cell cycle (C) or the cell death (D) functional categories. (E) The cell-cycle associated miRNAs with significantly different expression levels are depicted in the heat map of Panel 6E. (F) The expression of miRNAs implicated in regulation of cell proliferation (miR-200a-3p, miR-371a-3p, miR-372-3p, miR-373-3p, miR-367-3p) and apoptosis (let-7c-5p, let-7d-3p, miR-133a-3p, miR-143-3p, miR-506-3p, miR-584-5p) was quantified in the CCND2WTExo and the CCND2OEExo populations by qRT-PCR. (G-L) The effect of individual miRNA overexpression recapitulated by transfection of the CCND2WT-CMs with Ctrl-mimic, miR-373-3p mimic, miR-302b-3p mimic, miR-373-302b mimic or miR-373-302b mimic+YAP siRNA analyzed 72 hrs post-transfection. The expression levels of p-YAP and LATS2 upon transient overexpression of various miRNAs were analyzed by western blot (G) and quantified by densitometry, following normalization by GAPDH (I). The effect of the miRNAs on the CM proliferation was assessed by immunofluorescence analyses of Ki67, PH3, and Aurora B expression (H) and quantified as a percentage of cTNT-expressing cells that also expressed Ki67 (J), PH3 (K), or Aurora B (AuB) (L). Right column images in panel H represent insets/blow-up images for the boxed areas. (M) Representative images for an immunofluorescence staining for YAP (red) and cTnT (green) in the hiPSC-CMs transfected with Ctrl mimic, miR-373-302b mimic, or miR-373-302b mimic+YAP siRNA, performed 72 hrs post-transfection. The scale bar is 20 μm. * p<0.05 relative to Ctrl mimic, # p<0.05 relative to miR-373 mimic, p<0.05 relative to miR-302b mimic, p<0.05 relative to miR-302b-373 mimic+YAP siRNA.
Figure 7.
Figure 7.. miR-302b-373 induces cardiomyocyte proliferation by regulation of the Hippo signaling pathway.
(A-C) Immunofluorescence microscopy images of the tracked primary rat cardiomyocytes expressing (A) proliferation marker Ki67 (red), (B) cell cycle M-phase marker PH3 (red), and (C) cytokinesis marker Aurora B kinase (green), captured 72 hrs after transfection with Ctrl mimic, miR-373-302b mimic or miR-373-302b mimic + YAP siRNA. Cell cycle activity in the CMs was analyzed by quantification of Ki67+, PH3+, or Aurora B+ CMs as a percentage of total cTnT+ CMs (A-C bar graphs, respectively). Nuclei were stained with DAPI (blue). The scale bar is 20 μm. * p<0.05 relative to Ctrl mimic, # p<0.05 relative to miR-373-302b mimic+YAP siRNA. (D) Representative immunofluorescence images of the tracked primary rat cardiomyocytes expressing YAP (red) 72 hrs after transfection with Ctrl mimic, miR-373-302b mimic or miR-373-302b mimic+YAP siRNA. The scale bar is 20 μm. (E) Representative confocal microscopy images and quantification of the swine CMs with YAP nuclei translocation (E bar graph) in the heart BZs 4 weeks after the hiPSC-CMs transplantation. Smaller (right column) images in panel E represent insets/blow-up images for the boxed areas. The scale bar is 20 μm. * p<0.05 relative to MI only, # p<0.05 relative to MI+CCND2WT CMs. (F) Validation of the miRNA binding effect to their predicted LATS2 miRNA-target by a dual-luciferase reporter assay. Two putative target sites for hsa-miR-302b-3p were predicted by the TargetScan server in the 3’UTR of the LATS2 mRNA (highlighted in the boxed area). The mutated target sequences are shown below. Relative luciferase activity was measured 48 hrs after co-transfection with luciferase reporters carrying the wild-type or the mutated 3’UTRs of LATS2, as well as the miR-302b mimic or Ctrl mimic in HEK293 cells (F bar graph). WT- wild type, MT- Mutation site. * p<0.05 relative to WT+Ctrl mimic, # p<0.05 relative to MT+Ctrl mimic, † p<0.05 relative to MT+miR-302b mimic. (G) The general view of how miR-302b-3p and miR-373-3p work on the Hippo pathway through inhibiting LATS2, thus causing cell proliferation and survival.

Similar articles

Cited by

References

    1. Ingason AB, Goldstone AB, Paulsen MJ, Thakore AD, Truong VN, Edwards BB, Eskandari A, Bollig T, Steele AN and Woo YJ. Angiogenesis precedes cardiomyocyte migration in regenerating mammalian hearts. J Thorac Cardiovasc Surg. 2018;155:1118–1127 e1. - PMC - PubMed
    1. Qian L, Huang Y, Spencer CI, Foley A, Vedantham V, Liu L, Conway SJ, Fu JD and Srivastava D. In vivo reprogramming of murine cardiac fibroblasts into induced cardiomyocytes. Nature. 2012;485:593–8. - PMC - PubMed
    1. Quevedo HC, Hatzistergos KE, Oskouei BN, Feigenbaum GS, Rodriguez JE, Valdes D, Pattany PM, Zambrano JP, Hu Q, McNiece I, Heldman AW and Hare JM. Allogeneic mesenchymal stem cells restore cardiac function in chronic ischemic cardiomyopathy via trilineage differentiating capacity. Proc Natl Acad Sci U S A. 2009;106:14022–7. - PMC - PubMed
    1. Tao G, Kahr PC, Morikawa Y, Zhang M, Rahmani M, Heallen TR, Li L, Sun Z, Olson EN, Amendt BA and Martin JF. Pitx2 promotes heart repair by activating the antioxidant response after cardiac injury. Nature. 2016;534:119–23. - PMC - PubMed
    1. Lou X, Zhao M, Fan C, Fast VG, Valarmathi MT, Zhu W and Zhang J. N-cadherin overexpression enhances the reparative potency of human-induced pluripotent stem cell-derived cardiac myocytes in infarcted mouse hearts. Cardiovasc Res. 2020;116:671–685. - PMC - PubMed

Publication types

MeSH terms