. 2021 May 6;23(1):50.
doi: 10.1186/s12968-020-00693-1.

Native contrast visualization and tissue characterization of myocardial radiofrequency ablation and acetic acid chemoablation lesions at 0.55 T

Affiliations

Native contrast visualization and tissue characterization of myocardial radiofrequency ablation and acetic acid chemoablation lesions at 0.55 T

Aravindan Kolandaivelu et al. J Cardiovasc Magn Reson. .

Abstract

Purpose: Low-field (0.55 T) high-performance cardiovascular magnetic resonance (CMR) is an attractive platform for CMR-guided intervention as device heating is reduced around 7.5-fold compared to 1.5 T. This work determines the feasibility of visualizing cardiac radiofrequency (RF) ablation lesions at low field CMR and explores a novel alternative method for targeted tissue destruction: acetic acid chemoablation.

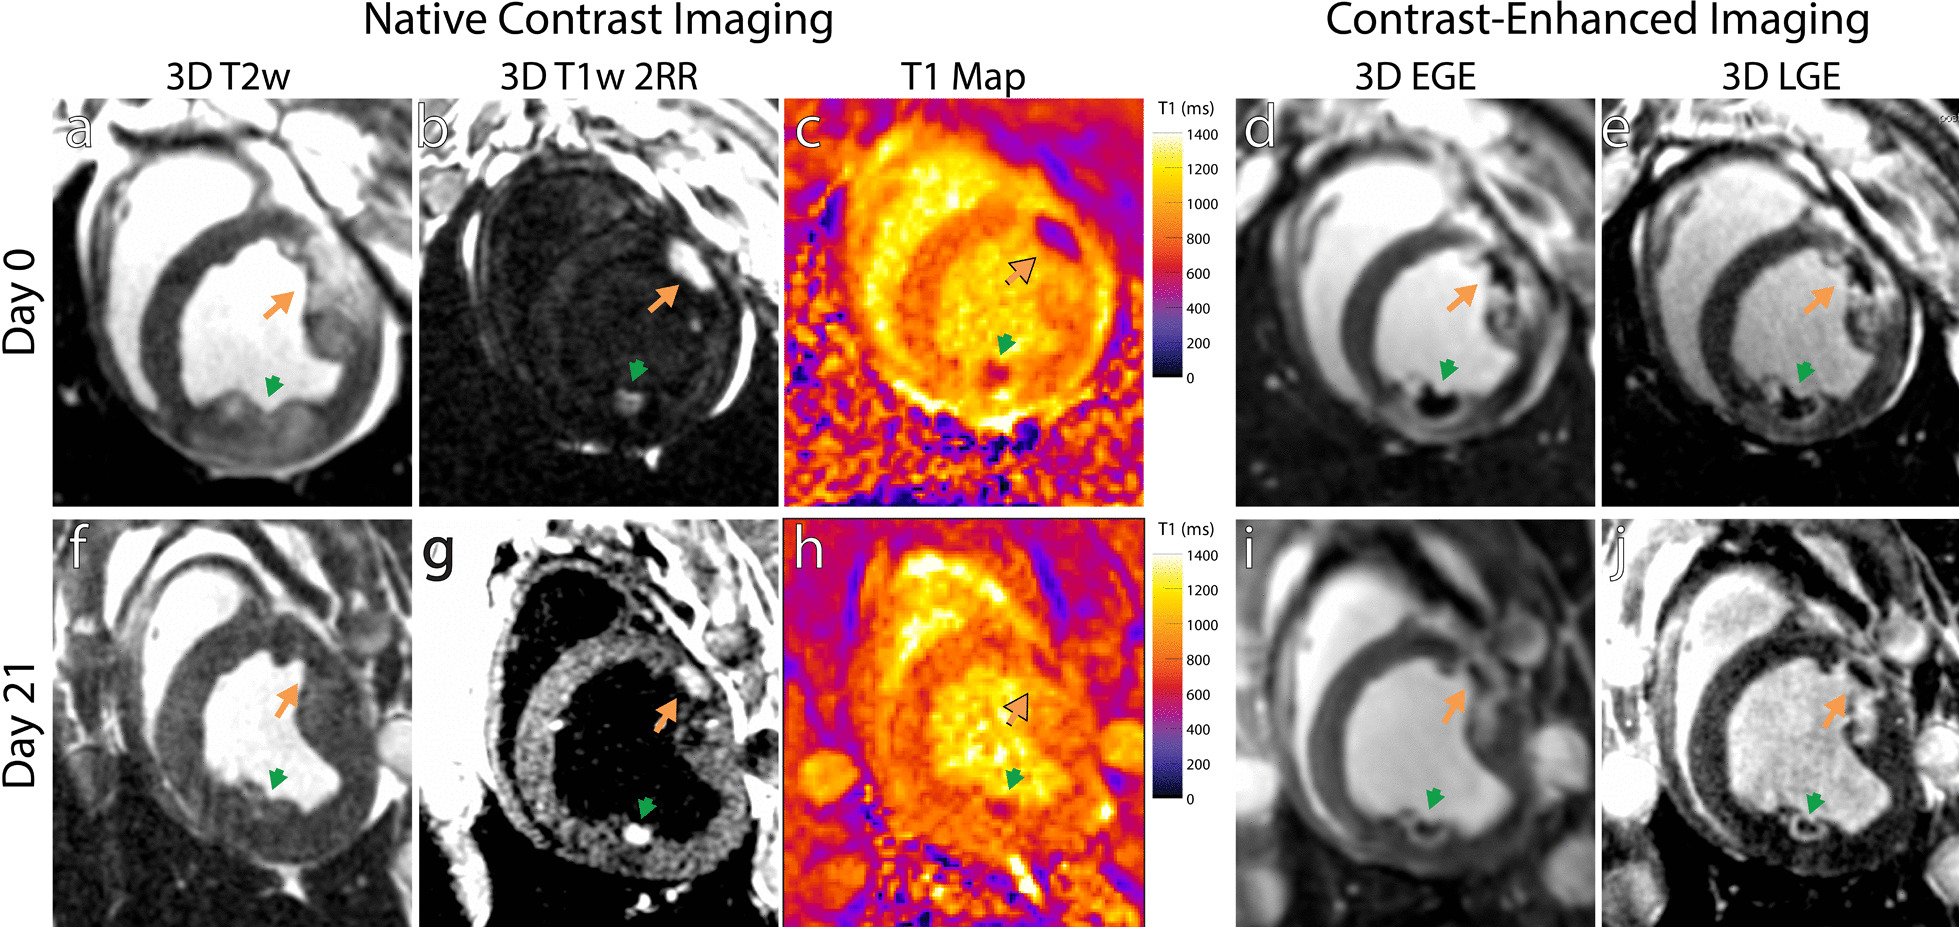
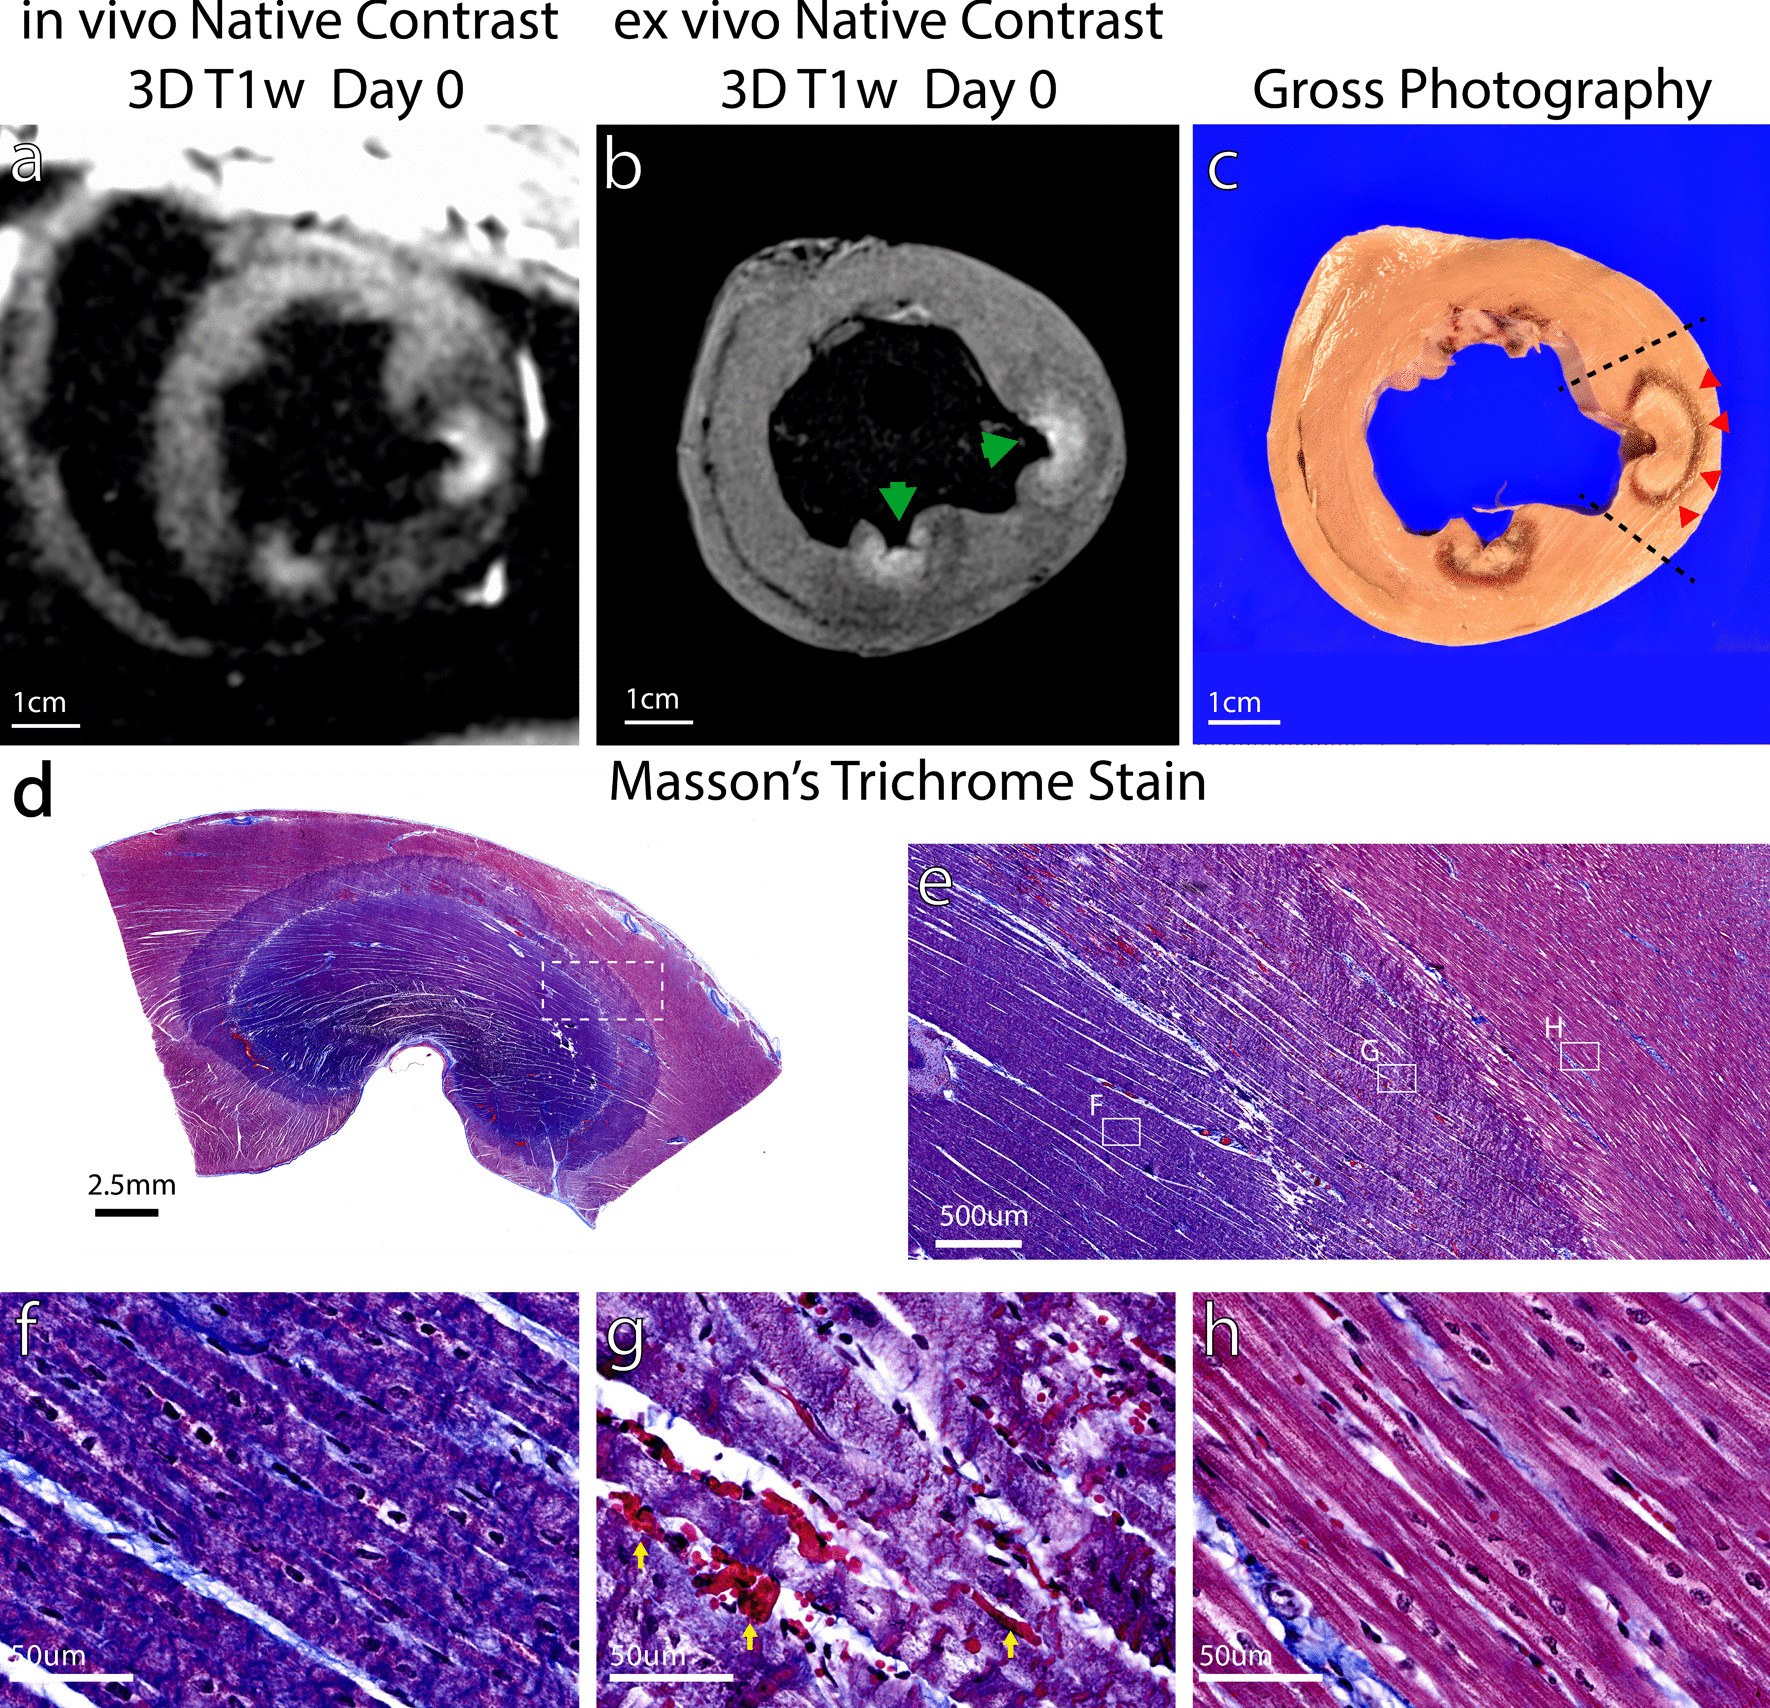
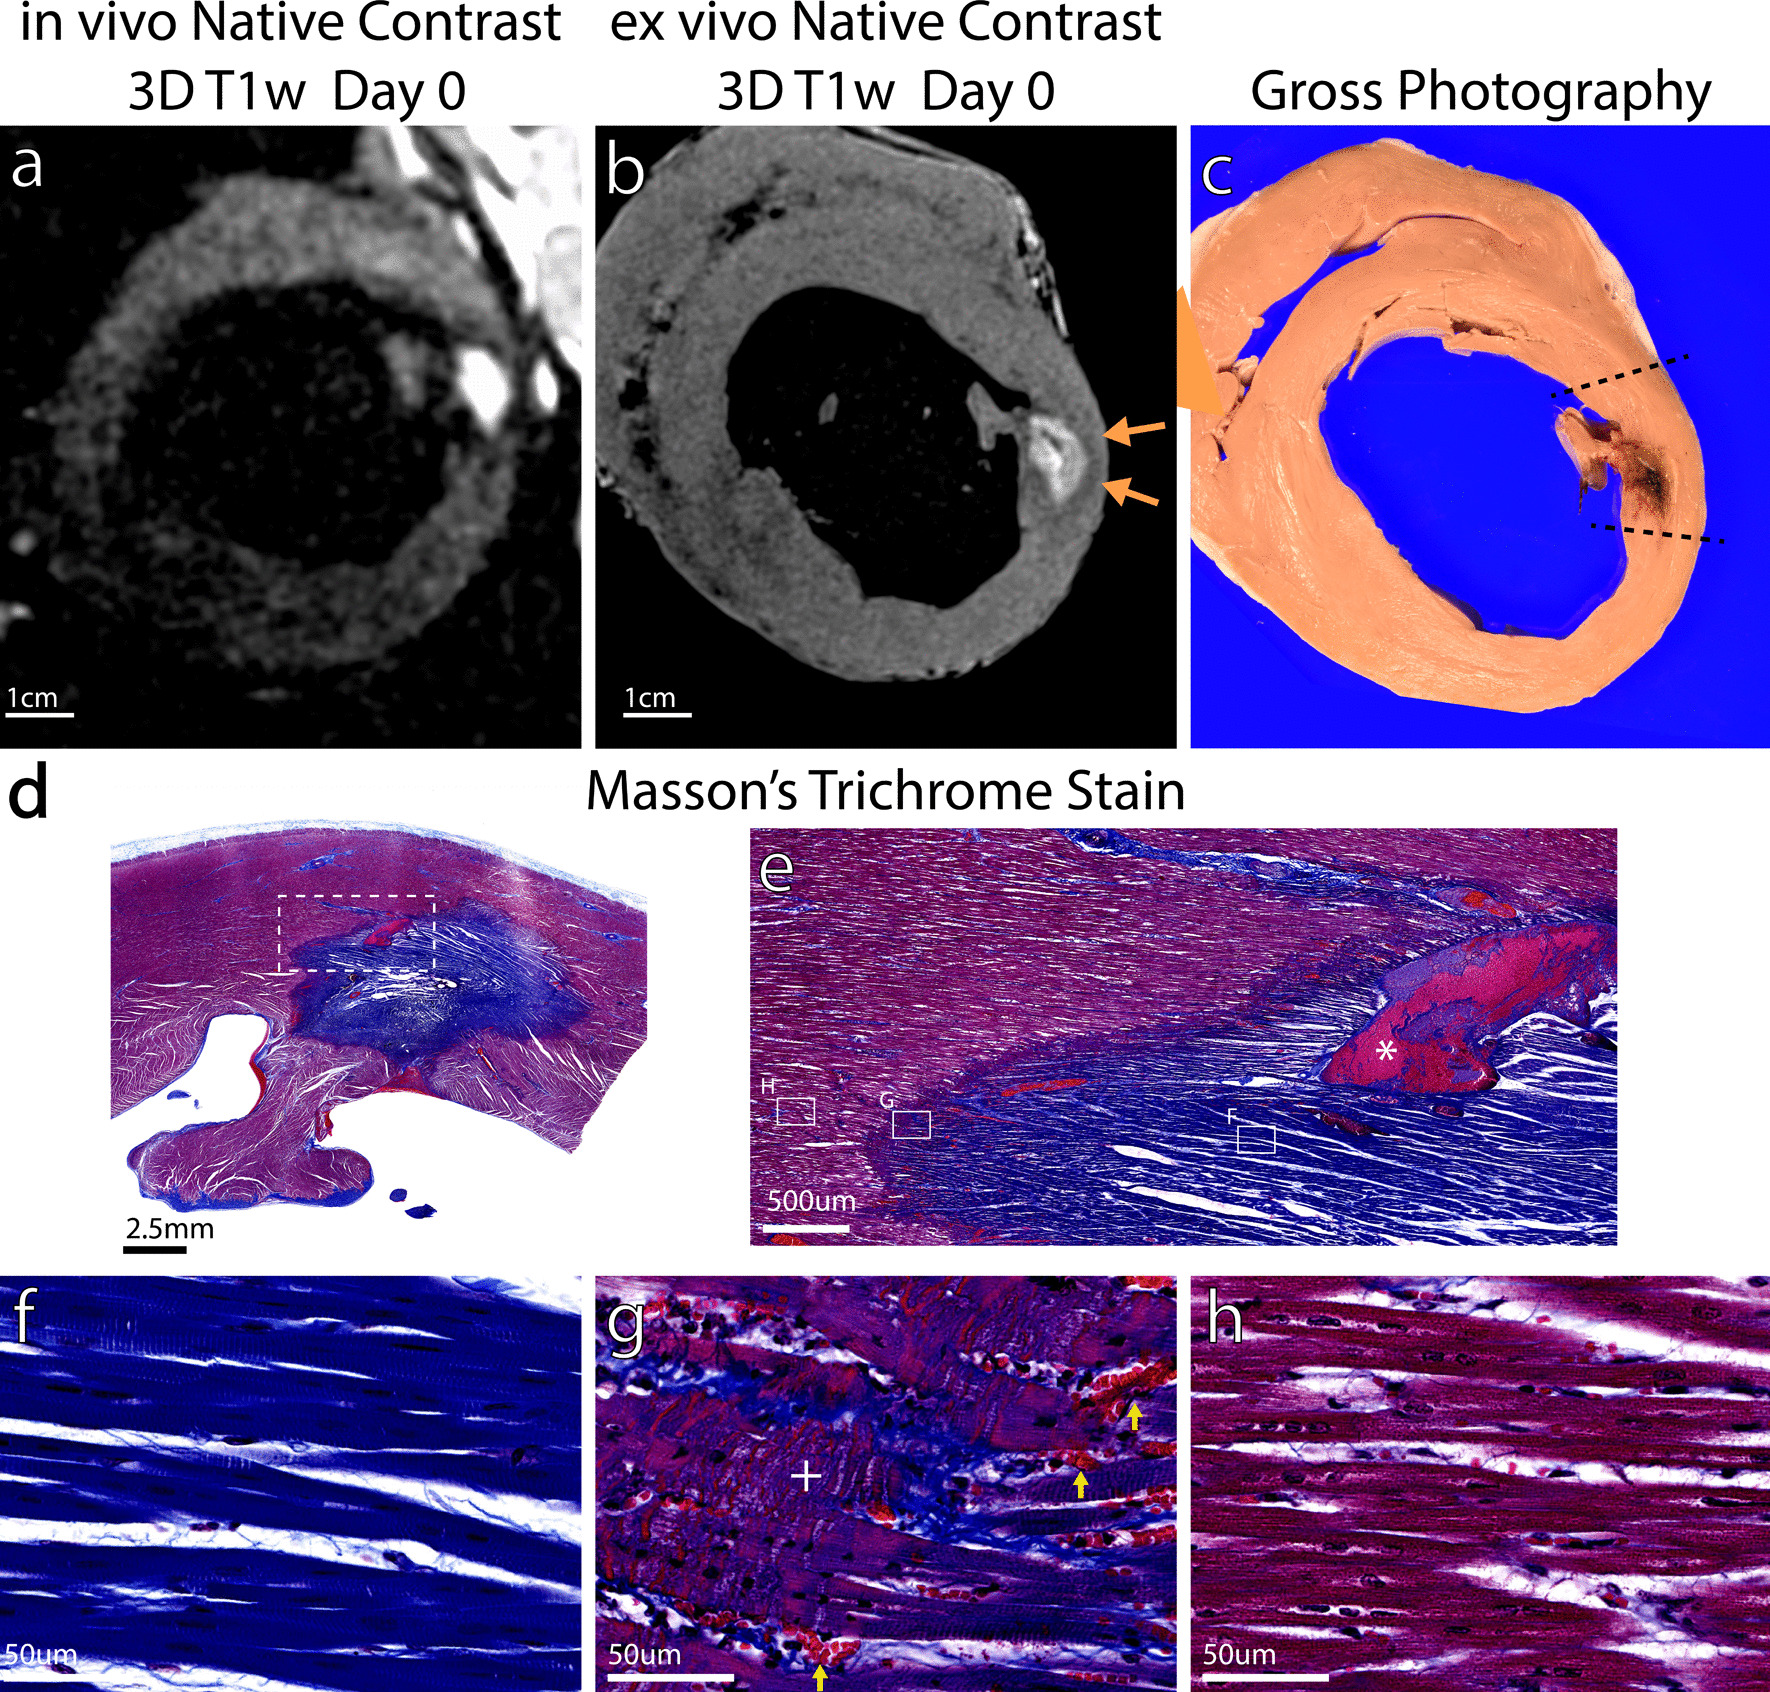
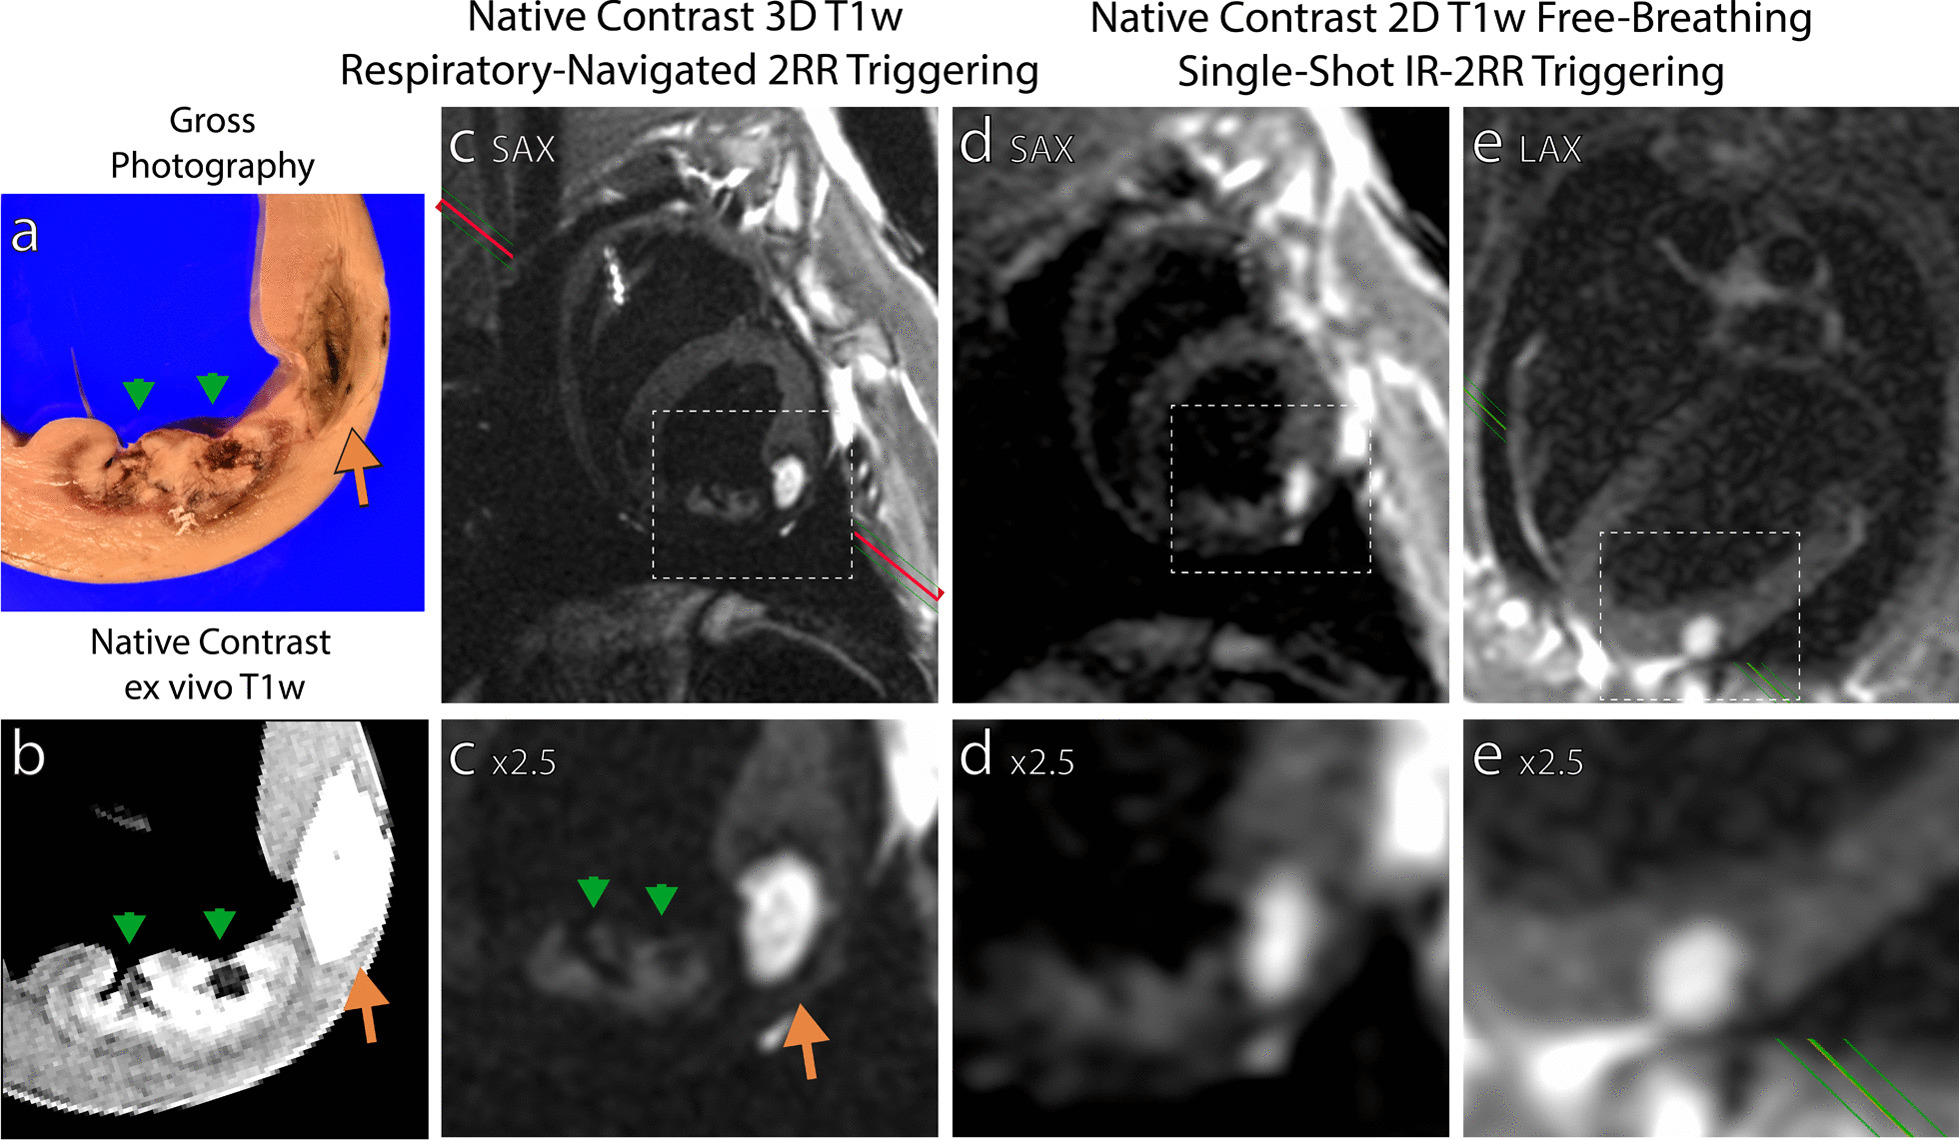
Methods: N = 10 swine underwent X-ray fluoroscopy-guided RF ablation (6-7 lesions) and acetic acid chemoablation (2-3 lesions) of the left ventricle. Animals were imaged at 0.55 T with native contrast 3D-navigator gated T1-weighted T1w) CMR for lesion visualization, gated single-shot imaging to determine potential for real-time visualization of lesion formation, and T1 mapping to measure change in T1 in response to ablation. Seven animals were euthanized on ablation day and hearts imaged ex vivo. The remaining animals were imaged again in vivo at 21 days post ablation to observe lesion evolution.

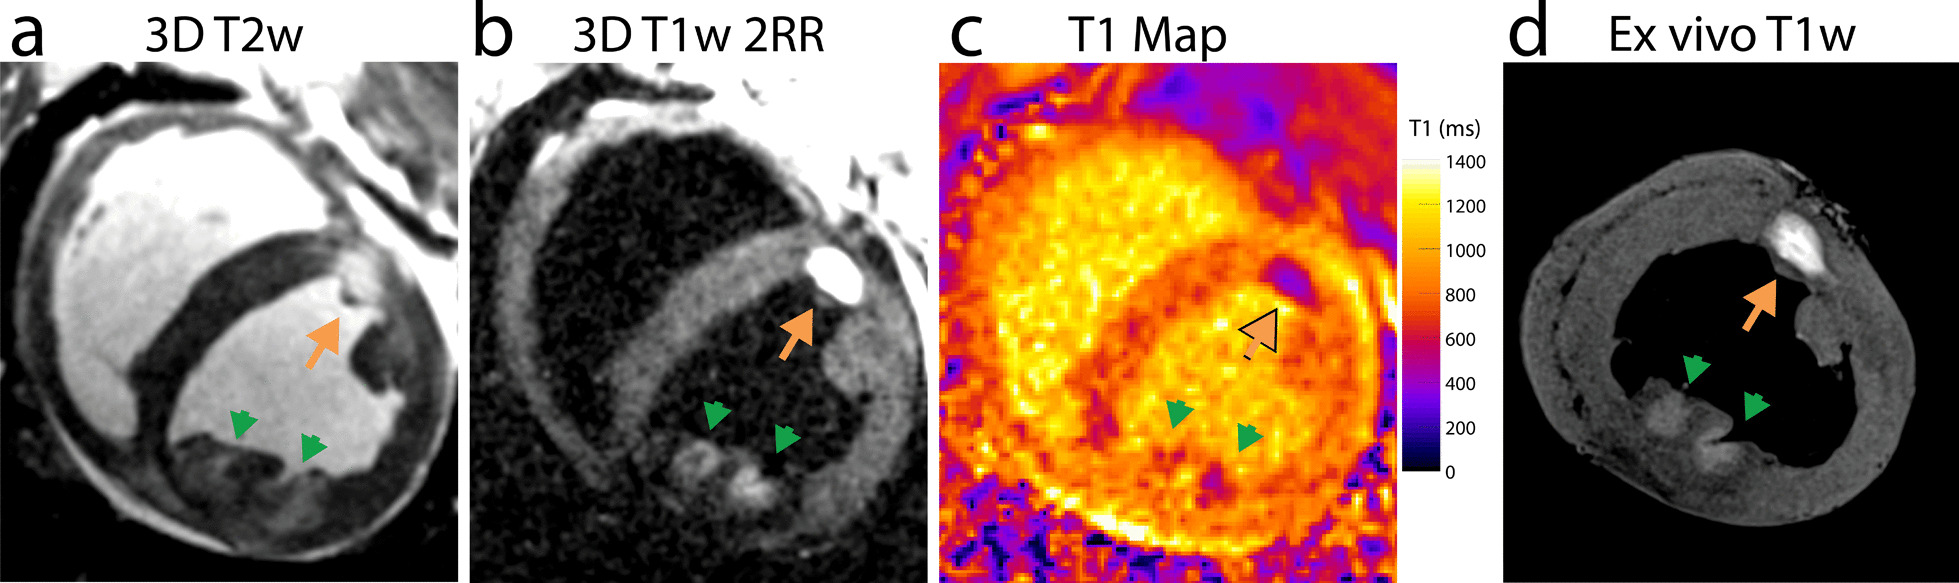
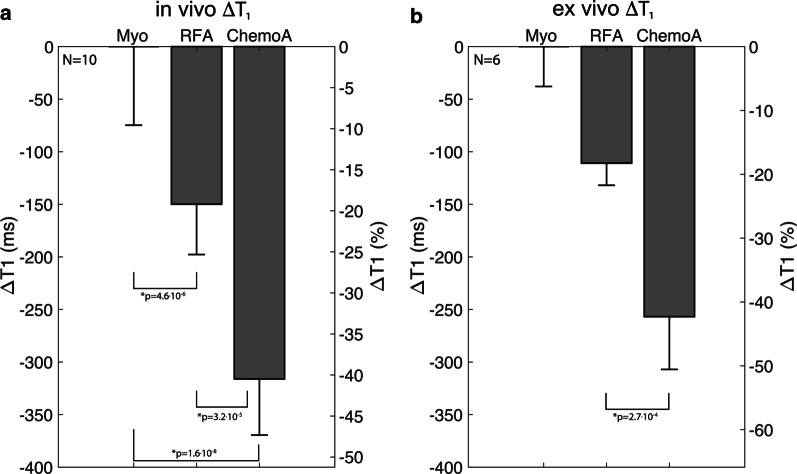
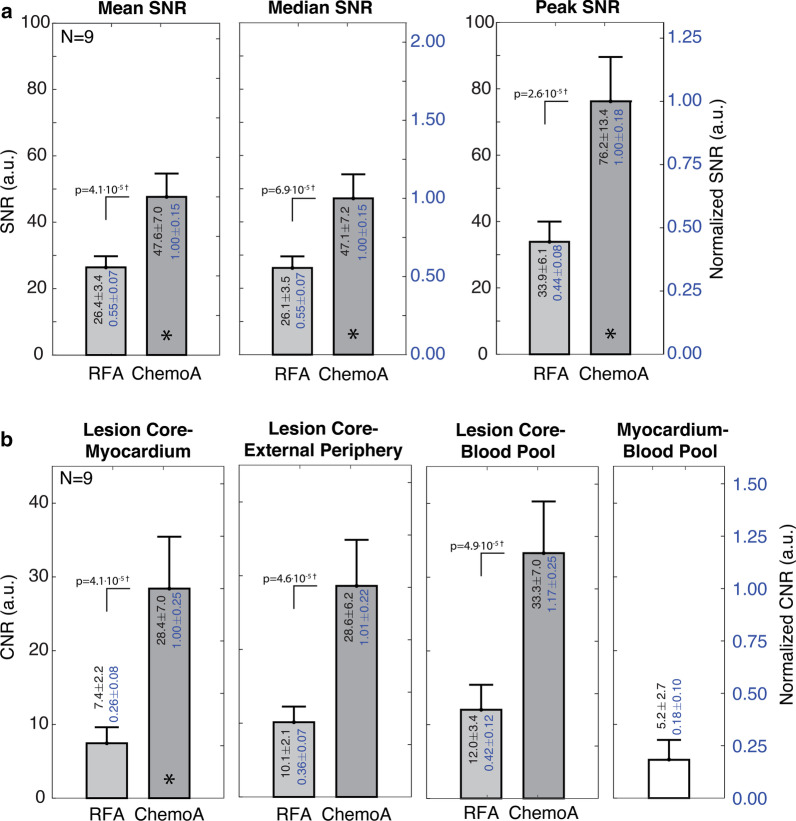
Results: Chemoablation lesions could be visualized and displayed much higher contrast than necrotic RF ablation lesions with T1w imaging. On the day of ablation, in vivo myocardial T1 dropped by 19 ± 7% in RF ablation lesion cores, and by 40 ± 7% in chemoablation lesion cores (p < 4e-5). In high resolution ex vivo imaging, with reduced partial volume effects, lesion core T1 dropped by 18 ± 3% and 42 ± 6% for RF and chemoablation, respectively. Mean, median, and peak lesion signal-to-noise ratio (SNR) were all at least 75% higher with chemoablation. Lesion core to myocardium contrast-to-noise (CNR) was 3.8 × higher for chemoablation. Correlation between in vivo and ex vivo CMR and histology indicated that the periphery of RF ablation lesions do not exhibit changes in T1 while the entire extent of chemoablation exhibits T1 changes. Correlation of T1w enhancing lesion volumes indicated in vivo estimates of lesion volume are accurate for chemoablation but underestimate extent of necrosis for RF ablation.

Conclusion: The visualization of coagulation necrosis from cardiac ablation is feasible using low-field high-performance CMR. Chemoablation produced a more pronounced change in lesion T1 than RF ablation, increasing SNR and CNR and thereby making it easier to visualize in both 3D navigator-gated and real-time CMR and more suitable for low-field imaging.

Keywords: Arrhythmias; Catheter ablation; Chemoablation; Heart; Image-guided intervention; Myocardial ablation; RF ablation; Tissue characterization.


Conflict of interest statement

The authors declare that they have no competing interests.

Figures

Fig. 1
Fig. 1
Native contrast cardiovascular magnetic resonance (CMR) of radiofrequency (RF) ablation (green arrows) and chemoablation (orange arrows) in the left ventricle on the day of ablation. a The boundary of T2 weighted (T2w) enhancement (edema) at sites of ablation is more diffuse than the more discrete lesion borders visualized by (b) T1 weighted (T1w) imaging. c T1 mapping shows a lower T1 for chemoablation lesion cores compared to RF ablation, corresponding to the greater degree of enhancement noted on T1w imaging. d Ex vivo native contrast T1w imaging showed the same lesion extent and relative enhancement as in vivo T1w imaging. Overall, both RF and chemoablation lesions were well visualized on the day of ablation
Fig. 2
Fig. 2
Time course of ablation lesion appearance from acutely after ablation (Day 0, top row) to Day 21 after ablation (bottom row) for native contrast imaging (three leftmost columns) and gadolinium-based contrast enhanced imaging (two rightmost columns) of RF ablation lesions (green arrows) and chemoablation lesions (orange arrows). a, f Edema, as imaged by T2w enhancement, around areas of ablation on Day 0 is no longer seen by Day 21. b, g T1w enhancement seen on Day 0 can still be seen on Day 21. c, h However, T1 maps show a reduced magnitude of T1 decrease on day 21 compared to day 1. Early gadolinium enhanced (EGE) imaging (d, i) and late-gadolinium enhanced (LGE) imaging (e, g) show a hypo-enhancing lesion core and an enhancing lesion periphery. The peripheral area of enhancement diminished by Day 21 compared to Day 0, corresponding to reduction of edema by T2w imaging. Both RF ablation and chemoablation demonstrate scar observed on Day 21 post ablation
Fig. 3
Fig. 3
In vivo and ex vivo change in T1 relaxation time for RF and chemoablation lesion cores relative to myocardial T1 as measured on Day 0. T1 measured in vivo a demonstrates an average drop of 149 ± 49 ms (19 ± 7%) in RF ablation lesion cores and 316 ± 53 ms (40 ± 7%) for chemoablation lesions cores relative to normal myocardium. T1 measured ex vivo b demonstrates an average drop of 110 ± 21 ms (18 ± 3%) in RF ablation lesion cores and 257 ± 50 ms (42 ± 6%) for chemoablation lesions cores relative to normal myocardium. All statistical comparisons indicated significant differences (Student’s t-test, paired, Bonferroni correction). Overall, chemoablation produced 2.1 × and 2.3 × greater effect in vivo and ex vivo in myocardial T1 at lesion cores, respectively
Fig. 4
Fig. 4
Comparison of chemoablation and RF ablation lesion signal-to-noise ratios (SNR, a) and contrast-to-noise ratio (CNR, b) obtained with 3D native contrast T1w imaging with 2RR triggering acutely on Day 0 after ablation. SNR values are normalized to the chemoablation SNR denoted by the asterisks. CNRs values are all normalized to the lesion core-myocardium CNR (*) to facilitate comparison across categories (right scale). Chemoablation lesion cores had significantly higher mean (× 1.8), median, and peak SNR than RF ablation lesion cores, resulting in improved lesion conspicuity. Chemoablation also demonstrated higher CNR with respect to myocardium (× 3.8), lesion external periphery (× 2.8), and the blood pool. RF ablation lesions had a hypointense rim, likely due to surrounding edema, that resulted in 38% higher lesion-periphery CNR than lesion-myocardium CNR. This difference was not noted for chemoablation, suggesting less surrounding edema for these lesions. Significant differences are denoted by † (Student’s t-test, paired, Bonferroni correction). As a reference, blood pool-myocardium CNR was 0.18 ± 0.10 indicating blood pool signal suppression through inversion-recovery worked well. Hence, chemoablation demonstrated significant improvement in SNR and CNRs
Fig. 5
Fig. 5
Correlation of native contrast T1w imaging to histology for RF ablation lesions (green arrows). a In vivo T1w imaging, b ex vivo T1w imaging with reduced partial volume effects, and c corresponding gross photography demonstrate that T1 enhancement correlates better with the pale inner core of the lesion rather than the darker outer rim of the lesion (c, red arrows). d Histology of this lesion shows the two distinct zones of necrosis indicated by shades of deeper purple trichrome staining. The dashed rectangle inset is expanded in (e) to focus on the lesion boundary. Solid rectangle insets are expanded to show the (f) inner core of coagulation necrosis, and (g) outer rim of mixed coagulation necrosis and thin outer band of contraction band necrosis as well as significant numbers of extravasated red blood cells (yellow arrows), before transitioning to (h) normal myocardium. The outer rim of RF ablation lesions (g) does not appear to result in T1-enhancement
Fig. 6
Fig. 6
Correlation of native contrast T1w imaging to histology for chemoablation (orange arrows). T1-enhancement and necrosis correlate well, making assessment of chemoablation lesion extent reliable with T1w imaging. Contrast in in vivo (a) and ex vivo (b) T1w imaging depends on reduction of T1 relaxation time. The region of T1w enhancement correlates well with the pathology lesion (c) and necrotic lesion with deeper purple trichrome stain on histology (d). Closer observation of the lesion periphery (e) reveals a core of coagulation necrosis (f) with a small transition band composed of contraction band necrosis (g, + mark) and significant number of extravasated red blood cells (g, yellow arrows) before reaching normal myocardium (h). Compared to RF ablation, for chemoablation the entire extent of necrosis observed under histology correlates better with the enhancing region on T1w imaging. The asterisk (*) in (e) marks the likely needle track with hemorrhage and coagulated red blood cells
Fig. 7
Fig. 7
Acute and chronic post-ablation imaging for evaluating long term lesion size. The enhancing boundaries for RF ablation lesions (green), and chemoablation (orange) are well visualized by (a) acute native contrast T1w imaging (Day 0), and (b) chronic late gadolinium enhancement (LGE) on Day 21. Both show excellent correspondence to ex vivo LGE (c,e,f) and trichrome stain histology (g,h) performed on Day 21. These results support the hypothesis that T1w imaging on the day of ablation describes long-term lesion size. Histology shows that encapsulation and the wavefront of healing progress inwards as collagen and scar tissue (s, light blue) replace resorbed necrosis
Fig. 8
Fig. 8
Regressions between lesion volumes measured on Day 0 in vivo and reference volumes from ex vivo measurements under ideal conditions determine whether the T1w enhancement visualized in vivo is predictive of lesion size. a Correlation of enhancing lesion volumes from in vivo T1w imaging with matching ex vivo enhancing volume indicates how well in vivo CMR can visualize lesion enhancement. b Correlation of enhancing lesion volume from in vivo T1w imaging with matching ex vivo total lesion volume demonstrates whether in vivo T1w imaging is indicative of lesion extent. c Pictorial description of thresholds used to calculate the lesion volumes from ex vivo native contrast T1w CMR. Overall, chemoablation lesions demonstrate significantly better correlations
Fig. 9
Fig. 9
Visualization of ablation lesions with single-shot native contrast imaging, suitable for monitoring lesion placement during an ablation procedure. a Gross pathology and b ex vivo imaging of two RF ablation lesions (green arrows) and one chemoablation lesion (orange arrow), c in vivo 3D navigator gated T1w imaging shows good correspondence to the lesion core regions on ex vivo assessment. The chemoablation lesion has higher contrast compared to RA ablation lesions. d,e in vivo single-shot imaging with 2-RR triggering in both short axis (SAx) and horizontal long axis (LAx) corresponds well to in vivo 3D imaging This suggests visualization of lesions immediately after and likely during formation is feasible with 2-RR triggering, particularly for higher contrast chemoablation lesions. Additional files 4 and 5: Video S1 display a time series of the images (d)

References

    1. Sapp JL, Wells GA, Parkash R, Stevenson WG, Blier L, Sarrazin JF, et al. Ventricular tachycardia ablation versus escalation of antiarrhythmic drugs. N Engl J Med. 2016;375(2):111–121. doi: 10.1056/NEJMoa1513614. - DOI - PubMed
    1. Dinov B, Fiedler L, Schonbauer R, Bollmann A, Rolf S, Piorkowski C, et al. Outcomes in catheter ablation of ventricular tachycardia in dilated nonischemic cardiomyopathy compared with ischemic cardiomyopathy: results from the Prospective Heart Centre of Leipzig VT (HELP-VT) Study. Circulation. 2014;129(7):728–736. doi: 10.1161/CIRCULATIONAHA.113.003063. - DOI - PubMed
    1. Cheung JW, Yeo I, Ip JE, Thomas G, Liu CF, Markowitz SM, et al. Outcomes, costs, and 30-day readmissions after catheter ablation of myocardial infarct-associated ventricular tachycardia in the real world: nationwide readmissions database 2010 to 2015. Circ Arrhythm Electrophysiol. 2018;11(11):e006754. doi: 10.1161/CIRCEP.118.006754. - DOI - PubMed
    1. Ashikaga H, Sasano T, Dong J, Zviman MM, Evers R, Hopenfeld B, et al. Magnetic resonance-based anatomical analysis of scar-related ventricular tachycardia: implications for catheter ablation. Circ Res. 2007;101(9):939–947. doi: 10.1161/CIRCRESAHA.107.158980. - DOI - PMC - PubMed
    1. Bogun FM, Desjardins B, Good E, Gupta S, Crawford T, Oral H, et al. Delayed-enhanced magnetic resonance imaging in nonischemic cardiomyopathy: utility for identifying the ventricular arrhythmia substrate. J Am Coll Cardiol. 2009;53(13):1138–1145. doi: 10.1016/j.jacc.2008.11.052. - DOI - PMC - PubMed

Publication types

LinkOut - more resources