. 2021 May 5;7(19):eabe5163.
doi: 10.1126/sciadv.abe5163. Print 2021 May.

Respiratory capacity is twice as important as temperature in explaining patterns of metabolic rate across the vertebrate tree of life

Affiliations

Respiratory capacity is twice as important as temperature in explaining patterns of metabolic rate across the vertebrate tree of life

Jennifer S Bigman et al. Sci Adv. .

Abstract

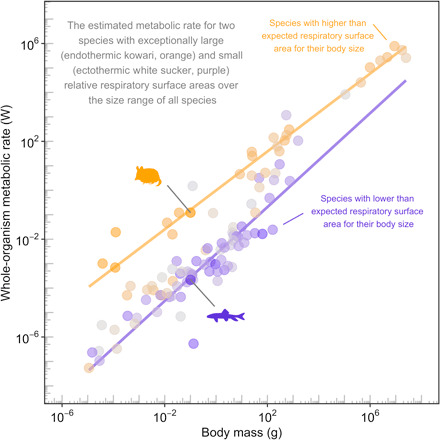
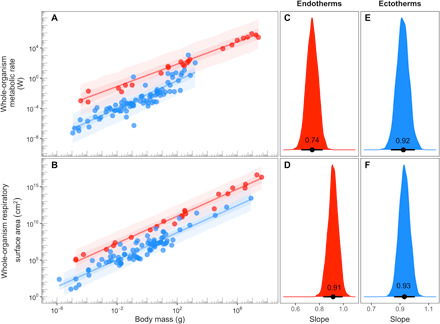
Metabolic rate underlies a wide range of phenomena from cellular dynamics to ecosystem structure and function. Models seeking to statistically explain variation in metabolic rate across vertebrates are largely based on body size and temperature. Unexpectedly, these models overlook variation in the size of gills and lungs that acquire the oxygen needed to fuel aerobic processes. Here, we assess the importance of respiratory surface area in explaining patterns of metabolic rate across the vertebrate tree of life using a novel phylogenetic Bayesian multilevel modeling framework coupled with a species-paired dataset of metabolic rate and respiratory surface area. We reveal that respiratory surface area explains twice as much variation in metabolic rate, compared to temperature, across the vertebrate tree of life. Understanding the combination of oxygen acquisition and transport provides opportunity to understand the evolutionary history of metabolic rate and improve models that quantify the impacts of climate change.


Figures

Fig. 1
Fig. 1. Metabolic rate and respiratory surface area were measured at different body masses for most of the 109 vertebrate species included in this study—A common issue with macroecological studies.
(A) The absolute percentage difference between body mass for mean (whole-organism) metabolic rate and mean (whole-organism) respiratory surface area for all species included in this study. Only three species had equal body masses associated with both metabolic rate and respiratory surface area (red data points). The difference between the log mean body mass associated with mean metabolic rate (dark orange) and the log mean body mass associated with mean respiratory surface area (dark blue) for each species when (B) the body mass associated with metabolic rate was larger and when (C) body mass associated with respiratory surface area was larger. For approximately one-third of species, the mean body mass associated with metabolic rate and respiratory surface area differed by over an order of magnitude (species above the gray line from A to C). Species code (y axis) corresponds to species identity in table S8.
Fig. 2
Fig. 2. Species with high metabolic rates for their body size have large respiratory surface areas for their body size.
Mean (whole-organism) metabolic rate in relation to mean body mass for 109 vertebrate species from all major lineages. Relative respiratory surface area (i.e., residual respiratory surface area) is indicated by a gradient of color, with orange indicating species with higher than expected respiratory surface area for their body size, gray indicating expected respiratory surface area for their body size, and purple indicating lower than expected respiratory surface area for their body size. Lines show the estimated metabolic rate (including the effect of body mass, temperature, thermoregulatory strategy, respiratory surface area, and evolutionary history) for species with exceptionally large and small relative respiratory surface areas, based on two species with almost identical body mass: the kowari D. byrnei (orange) and the white sucker C. commersonii (purple).
Fig. 3
Fig. 3. Compared to temperature, respiratory surface area explains twice as much variation in metabolic rate across the vertebrate tree of life.
The mean (gray dot) and 95% BCI (black line) of the standardized effect sizes for body mass (for both endotherms and ectotherms), relative respiratory surface area (i.e., residual respiratory surface area), and temperature (model C5; table S4). For comparison, the standardized effect size of temperature is presented as the absolute value because temperature was modeled as the inverse temperature (see text) and thus had a negative effect size. The z score standardization was used to estimate standardized effect sizes.
Fig. 4
Fig. 4. The body mass scaling of metabolic rate and respiratory surface across the same 109 vertebrate species differed for endotherms but was similar for ectotherms.
While (whole-organism) metabolic rate body mass scaling exponents (i.e., allometric slopes) differed between endotherms and ectotherms (A, C, and E, model MR3), the (whole-organism) respiratory surface area body mass scaling exponents did not (B, D, and F, model RSA3). (C to F) The posterior distributions of the metabolic rate (C and E) and respiratory surface area (D and F) body mass scaling exponents for endotherms and ectotherms, respectively. The black dot and line in each of the posterior distributions indicates the mean body mass scaling exponent and 95% BCI, respectively. Lines are shown from the model that allowed body mass scaling exponents (i.e., slopes) to vary by thermoregulatory strategy (model RSA3; table S1). We note that these body mass scaling exponents are nearly identical to that from the best model that explains variation in respiratory surface area (RSA2; table S1), which did not allow for slopes to vary by thermoregulatory strategy.

References

    1. Brown J. H., Gillooly J. F., Allen A. P., Savage V. M., West G. B., Toward a metabolic theory of ecology. Ecology 85, 1771–1789 (2004).
    1. Gillooly J. F., Brown J. H., West G. B., Savage V. M., Charnov E. L., Effects of size and temperature on metabolic rate. Science 293, 2248–2251 (2001). - PubMed
    1. O’Connor M. P., Kemp S. J., Agosta S. J., Hansen F., Sieg A. E., Wallace B. P., McNair J. N., Dunham A. E., Reconsidering the mechanistic basis of the metabolic theory of ecology. Oikos 116, 1058–1072 (2007).
    1. Munch S. B., Salinas S., Latitudinal variation in lifespan within species is explained by the metabolic theory of ecology. Proc. Natl. Acad. Sci. U.S.A. 106, 13860–13864 (2009). - PMC - PubMed
    1. Barneche D. R., Kulbicki M., Floeter S. R., Friedlander A. M., Maina J., Allen A. P., Scaling metabolism from individuals to reef-fish communities at broad spatial scales. Ecol. Lett. 17, 1067–1076 (2014). - PubMed

Publication types