. 2021 May 5;6(3):e01238-20.
doi: 10.1128/mSphere.01238-20.

Clearance of Clostridioides difficile Colonization Is Associated with Antibiotic-Specific Bacterial Changes

Affiliations

Clearance of Clostridioides difficile Colonization Is Associated with Antibiotic-Specific Bacterial Changes

Nicholas A Lesniak et al. mSphere. .

Abstract

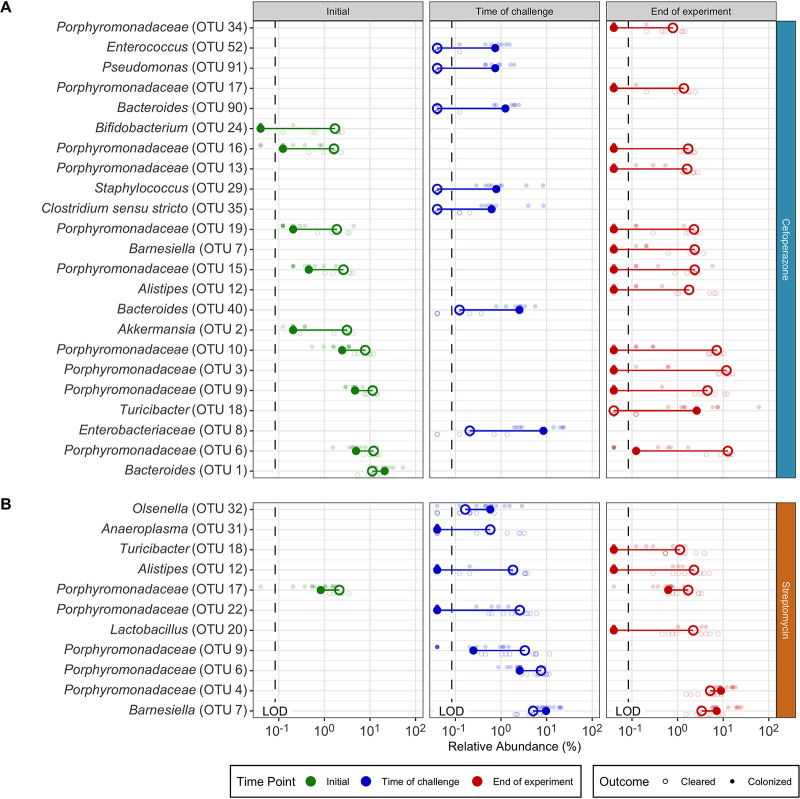
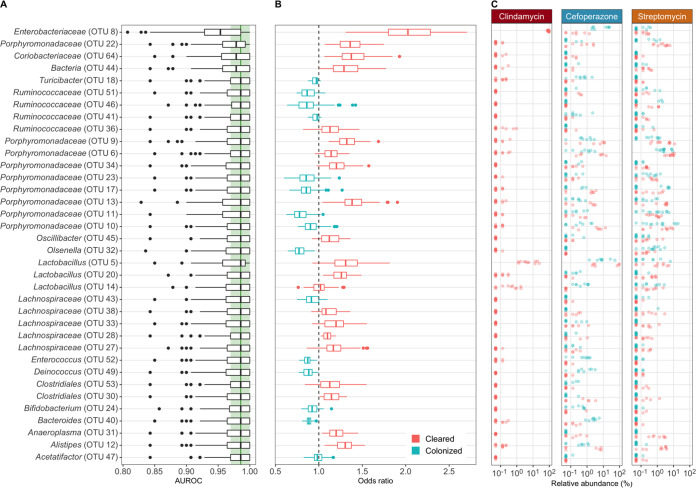
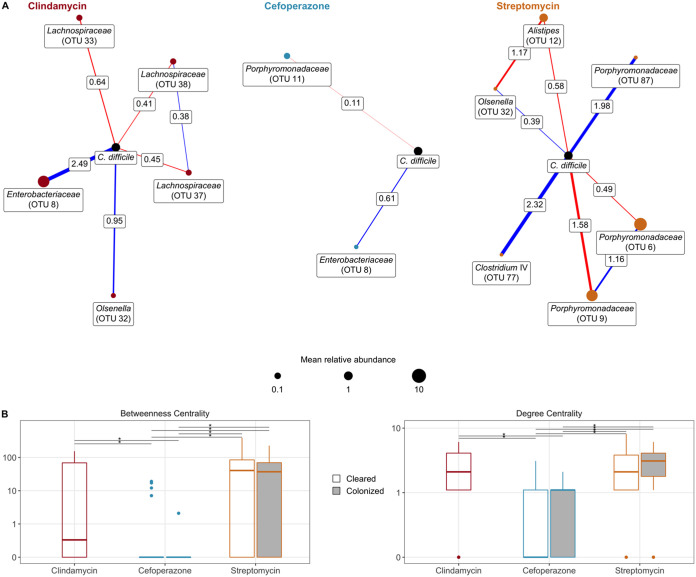
The gut bacterial community prevents many pathogens from colonizing the intestine. Previous studies have associated specific bacteria with clearing Clostridioides difficile colonization across different community perturbations. However, those bacteria alone have been unable to clear C. difficile colonization. To elucidate the changes necessary to clear colonization, we compared differences in bacterial abundance between communities able and unable to clear C. difficile colonization. We treated mice with titrated doses of antibiotics prior to C. difficile challenge, resulting in no colonization, colonization and clearance, or persistent colonization. Previously, we observed that clindamycin-treated mice were susceptible to colonization but spontaneously cleared C. difficile Therefore, we investigated whether other antibiotics would show the same result. We found that reduced doses of cefoperazone and streptomycin permitted colonization and clearance of C. difficile Mice that cleared colonization had antibiotic-specific community changes and predicted interactions with C. difficile Clindamycin treatment led to a bloom in populations related to Enterobacteriaceae Clearance of C. difficile was concurrent with the reduction of those blooming populations and the restoration of community members related to the Porphyromonadaceae and Bacteroides Cefoperazone created a susceptible community characterized by drastic reductions in the community diversity and interactions and a sustained increase in the abundance of many facultative anaerobes. Lastly, clearance in streptomycin-treated mice was associated with the recovery of multiple members of the Porphyromonadaceae, with little overlap in the specific Porphyromonadaceae observed in the clindamycin treatment. Further elucidation of how C. difficile colonization is cleared from different gut bacterial communities will improve C. difficile infection treatments.IMPORTANCE The community of microorganisms, or microbiota, in our intestines prevents pathogens like C. difficile from colonizing and causing infection. However, antibiotics can disturb the gut microbiota, which allows C. difficile to colonize. C. difficile infections (CDI) are primarily treated with antibiotics, which frequently leads to recurrent infections because the microbiota has not yet returned to a resistant state. The recurrent infection cycle often ends when the fecal microbiota from a presumed resistant person is transplanted into the susceptible person. Although this treatment is highly effective, we do not understand the mechanism. We hope to improve the treatment of CDI through elucidating how the bacterial community eliminates CDI. We found that C. difficile colonized susceptible mice but was spontaneously eliminated in an antibiotic treatment-specific manner. These data indicate that each community had different requirements for clearing colonization. Understanding how different communities clear colonization will reveal targets to improve CDI treatments.

Keywords: 16S rRNA gene; Clostridioides difficile; Clostridium difficile; colonization resistance; dynamics; microbial ecology; microbiome; microbiota.


Figures

FIG 1
FIG 1
Reduced antibiotic doses permitted murine communities to be colonized by C. difficile and to spontaneously clear the C. difficile colonization. (A to C) Daily CFU counts of C. difficile in fecal samples of mice treated with clindamycin, cefoperazone, or streptomycin from time of challenge (day 0) with 103 C. difficile strain 630Δerm spores through 10 days postinfection (dpi). The bold lines are the median CFU counts of the groups, and the light lines are the data for individual mice. (D to F) Relative abundances of the 12 most abundant taxonomic groups at the time of C. difficile challenge, labeled with the lowest level of classification, and all other taxonomic groups, which are combined into Other. Each column represents the data for an individual mouse. Clindamycin: 10 mg/kg, n = 11. Cefoperazone: 0.5 mg/ml, n = 6; 0.3 mg/ml, n = 13; 0.1 mg/ml, n = 6. Streptomycin: 5.0 mg/ml, n = 8; 0.5 mg/ml, n = 9; 0.1 mg/ml, n = 11. LOD, limit of detection.
FIG 2
FIG 2
Microbiota community diversity showed antibiotic-specific trends associated with C. difficile colonization clearance. For communities colonized with C. difficile from mice treated with clindamycin (A), cefoperazone (B), and streptomycin (C), microbiota α-diversity (Sobs and inverse Simpson) and β-diversity (θYC) were compared at the initial pre-antibiotic treatment state, time of C. difficile challenge (TOC), and end of the experiment. β-Diversity (θYC) was compared between the initial pre-antibiotic treatment community and all other initial pre-antibiotic treatment communities treated with the same antibiotic, the initial community and the same community at the time of C. difficile challenge, and the initial community and the same community at end of the experiment. (clindamycin, n = 11 cleared; cefoperazone, n = 7 cleared, n = 9 colonized; streptomycin, n = 9 cleared, n = 11 colonized). *, P < 0.05, calculated by Wilcoxon rank sum test with Benjamini-Hochberg correction.
FIG 3
FIG 3
Each antibiotic had specific sets of temporal changes in OTU abundances associated with C. difficile colonization and clearance. For clindamycin (A), cefoperazone (C), and streptomycin (B, D), the differences in the relative abundances of OTUs that were significantly different between time points within each C. difficile colonization outcome (cleared, unfilled points [A, B] or colonized, filled points [C, D]) for each antibiotic treatment were identified. Dark larger points in foreground represent median relative abundances, and light smaller points in background represent relative abundances for individual mice. Lines connect points within each comparison to show differences in median values. Arrows point in the direction of the temporal change of the relative abundance. Only OTUs at time points with statistically significant differences (P < 0.05) were plotted (calculated by Wilcoxon rank sum test with Benjamini-Hochberg correction). Bold OTUs were shared across outcomes. LOD, limit of detection; TOC, time of challenge.
FIG 4
FIG 4
OTU abundance differences between communities that cleared C. difficile colonization and those that remained colonized are unique to each treatment. For cefoperazone (A) and streptomycin (B), the differences in the relative abundances of OTUs that were significantly different between communities that eliminated C. difficile colonization and those that remained colonized within each antibiotic treatment for each time point were identified. Dark larger points in foreground represent median relative abundances, and light smaller points in background represent relative abundances for individual mice. Lines connect points within each comparison to show differences in median values. Only OTUs at time points with statistically significant differences (P < 0.05) were plotted (calculated by Wilcoxon rank sum test with Benjamini-Hochberg correction). LOD, limit of detection.
FIG 5
FIG 5
Distinct features of the bacterial community at the time of infection can classify endpoint colonization. (A) L2 logistic regression model features’ importance determined by the decrease in model performance when randomizing an individual feature. All OTUs affecting performance are shown. Light green band in the background shows the interquartile range, and dark green line shows the median AUROC of the final model with all features included. (B) Distribution of odds ratios used in L2 logistic regression model. Values above 1 indicate that the abundance predicted the community would clear C. difficile colonization (red), and values below 1 indicate that the abundance predicted C. difficile would remain colonized (blue). Feature labels and boxplots are colored to match the median odds ratios. (C) Relative abundance differences in features used by L2 logistic regression model are displayed by antibiotic treatment.
FIG 6
FIG 6
Conditional independence networks reveal treatment-specific relationships between the community and C. difficile during colonization clearance. (A) Sparse inverse covariance estimation for ecological association inference (SPIEC-EASI) networks showing conditionally independent first-order relationships between C. difficile and the community as C. difficile was cleared from the gut environment. Nodes are sized by the median relative abundance of the OTU. A red edge indicates a negative interaction, and blue indicates a positive interaction, while edge thickness indicates the interaction’s strength. (B) Network centrality measured with betweenness, i.e., how many paths between two OTUs pass through an individual, and degree, i.e., how many connections an OTU has. *, P < 0.05, calculated by Wilcoxon rank sum test with Benjamini-Hochberg correction.

References

    1. Ducarmon QR, Zwittink RD, Hornung BVH, van Schaik W, Young VB, Kuijper EJ. 2019. Gut microbiota and colonization resistance against bacterial enteric infection. Microbiol Mol Biol Rev 83:e00007-19. doi:10.1128/MMBR.00007-19. - DOI - PMC - PubMed
    1. Britton RA, Young VB. 2012. Interaction between the intestinal microbiota and host in Clostridium difficile colonization resistance. Trends Microbiol 20:313–319. doi:10.1016/j.tim.2012.04.001. - DOI - PMC - PubMed
    1. Lessa FC, Mu Y, Bamberg WM, Beldavs ZG, Dumyati GK, Dunn JR, Farley MM, Holzbauer SM, Meek JI, Phipps EC, Wilson LE, Winston LG, Cohen JA, Limbago BM, Fridkin SK, Gerding DN, McDonald LC. 2015. Burden of Clostridium difficile infection in the United States. N Engl J Med 372:825–834. doi:10.1056/NEJMoa1408913. - DOI - PMC - PubMed
    1. Zimlichman E, Henderson D, Tamir O, Franz C, Song P, Yamin CK, Keohane C, Denham CR, Bates DW. 2013. Health care-associated infections. JAMA Intern Med 173:2039. doi:10.1001/jamainternmed.2013.9763. - DOI - PubMed
    1. Spigaglia P, Barbanti F, Morandi M, Moro ML, Mastrantonio P. 2016. Diagnostic testing for Clostridium difficile in Italian microbiological laboratories. Anaerobe 37:29–33. doi:10.1016/j.anaerobe.2015.11.002. - DOI - PubMed

Publication types

MeSH terms

LinkOut - more resources