. 2021 May 5;13(592):eaba6480.
doi: 10.1126/scitranslmed.aba6480.

iPSC-endothelial cell phenotypic drug screening and in silico analyses identify tyrphostin-AG1296 for pulmonary arterial hypertension

Affiliations

iPSC-endothelial cell phenotypic drug screening and in silico analyses identify tyrphostin-AG1296 for pulmonary arterial hypertension

Mingxia Gu et al. Sci Transl Med. .

Abstract

Pulmonary arterial hypertension (PAH) is a progressive disorder leading to occlusive vascular remodeling. Current PAH therapies improve quality of life but do not reverse structural abnormalities in the pulmonary vasculature. Here, we used high-throughput drug screening combined with in silico analyses of existing transcriptomic datasets to identify a promising lead compound to reverse PAH. Induced pluripotent stem cell-derived endothelial cells generated from six patients with PAH were exposed to 4500 compounds and assayed for improved cell survival after serum withdrawal using a chemiluminescent caspase assay. Subsequent validation of caspase activity and improved angiogenesis combined with data analyses using the Gene Expression Omnibus and Library of Integrated Network-Based Cellular Signatures databases revealed that the lead compound AG1296 was positively associated with an anti-PAH gene signature. AG1296 increased abundance of bone morphogenetic protein receptors, downstream signaling, and gene expression and suppressed PAH smooth muscle cell proliferation. AG1296 induced regression of PA neointimal lesions in lung organ culture and PA occlusive changes in the Sugen/hypoxia rat model and reduced right ventricular systolic pressure. Moreover, AG1296 improved vascular function and BMPR2 signaling and showed better correlation with the anti-PAH gene signature than other tyrosine kinase inhibitors. Specifically, AG1296 up-regulated small mothers against decapentaplegic (SMAD) 1/5 coactivators, cAMP response element-binding protein 3 (CREB3), and CREB5: CREB3 induced inhibitor of DNA binding 1 and downstream genes that improved vascular function. Thus, drug discovery for PAH can be accelerated by combining phenotypic screening with in silico analyses of publicly available datasets.


Conflict of interest statement

Competing interests: The authors declare no competing interests.

Figures

Fig. 1.
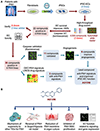
Fig. 1.. Schema showing combined phenotype drug screen and bioinformatics to identify and validate AG1296 for pulmonary arterial hypertension (PAH).
(A) Six PAH induced pluripotent stem cell (iPSC)-endothelial cell (EC) lines were generated for the phenotypic drug screen. 4,500 bioactive compounds were tested for their ability to improve cell survival by more than 50% following serum withdrawal, using a luminescence assay measuring caspase 3/7 activity, an indicator of apoptosis. Compounds that reduced caspase activity but showed EC-specific toxicity were excluded. Twenty drugs were further selected based on (i) caspase validation using CellEvent Caspase-3/7 Green fluorescence dye, and improved tube formation in an angiogenesis assay; and (ii) Lead Compound selection based also on bioinformatic analysis of the correlation of drug signature based on the Library of Integrated Network-Based Cellular Signatures (LINCS) database, and PAH anti-signature generated by comparison of gene expression profiles of PAH vs. healthy control lung tissue. (B) Molecular structure of the lead compound, AG1296, and schematics showing validation of potential efficacy. AG1296 improved bone morphogenic protein (BMP) signaling and functions in PAH iPSC-ECs, suppressed SMC proliferation, and reversed vascular remodeling in PAH lung organ culture and animal model. AG1296 was superior to other tyrosine kinase inhibitors (TKIs) through a cAMP response element-binding protein (CREB)-dependent mechanism.
Fig. 2.
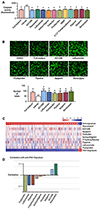
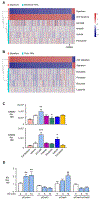
Fig. 2.. Functional and bioinformatic analysis identifies AG1296 for further study.
(A) PAH iPSC-ECs were incubated with vehicle control (DMSO), full media (positive control), or the indicated compounds (10 μM) under serum withdrawal (0.2% FBS) for 48 hours. Apoptosis was determined by the CellEvent Caspase3/7 fluorescence assay. (B) Representative images, with quantification below, of tube formation of PAH iPSC-ECs treated with 10 μM of indicated compounds in EC media with 0.2% FBS. Images show tubes formed 6 hours after seeding cells on growth factor reduced Matrigel. Scale bar = 100 μm. (C) Heatmap showing the PAH signature and anti-signature compared with the gene expression profiles of top candidate compounds that were available from the LINCS database. PAH lung signature was generated by multi-cohort analysis based on public datasets from Gene Expression Omnibus (GEO) by comparing 32 patients with PAH versus 28 healthy controls. PAH signature of 330 genes (FDR <1%, Effect size >0.6), of which 61 were up-regulated, and 269 were down-regulated vs. Control. The PAH anti-signature is the reversed gene expression pattern. (D) Pearson’s correlation coefficient between each compound’s gene signature from LINCS and the PAH anti-signature. Bars represent mean±SEM. n=6, *P < 0.05 vs. DMSO, by one-way ANOVA with Bonferroni multiple comparisons test (A and B).
Fig. 3.
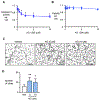
Fig. 3.. AG1296 improves EC survival and tube formation.
(A) PAH iPSC-ECs were incubated with vehicle control (DMSO) or AG1296 at six different doses under serum withdrawal (0.2% FBS) for 24 hours. Apoptosis was determined by Caspase3/7 fluorescence assay. *P < 0.05 vs. 0 μM of AG1296, one-way ANOVA with Bonferroni multiple comparisons test. (B) Cell viability was measured under the same condition as (A) using CellTiter-Glow. (C-D) Representative images of tube formation of iPSC-ECs treated with AG1296 (AG) or vehicle (DMSO, Veh) with quantitative analysis, indicating the number of tubes formed 6 hours after seeding cells on growth factor reduced Matrigel. Scale bar = 100 μm. Bars represent mean±SEM. n=6, *P < 0.05, **P < 0.01 vs. Veh, one-way ANOVA with Bonferroni multiple comparisons test.
Fig. 4.
Fig. 4.. AG1296 enhances BMPR gene expression, BMP, and VEGF signaling.
(A) PAH iPSC-ECs were treated with AG1296 (AG) or vehicle (DMSO, Veh) overnight under serum withdrawal, and gene expression of BMP receptors were quantified by real-time PCR. (B) Representative western immunoblots and quantification of pAKT and pERK activation after treatment of AG1296 under serum withdrawal condition overnight. (C) Representative western immunoblots and quantification of pSMAD1/5 and ID1 activation after treatment of AG1296 under serum withdrawal condition overnight. (D) PAH iPSC-ECs were treated with AG1296 overnight under serum withdrawal, and gene expression of APLN, BIRC3, VEGFA, and FST were quantified by real-time PCR. n=6. Bars represent mean±SEM. *P < 0.05, **P < 0.01, ***P < 0.001 vs. Veh by unpaired t-test (A and D) or one-way ANOVA with Bonferroni multiple comparisons test (B and C). (E) Heatmap displaying 195 differentially expressed genes (DEGs) commonly up- or down-regulated by AG1296 treatment on both iPSC-ECs and PAECs. FDR<0.1 and fold change>=1.5 for PAECs; FDR<0.1 and fold change >=1.2 for iPSC-ECs. Of these, 80 genes were up-regulated and 115 genes were down-regulated. Gene expression was normalized using DESeq2 variance stabilizing transformation and then calculated as the ratio between the treated and untreated samples of the same cell type from the same donor. (F) Dotplot of fold change values of the 195 common differentially expressed genes (DEGs) in iPSC-ECs (x-axis) and PAECs (y-axis). Fold change values were log2 transformed. Pink: DEGs (n=80) commonly up-regulated by AG1296 treatment in both iPSC-ECs and PAECs. Blue: DEGs (n=115) commonly downregulated. (G) Functional enrichment analysis using the Database for Annotation, Visualization and Integrated Discovery (DAVID, version 6.8). Pink bars: gene ontology biological processes (GO BPs) enriched by the up-regulated DEGs; blue bars: GO BPs enriched by the down-regulated DEGs.
Fig. 5.
Fig. 5.. AG1296 reverses vascular remodeling in lung explants of patients with PAH.
Cultured lung explants taken from four patients with PAH were treated with either vehicle (DMSO) or AG1296 for 8 days. Medium was changed daily. (A) Left: schematic diagram of PAH lung organ culture. Right: representative images of Movat-stained sections of PA from patients with PAH treated with vehicle or AG1296 at 20 μM, scale bar = 20 μm. (B) Ratios of lumen to vessel area and (C) lumen to vessel diameter, based on analysis of n=8 lung organ culture experiments. (D) Gene expression of BMP receptors, downstream ID1, and SMAD co-regulators was quantified by real-time PCR. (E) Gene expression of EC survival- and angiogenesis-related genes was quantified by real-time PCR. n=4. Bars represent mean±SEM. *P < 0.05, **P < 0.01 vs. Veh by unpaired t test (C) or one-way ANOVA with Bonferroni multiple comparisons test (D and E).
Fig. 6.
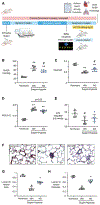
Fig. 6.. AG1296 reverses obstructed distal PAs and pulmonary hypertension (PH) in sugen/hypoxia (Su/Hx) rats.
(A) Schematic of protocol to evaluate the therapeutic efficacy of AG1296 (AG) in a rat model of PH. Sprague Dawley rats were exposed to room air (normoxia, n=4) or to the Su/Hx protocol (n=12). The Su/Hx rats were then randomly divided into two groups: DMSO vehicle (Veh), or AG treatment (n=6). (B) Right ventricular systolic pressure (RVSP) by catheter study. (C) Pulmonary Artery Acceleration Time (PAAT)/Ejection Time (ET) by echocardiography. (D) Right ventricular (RV) hypertrophy (Fulton index), weight of RV relative to the weight of the left ventricle (LV) + septum (S). (E) Cardiac output (CO) by echocardiography, normalized to body weight (BW). (F) Representative histology of distal pulmonary arteries from normoxia-, vehicle-, and AG-treated rats; scale bars = 50 μm. (G) Ratios of lumen to vessel area and (H) lumen to vessel diameter, based on analysis of 15 vessels per lung section for each group. In B, C, D, G, and H, bars represent mean±SEM, n=6, *P < 0.05 (shown in G and H), **P < 0.01 vs. Normoxia, #P < 0.05 vs. vehicle (Veh), one-way ANOVA with Bonferroni multiple comparisons test.
Fig. 7.
Fig. 7.. Comparison of AG1296 versus other TKIs in PAH iPSC-ECs.
PAH iPSC-ECs were incubated with vehicle (DMSO), AG1296, or other TKIs under serum withdrawal (0.2% FBS) for 24 hours. (A) Apoptosis was measured by Caspase3/7 fluorescence assay (doses indicated on x-axis). (B-D) Angiogenesis assays with 10 μM of compounds: (B) Representative images of tube formation in PAH iPSC-ECs treated with different TKIs (10 μM) with quantitative analysis (C, D). PAH iPSC-ECs were pretreated with vehicle or TKIs for 24 hours, and then cells were seeded on growth factor reduced Matrigel for another 6 hours under drug treatment. scale bar = 100 μm. (E) Representative western immunoblots and quantification of pAKT, pSMAD1/5, and ID1 activation under normal condition with full serum, or serum free condition or with different TKIs for 24 hours. (F) Representative western immunoblots and quantification of BMP receptors under conditions shown in (E). (G-H) Gene expression of BMP receptors and cell survival genes by real-time PCR. In A, C-H, bars represent mean±SEM, n=6, *P < 0.05, **P < 0.01, ***P < 0.001 vs. Vehicle (DMSO), #P < 0.05 vs. Full medium, &P < 0.05 vs. AG1296, one-way ANOVA with Bonferroni multiple comparisons test.
Fig. 8.
Fig. 8.. AG1296 increases CREB3 gene expression to mediate increased ID1 in PAH iPSC-ECs.
Heatmap showing the PAH signature and anti-signature, as well as gene expression profile associated with beneficial TKIs (A) or toxic TKIs (B), based on LINCS database. (C) CREB3 and CREB5 expression quantified by real-time PCR in PAH iPSC-ECs. n=3, Bars represent mean±SEM. *P < 0.05, **P < 0.01, ***P < 0.001 vs. Vehicle, one-way ANOVA with Bonferroni multiple comparisons test. (D) ID1 gene expression in PAH iPSC-ECs treated with respective CREB3 and CREB5 siRNAs for 48 h, as determined by real-time PCR. n=3, Bars represent mean±SEM. **P < 0.01 vs. siControl with Vehicle (DMSO; 0 μM AG), #P < 0.05 vs. siCREB5 with Vehicle, one-way ANOVA with Bonferroni multiple comparisons test.

References

    1. Rabinovitch M, Molecular pathogenesis of pulmonary arterial hypertension. J Clin Invest 118, 2372–2379 (2008). - PMC - PubMed
    1. Diebold I, Hennigs JK, Miyagawa K, Li CG, Nickel NP, Kaschwich M, Cao A, Wang L, Reddy S, Chen PI, Nakahira K, Alcazar MA, Hopper RK, Ji L, Feldman BJ, Rabinovitch M, BMPR2 preserves mitochondrial function and DNA during reoxygenation to promote endothelial cell survival and reverse pulmonary hypertension. Cell Metab 21, 596–608 (2015). - PMC - PubMed
    1. Rhodes CJ, Im H, Cao A, Hennigs JK, Wang L, Sa S, Chen PI, Nickel NP, Miyagawa K, Hopper RK, Tojais NF, Li CG, Gu M, Spiekerkoetter E, Xian Z, Chen R, Zhao M, Kaschwich M, Del Rosario PA, Bernstein D, Zamanian RT, Wu JC, Snyder MP, Rabinovitch M, RNA Sequencing Analysis Detection of a Novel Pathway of Endothelial Dysfunction in Pulmonary Arterial Hypertension. American journal of respiratory and critical care medicine 192, 356–366 (2015). - PMC - PubMed
    1. Gu M, Shao NY, Sa S, Li D, Termglinchan V, Ameen M, Karakikes I, Sosa G, Grubert F, Lee J, Cao A, Taylor S, Ma Y, Zhao Z, Chappell J, Hamid R, Austin ED, Gold JD, Wu JC, Snyder MP, Rabinovitch M, Patient-Specific iPSC-Derived Endothelial Cells Uncover Pathways that Protect against Pulmonary Hypertension in BMPR2 Mutation Carriers. Cell Stem Cell 20, 490–504 e495 (2017). - PMC - PubMed
    1. Hansmann G, de Jesus Perez VA, Alastalo TP, Alvira CM, Guignabert C, Bekker JM, Schellong S, Urashima T, Wang L, Morrell NW, Rabinovitch M, An antiproliferative BMP-2/PPARgamma/apoE axis in human and murine SMCs and its role in pulmonary hypertension. J Clin Invest 118, 1846–1857 (2008). - PMC - PubMed

Publication types

Substances