. 2021 May 5;13(592):eabd9898.
doi: 10.1126/scitranslmed.abd9898.

Integrated trajectories of the maternal metabolome, proteome, and immunome predict labor onset

Affiliations

Integrated trajectories of the maternal metabolome, proteome, and immunome predict labor onset

Ina A Stelzer et al. Sci Transl Med. .

Abstract

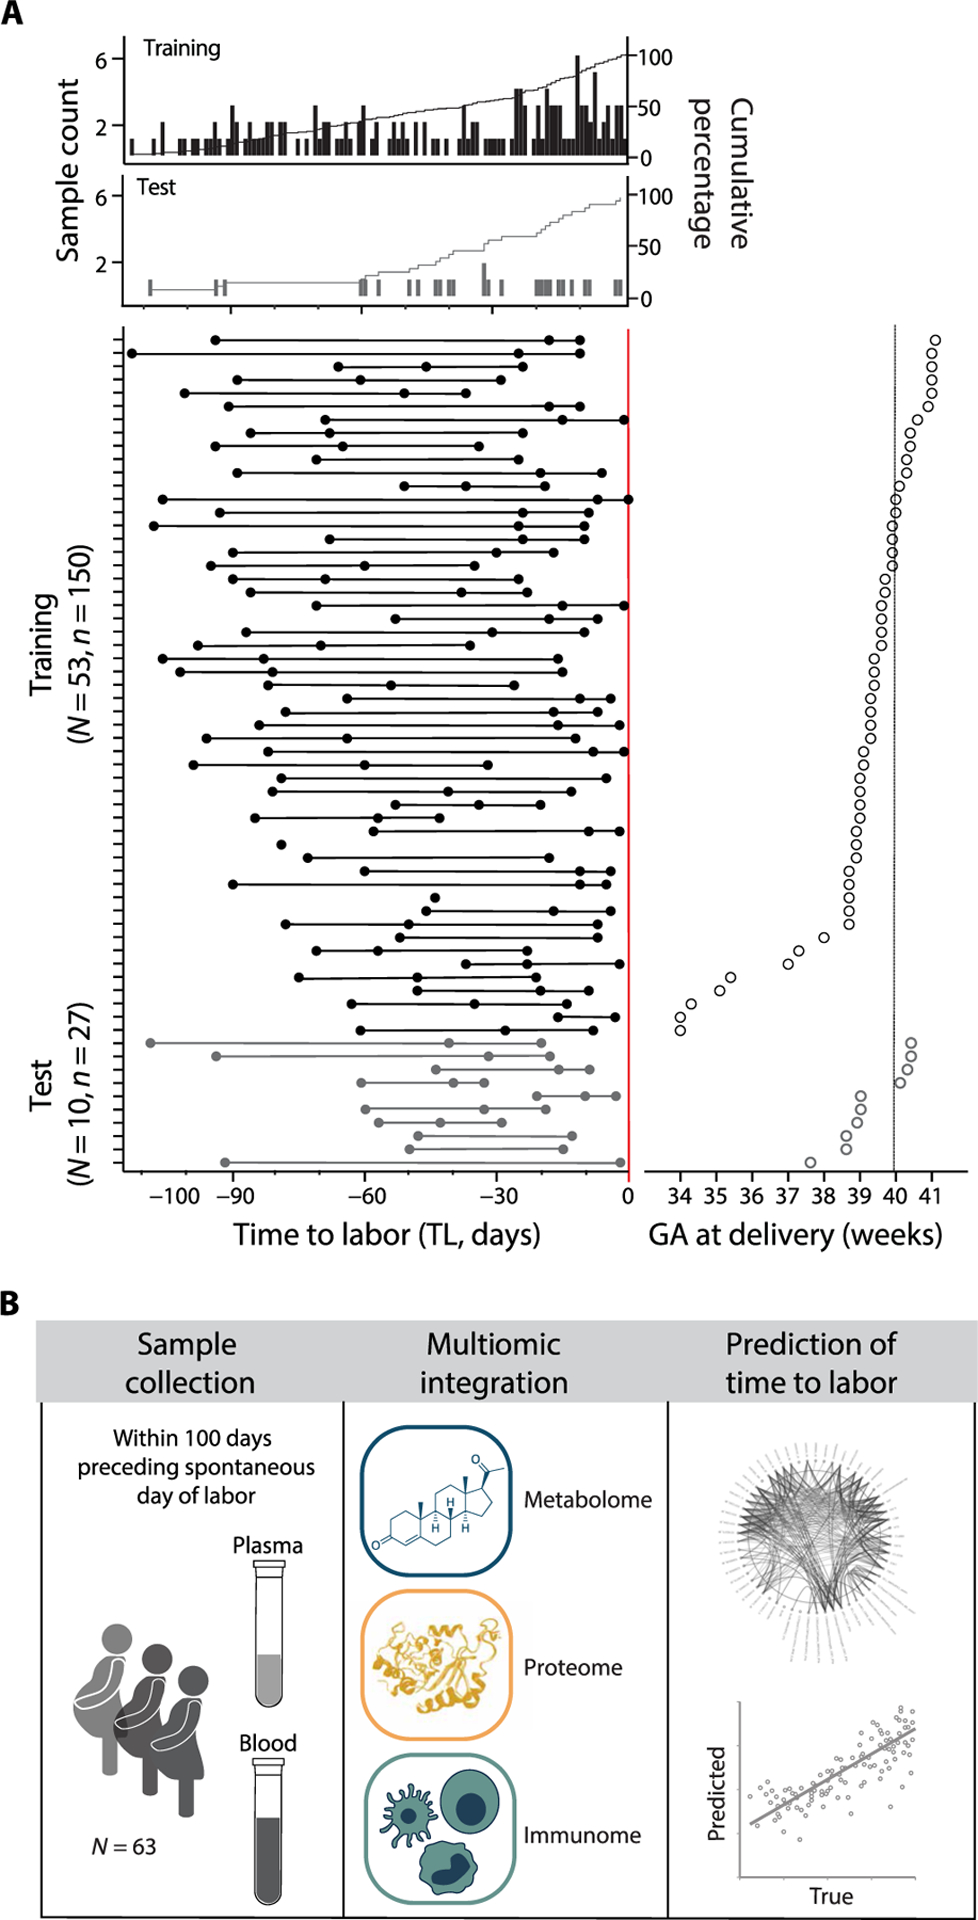
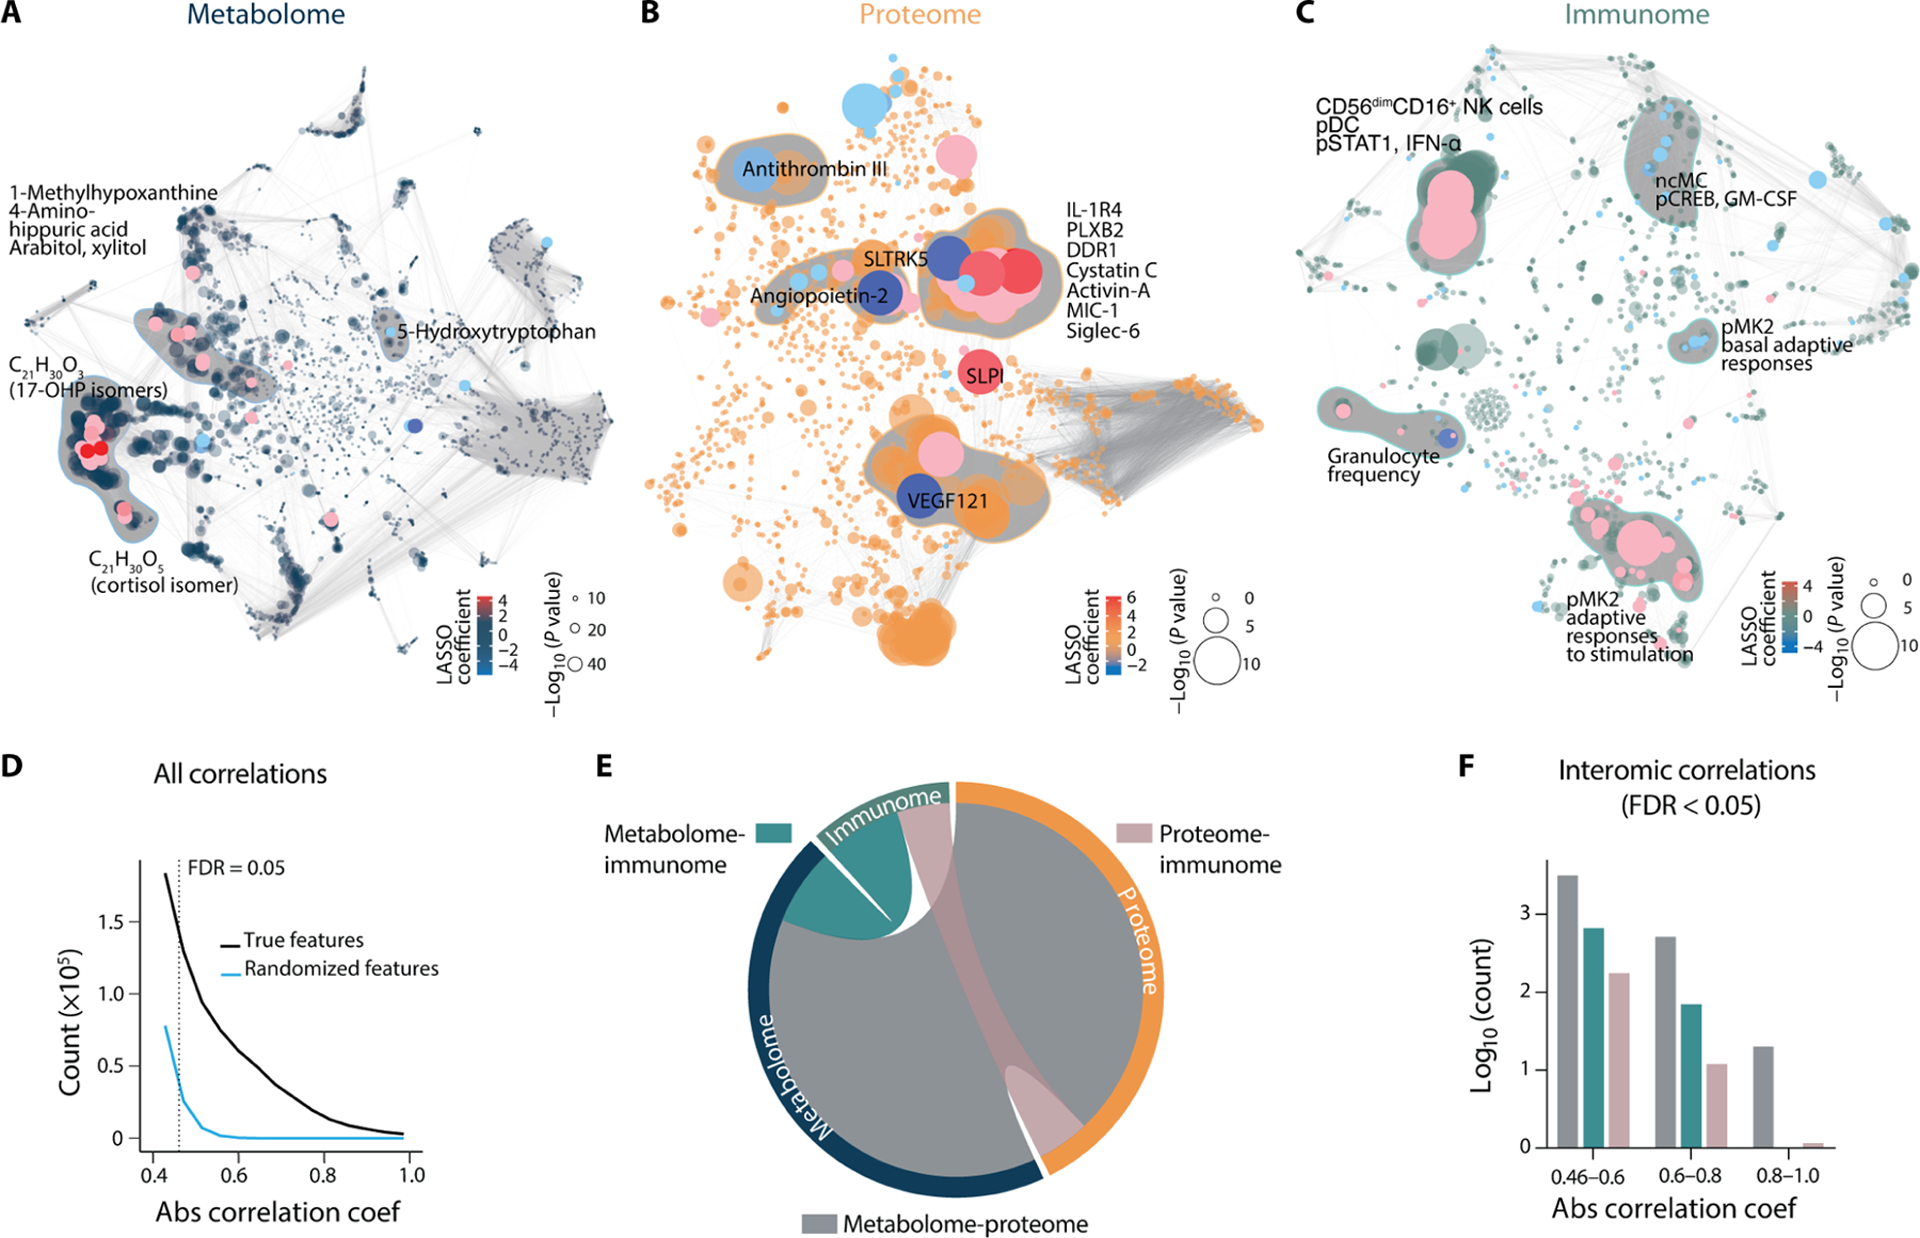
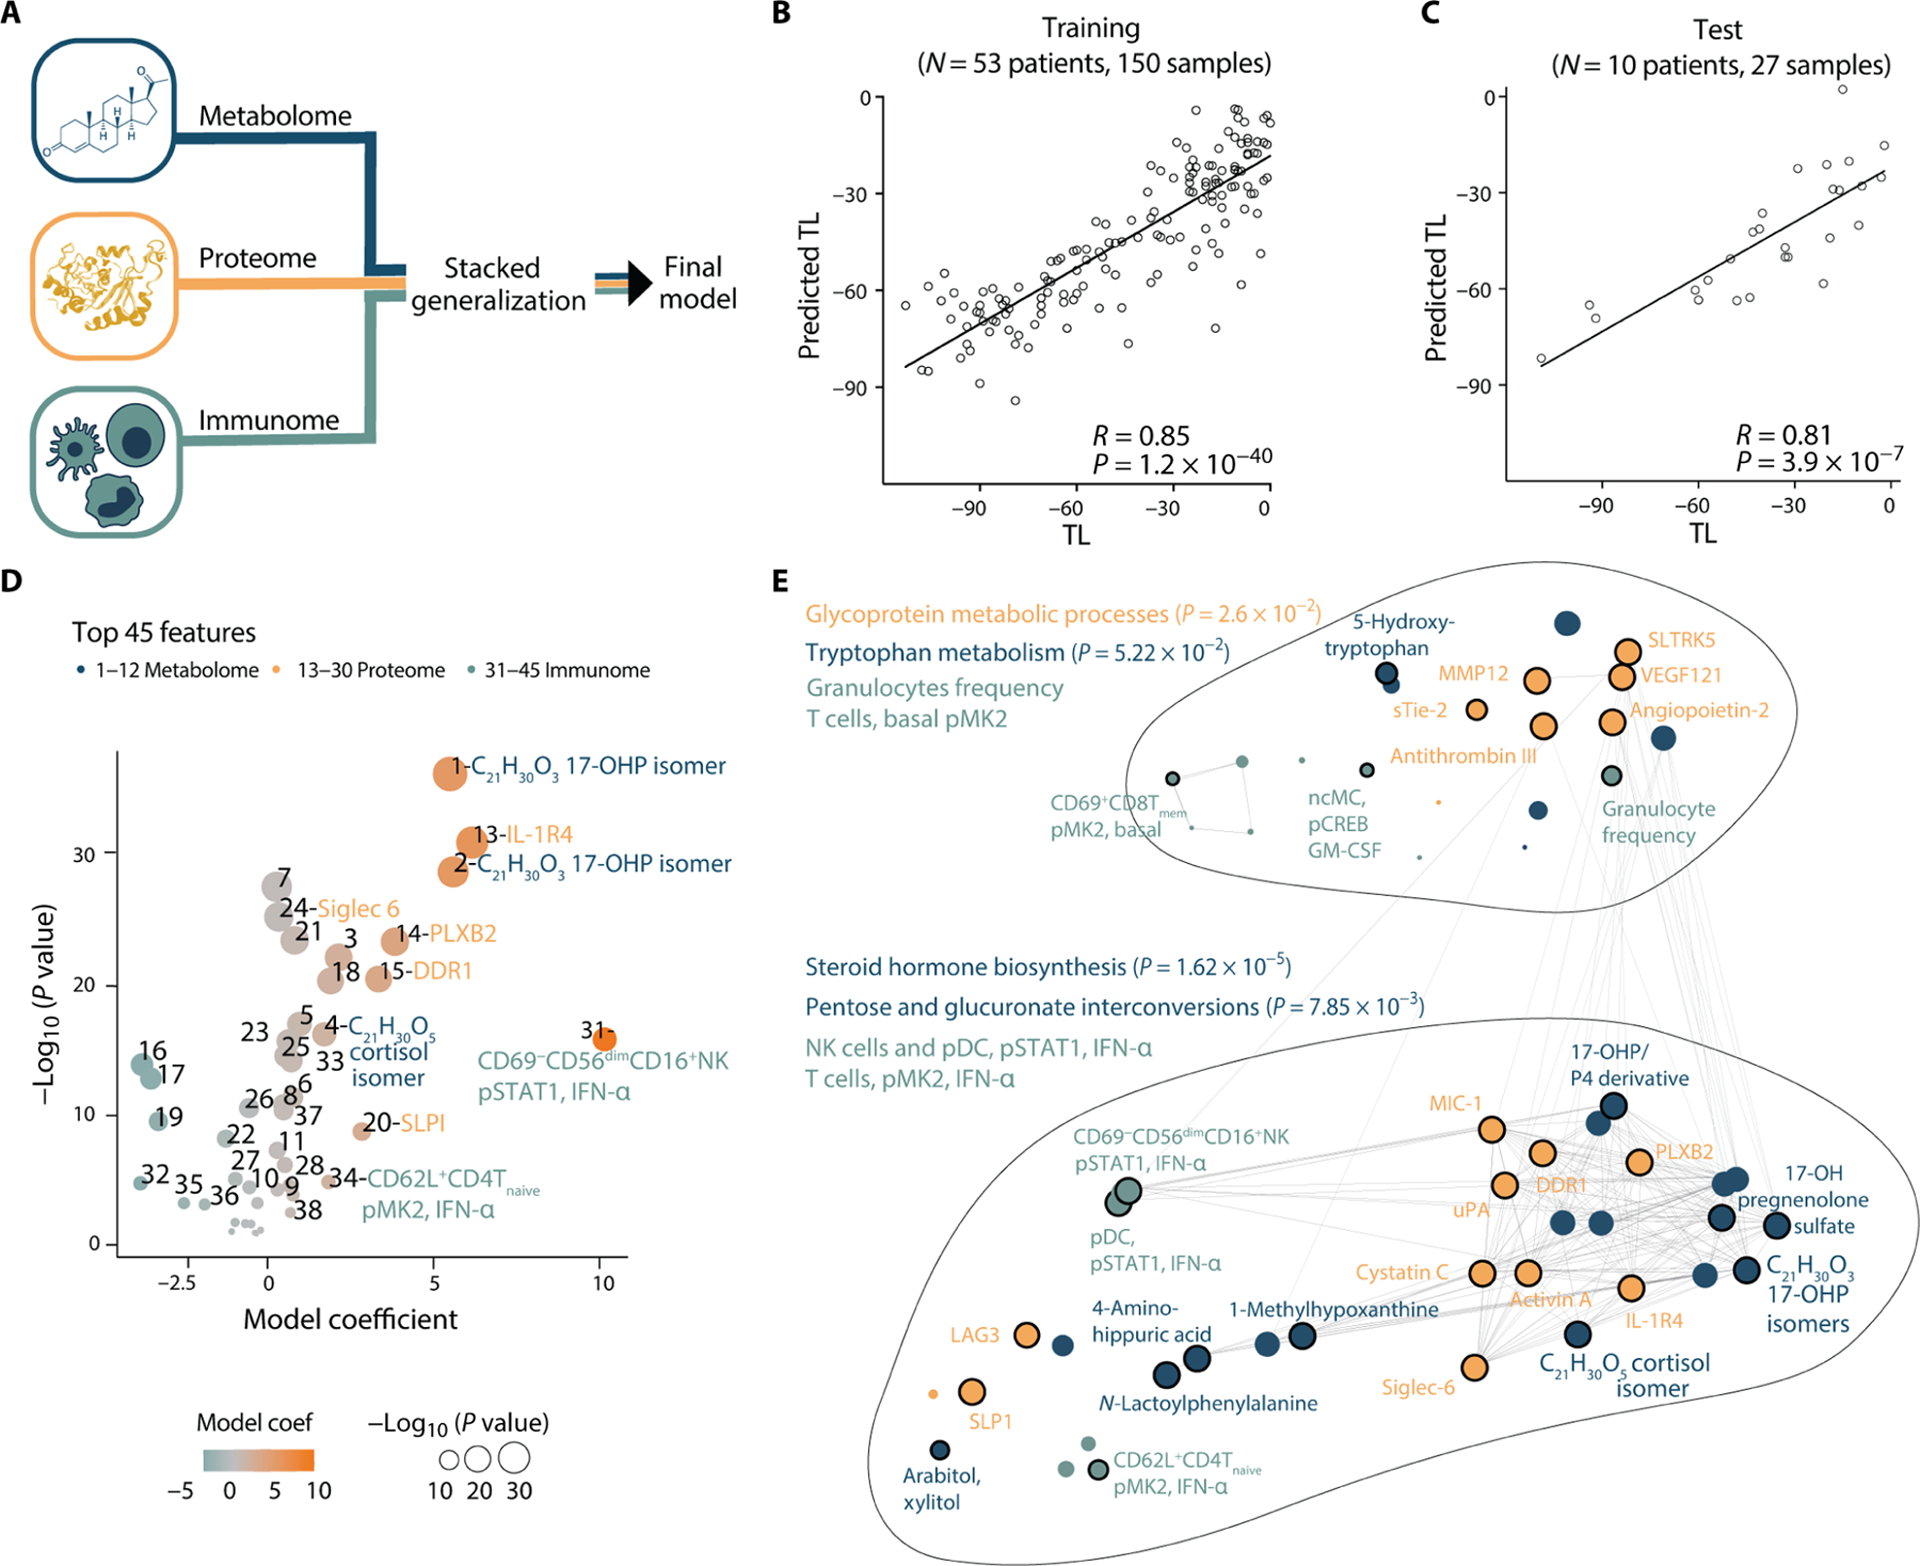
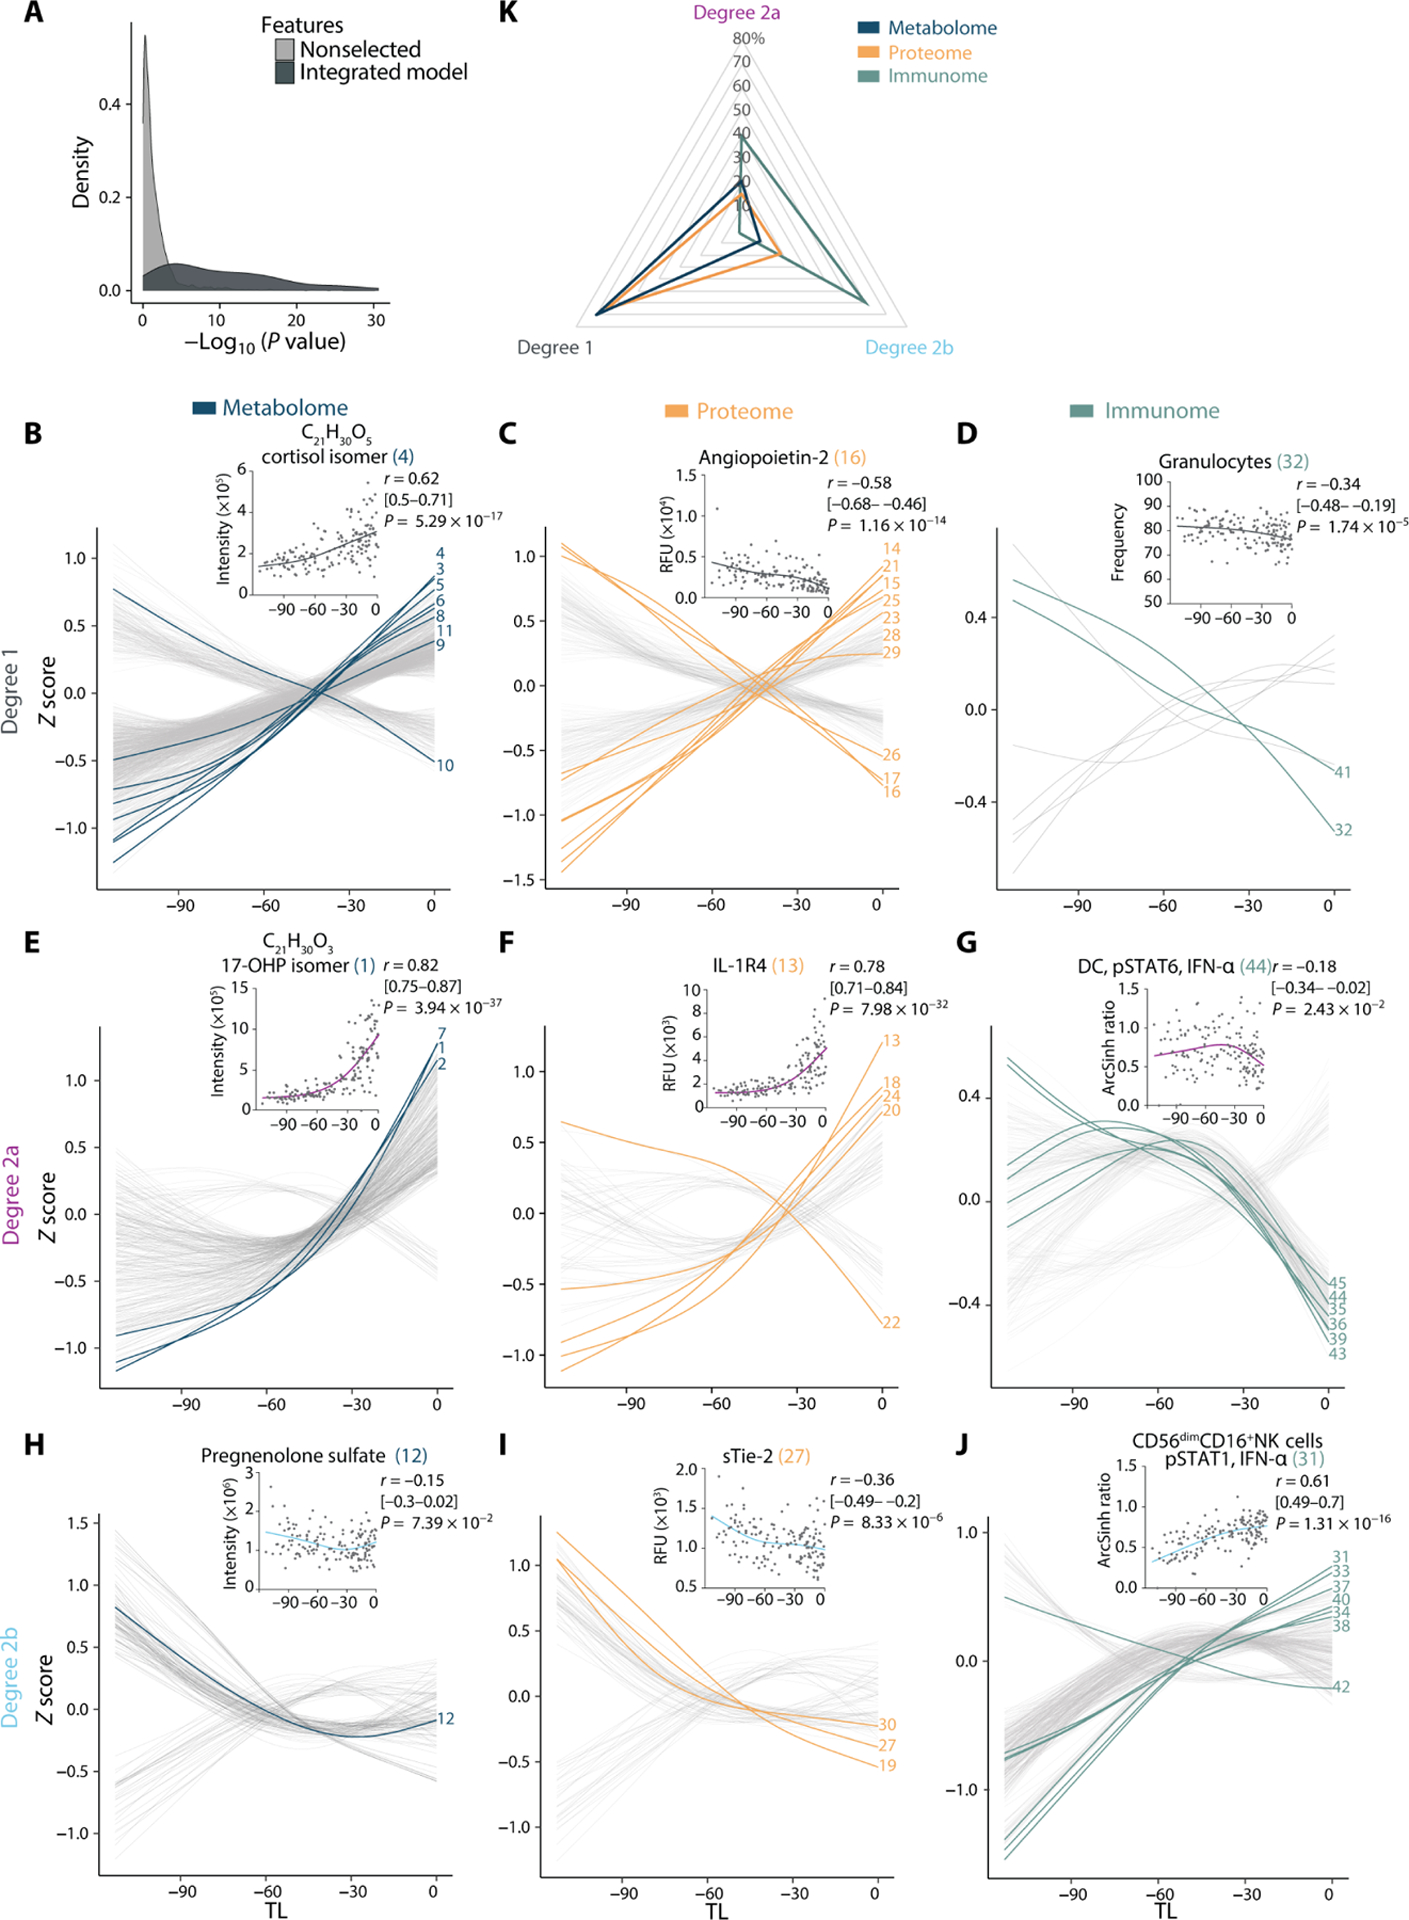
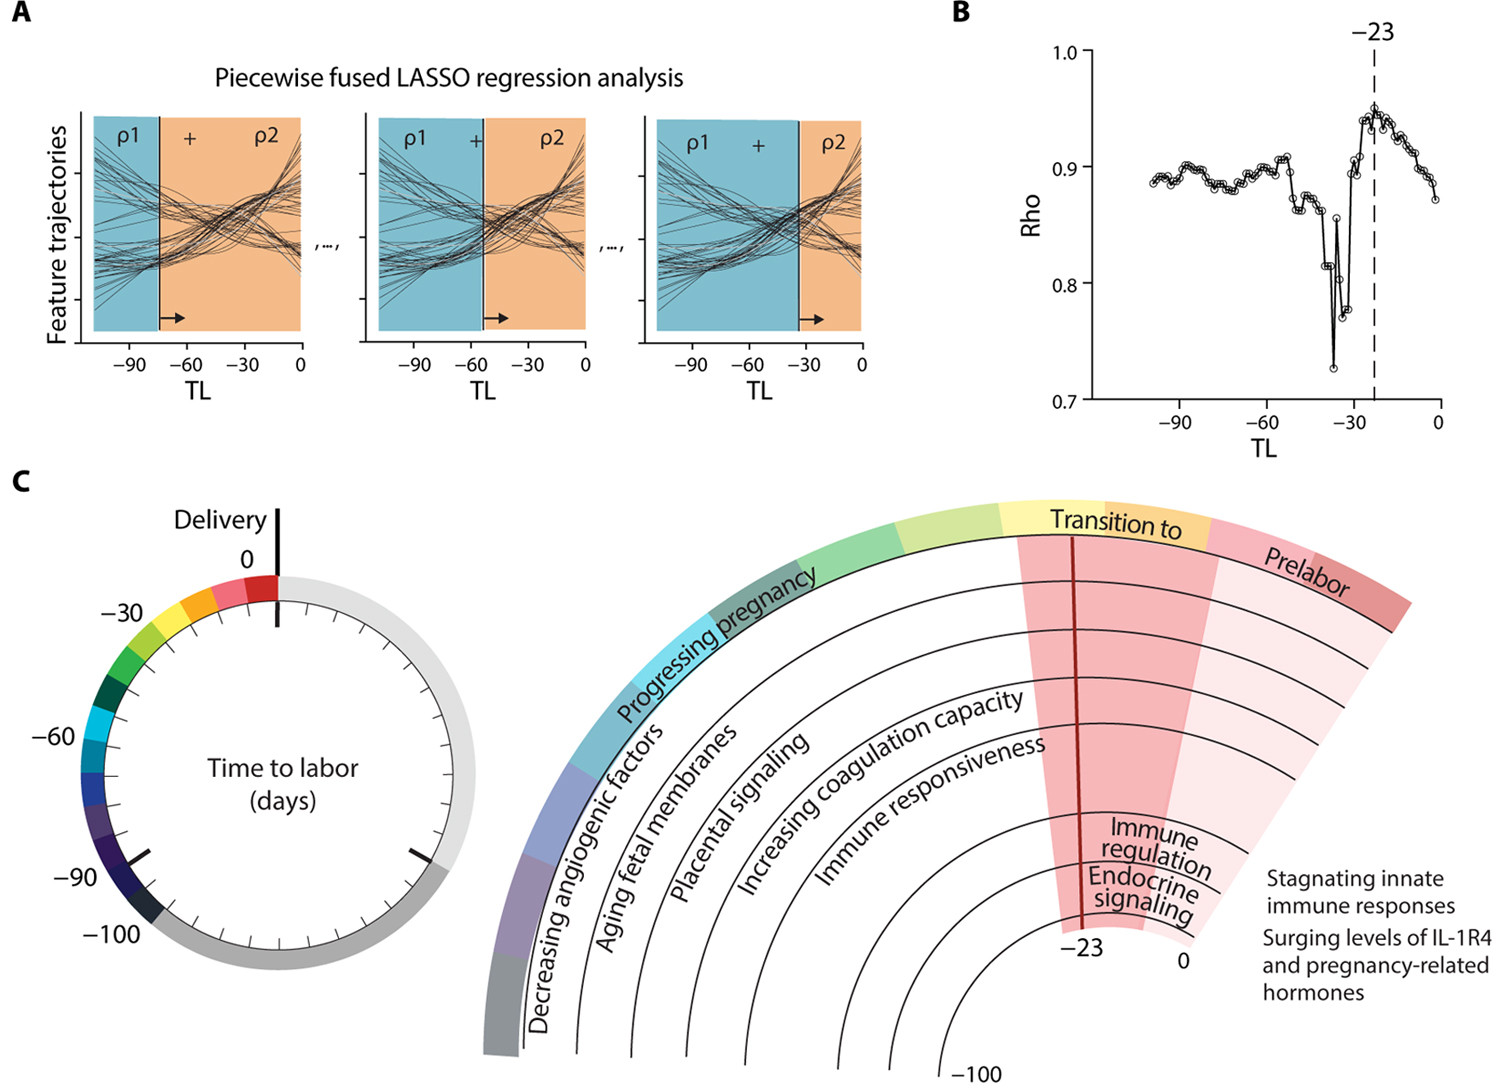
Estimating the time of delivery is of high clinical importance because pre- and postterm deviations are associated with complications for the mother and her offspring. However, current estimations are inaccurate. As pregnancy progresses toward labor, major transitions occur in fetomaternal immune, metabolic, and endocrine systems that culminate in birth. The comprehensive characterization of maternal biology that precedes labor is key to understanding these physiological transitions and identifying predictive biomarkers of delivery. Here, a longitudinal study was conducted in 63 women who went into labor spontaneously. More than 7000 plasma analytes and peripheral immune cell responses were analyzed using untargeted mass spectrometry, aptamer-based proteomic technology, and single-cell mass cytometry in serial blood samples collected during the last 100 days of pregnancy. The high-dimensional dataset was integrated into a multiomic model that predicted the time to spontaneous labor [R = 0.85, 95% confidence interval (CI) [0.79 to 0.89], P = 1.2 × 10-40, N = 53, training set; R = 0.81, 95% CI [0.61 to 0.91], P = 3.9 × 10⁻⁷, N = 10, independent test set]. Coordinated alterations in maternal metabolome, proteome, and immunome marked a molecular shift from pregnancy maintenance to prelabor biology 2 to 4 weeks before delivery. A surge in steroid hormone metabolites and interleukin-1 receptor type 4 that preceded labor coincided with a switch from immune activation to regulation of inflammatory responses. Our study lays the groundwork for developing blood-based methods for predicting the day of labor, anchored in mechanisms shared in preterm and term pregnancies.


Conflict of interest statement

Competing interests: A provisional patent application that covers aspects of the subject matter of the paper has been filed (US 63/066,708; title: Compositions and methods of predicting time to onset of labor; coinventors: B.G., N.A., M.S.A., I.A.S., S.G., X.H., K.A., and J.H.). M.P.S. is a founder and member of the science advisory board of Personalis, SensOmics, Qbio, January, Mirvie, Filtricine, and Protos and a science advisory board member of Genapsys and Jupiter. The other authors declare that they have no competing interests.

Figures

Fig. 1.
Fig. 1.. The maternal metabolome, proteome, and immunome were assessed during the 100-day period preceding the day of labor.
(A) Peripheral blood was obtained serially from 63 women during the 100 days preceding spontaneous labor. The primary outcome of the analysis was the time to labor (TL), such that the prediction of the day of labor did not consider estimates of GA. Raster plots depicting the day of sampling for the training (top plot; N = 53, n = 150 samples) and test (bottom plot; N = 10, n = 27 samples) cohort, and the TL distribution (range [−112, 0]), calculated as the difference between the day of labor (TL 0, red line) and the day of sampling (filled dots). At least one sample was collected on any day of the 100 days preceding the day of labor (cumulative count plot). (B) Plasma samples were used in the analysis of the circulating metabolome (high-throughput mass spectrometry) and proteome (aptamer-based technology). Whole-blood samples were used in the analysis of the systemic immunome (mass cytometry). In total, 7142 features were generated per sample from all three datasets and integrated into a multivariate model to predict the TL.
Fig. 2.
Fig. 2.. The late-gestational maternal interactome highlights interconnectivity between biological systems.
(A to C) Intraomic correlation networks of metabolome, proteome, and immunome features during the 100 days preceding labor in the training cohort (N = 53). Each node represents a biological feature. Correlations between features are represented by edges. Red/blue nodes highlight features positively/negatively correlated with the TL. Dot size indicates the −log10 of P value of the correlation (Spearman). Clusters of features most highly correlated with the TL are shaded in gray and annotated. (D) Distributions of all correlations within (intraomic) and between (interomic) modalities in the original as well as simulated random datasets. The false discovery rate (FDR) threshold of 0.05 was computed from the generated distribution of random features in a target-to-decoy approach to filter the correlations with FDR > 0.05, corresponding to an absolute (|x|) correlation coefficient cutoff at 0.46. (E) Chord diagram of interomic (between-dataset) correlations between metabolome, proteome, and immunome features in the last 100 days before the day of labor. The outer circle represents all features with FDR-adjusted absolute correlation coefficients [Spearman R (0.46, 1.0), FDR < 0.05], colored by the respective biological modality. Shaded inner connections represent interomic correlations between the metabolome, proteome, and immunome as specified by color codes. The number of FDR-adjusted interactions between two omics is visualized as normalized to the number of total possible interomic interactions. (F) Quantification of the number of interomic interactions visualized in (E). The number of interomic correlations between the three biological modalities divided into weak (0.46 to 0.6), moderate (0.6 to 0.8), and strong (0.8 to 1.0) absolute correlation coefficients is shown.
Fig. 3.
Fig. 3.. Multiomic modeling of the maternal interactome predicts labor onset.
(A) Integration of all three modalities (metabolome, proteome, and immunome) using a stacked generalization (SG) method. (B and C) Regression of predicted versus true TL (days) derived from the SG model [training cohort, Pearson R = 0.85, 95% CI [0.79 to 0.89], P = 1.2 × 10−40, RMSE = 17.7 days, N = 53 patients (B); test cohort, Pearson R = 0.81, 95% CI [0.61 to 0.91], P = 3.9 × 10⁻⁷, RMSE = 17.4 days, N = 10 patients (C)]. (D) Volcano plot depicting the 45 most informative SG model features in the training cohort. Feature importance to the overall predictive model is plotted on the x axis (SG model coefficient), correlation with the TL is plotted on the y axis [−Log10 (P value)]. Orange colors depict positive correlations with the TL, and teal colors depict negative correlations. See table S3 for number-to-feature key. (E) Pathway enrichment analysis was performed on metabolic and proteomic top SG model features (see Materials and Methods; P values derived from hypergeometric and Fisher’s test). All 45 most informative model features are depicted in a correlation network to visualize interomic correlations (edges indicate an absolute R > 0.46, N = 53). See also Fig. 4, fig. S1, and table S3.
Fig. 4.
Fig. 4.. Trajectories of the maternal metabolome, proteome, and immunome reveal alterations in prelabor dynamics.
(A) Distribution of relevance-of-fit P values for the trajectories assigned to SG model features in comparison to nonselected features demonstrates goodness of fit of curve classification (N = 53 patients, n = 150 samples). Feature trajectories were classified as linear or quadratic on the basis of the goodness of fit with Akaike information criterion and relevance of fit with associated P value (F statistic). Degree 1 (B to D), degree 2a (E to G), or degree 2b (H to J) trajectories are plotted over time for the metabolome (left), proteome (middle), and immunome (right). Lines represent smoothened spline (df = 3, Z-scored) for all features. The most informative model features are highlighted and numbered (in reference to Fig. 3D and table S3). A representative feature is shown (inset) for each trajectory type including its correlation with TL (Spearman coefficient [95% CI], and associated P value). (K) Radar plot quantifying the distribution of degree 1 (linear), degree 2a [quadratic, accelerating (surging of an increasing or decreasing pattern over time)], and degree 2b [quadratic, decelerating (plateauing of an increasing or decreasing pattern over time)] trajectories among all multiomic features. See also figs. S2 to S6 and tables S3 and S4.
Fig. 5.
Fig. 5.. A breakpoint in omic trajectories demarcates the transition from pregnancy maintenance to prelabor biological adaptations.
(A) Schematic of a piecewise fused LASSO regression combining predictions rho (ρ) of two regression models built from all datasets before and after a particular TL threshold, while sliding the threshold across the time axis. Plotting ρ over time reveals the time point of highest accuracy (maximum ρ). (B) Maximum ρ of 0.95 was observed at day −23 (range [−27, −13]; N = 53 patients). (C) Summary of concerted biological adaptations depicting a clock to labor. Angiogenic factors: Decreased Angiopoietin-2, sTie-2, and VEGF121. Aging fetal membranes: Increased PLXB2 and DDR1. Placental signaling: Increased Activin-A and Siglec-6. Coagulation capacity: Decreased ATIII and increased uPA. Immune responsiveness: Increased Cystatin C, increased pSTAT1 responses in NK and pDC upon IFN-α stimulation, and decreased granulocyte frequencies. A switch to prelabor biology occurs at day −23 (range [−27, −13]; pink shaded phase) before the day of labor. The prelabor phase is characterized by immune regulation: Stagnating pSTAT1 responses in NK and pDC upon IFN-α stimulation, decreased basal IκB and pMK2 signals in CD4+ and CD8+ T cells, decreased pCREB in ncMC upon GM-CSF stimulation, decreased pSTAT6 responses in DC upon IFN-α stimulation, decreased pMK2 in B cells upon LPS stimulation, and decreased MyD88 responses in cMC upon LPS and GM-CSF stimulation. Regulation of Macrophage inhibitory cytokine-1 (MIC-1), Secretory Leukocyte Peptidase Inhibitor (SLPI), and Lymphocyte-activation gene 3 (LAG3). Surging Cystatin C and IL-1R4. Endocrine signaling: Surging 17-OHP isomers, 17-hydroxypregnenolone sulfate, and cortisol isomer.

References

    1. Liu L, Oza S, Hogan D, Chu Y, Perin J, Zhu J, Lawn JE, Cousens S, Mathers C, Black RE, Global, regional, and national causes of under-5 mortality in 2000–15: An updated systematic analysis with implications for the Sustainable Development Goals. Lancet 388, 3027–3035 (2016). - PMC - PubMed
    1. Galal M, Symonds I, Murray H, Petraglia F, Smith R, Postterm pregnancy. Facts Views Vis. Obgyn 4, 175–187 (2012). - PMC - PubMed
    1. Georgiou HM, Di Quinzio MKW, Permezel M, Brennecke SP, Predicting preterm labour: Current status and future prospects. Dis. Markers 2015, 435014 (2015). - PMC - PubMed
    1. Suff N, Story L, Shennan A, The prediction of preterm delivery: What is new? Semin. Fetal Neonatal Med 24, 27–32 (2019). - PubMed
    1. Hutcheon J, Lee L, Marquette G, 320: Predicting the onset of spontaneous labour (OSL) in post date pregnancies. Am. J. Obstet. Gynecol 208, S143–S144 (2013).

Publication types