. 2021 May 11;118(19):e2020293118.
doi: 10.1073/pnas.2020293118.

Impaired inhibitory GABAergic synaptic transmission and transcription studied in single neurons by Patch-seq in Huntington's disease

Affiliations

Impaired inhibitory GABAergic synaptic transmission and transcription studied in single neurons by Patch-seq in Huntington's disease

Foteini Paraskevopoulou et al. Proc Natl Acad Sci U S A. .

Abstract

Transcriptional dysregulation in Huntington's disease (HD) causes functional deficits in striatal neurons. Here, we performed Patch-sequencing (Patch-seq) in an in vitro HD model to investigate the effects of mutant Huntingtin (Htt) on synaptic transmission and gene transcription in single striatal neurons. We found that expression of mutant Htt decreased the synaptic output of striatal neurons in a cell autonomous fashion and identified a number of genes whose dysregulation was correlated with physiological deficiencies in mutant Htt neurons. In support of a pivotal role for epigenetic mechanisms in HD pathophysiology, we found that inhibiting histone deacetylase 1/3 activities rectified several functional and morphological deficits and alleviated the aberrant transcriptional profiles in mutant Htt neurons. With this study, we demonstrate that Patch-seq technology can be applied both to better understand molecular mechanisms underlying a complex neurological disease at the single-cell level and to provide a platform for screening for therapeutics for the disease.

Keywords: Huntington’s disease; Patch-seq; single-cell RNA sequencing; striatum; synaptic function.


Conflict of interest statement

The authors declare no competing interest.

Figures

Fig. 1.
Fig. 1.
Expression of mutant huntingtin (97Q-Htt) decreases synaptic transmission in autaptic striatal GABAergic neurons. (A) Representative images from cultured striatal neurons expressing 25Q-Htt (Left) and 97Q-Htt (Right) with immunoreactivity against GFP fusion protein (green) and the striatal neuron marker DARPP32 (red). (B) Schematic representation of lentiviral constructs used for infecting striatal neurons from C57BL/6N mouse. GFP sequence is fused to exon 1 of wild-type (25Q) or mutant (97Q) HTT gene. (CN) Functional analysis of 25Q-Htt (black traces and bars) or 97Q-Htt (red traces and bars) neurons. (C) Representative traces of evoked IPSCs. (D and E) Bar graphs showing mean evoked IPSC amplitudes (D) and mean membrane capacitance measurements as obtained from the membrane test pulse (E). (F) Representative traces showing mIPSC activity. (G and H) Bar graphs showing mean mIPSC amplitudes (G) and frequency (H). (I) Representative current traces of the response to a 5 s pulse of 500 mOsm hypertonic sucrose solution. (J and K) Bar graphs showing RRP size as measured by the charge of the transient response component (J) and the mean number of synaptic vesicles contained in the RRP (K). (L) Representative traces of the response to paired pulse, in which both traces are normalized to the first peak of 25Q-Htt neurons (dotted line). (M and N) Bar graphs showing mean paired pulse ratios (M) and mean vesicular probability (Pvr) (N). Data shown as mean ± SEM. Numbers in parentheses indicate sample sizes. Mann–Whitney U test: * refers to P ≤ 0.05, **P ≤ 0.01, ***P ≤ 0.001, and ****P ≤ 0.001.
Fig. 2.
Fig. 2.
Mutant huntingtin impairs cell outgrowth in autaptic striatal GABAergic neurons. (A) Representative images from 25Q-Htt and 97Q-Htt striatal autaptic neurons in culture showing immunoreactivity for MAP2, Htt-GFP, and VGAT and tracing of the same neurons with SynD. (BE) Morphological analysis of 25Q-Htt (black bars) or 97Q-Htt (red bars) neurons. Bar graphs showing soma area (B), number of VGAT puncta per neuron (C), total length of dendrites (D), and the number of VGAT puncta per μm of dendritic length (E). Data shown as mean ± SEM. Numbers in parentheses indicate sample sizes. Mann–Whitney U test: * refers to P ≤ 0.05 and **P ≤ 0.01.
Fig. 3.
Fig. 3.
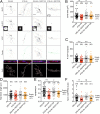
Application of HDACi RGFP109 restores evoked IPSC magnitude and RRP size. (AF) Functional analysis of vehicle-treated 25Q-Htt (black traces, bars) and 97Q-Htt (red traces, bars) neurons and HDACi RGFP109–treated 25Q-Htt (gray traces, bars) and 97Q-Htt (orange traces, bars) neurons. (A) Representative traces of evoked IPSCs. (B and C) Bar graphs showing mean evoked IPSC amplitudes (B) mean mIPSCs amplitudes (C). (D) Representative current traces of the response to a 5 s pulse of 500 mOsm hypertonic sucrose solution. (E and F) Bar graphs showing readily releasable pool size as measured by the charge of the transient response component (E) and mean vesicular probability (Pvr) (F). Data shown as mean ± SEM. Numbers in parentheses indicate sample sizes. One-way ANOVA or Kruskal–Wallis test coupled with Dunn’s post hoc test: * refers to P ≤ 0.05, **P ≤ 0.01, ***P ≤ 0.001, and ****P ≤ 0.001.
Fig. 4.
Fig. 4.
Application of HDACi RGFP109 restores synapse number and soma size. (A) Representative images from vehicle-treated 25Q-Htt and 97Q-Htt neurons and HDACi RGFP109–treated 25Q-Htt and 97Q-Htt neurons showing immunoreactivity for MAP2, Htt-GFP, and VGAT and tracing of the same neurons with SynD. (BF) Morphological analysis of 25Q-Htt (black bars) or 97Q-Htt (red bars) neurons. Bar graphs showing soma area (B), number of VGAT puncta per neuron (C), total length of dendrites (D), the number of VGAT puncta per μm of dendritic length (E), and normalized DARPP32 integrated density (F). Data shown as mean ± SEM. Numbers in parentheses indicate sample sizes. One-way ANOVA or Kruskal–Wallis test coupled with Dunn’s post hoc test: * refers to P ≤ 0.05, **P ≤ 0.01, ***P ≤ 0.001, and ****P ≤ 0.001.
Fig. 5.
Fig. 5.
Single-cell RNA-seq (Patch-seq) of striatal autaptic neurons. (A) Heat map illustrating gene expression profiles of pan-neuronal, inhibitory, excitatory, and astrocytic markers in all collected the samples. (B) Unsupervised hierarchical agglomerative clustering (Euclidean distance, complete linkage) of the cell–cell covariance matrix of the top 3,000 most variable genes, showing the presence of two groups (astrocytes and neurons). (C) t-distributed stochastic neighbor embedding (t-SNE) plot using the expression of the top 3,000 most variable genes in single-cell transcriptomes of five neuronal groups. Cells are colored according to the groups. (D) Heat map illustrating gene expression profiles of pan-MSN, direct MSN (dMSN), indirect MSN (iMSN), eccentric MSN (eMSN), and interneuron markers in all collected samples [based on dropviz.org database, (30, 62)].
Fig. 6.
Fig. 6.
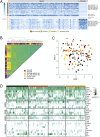
Analysis of differential gene expression reveals the effects of mutant huntingtin gene expression and HDACi treatment on single striatal neuron transcriptomes. (A) Heat map of z-scores for differentially expressed genes for the four groups (25Q-Htt, black; 97Q-Htt, red; 25Q-Htt+RGFP109, gray; and 97Q-Htt+RGFP109, orange). The light and dark green bars in the left indicate the genes that are differentially expressed between 97Q-Htt and 25Q-Htt and between 97Q-Htt+RGFP109 and 97Q-Htt, respectively. The log2 fold changes (Log2FC) for 25Q-Htt versus 97Q-Htt and for 97Q-Htt+RGFP109 versus 97Q-Htt are also given. (B) A subset of enriched gene sets related to neuronal function for the four comparisons. The bars denote the normalized enrichment scores and the direction of expression change (up-regulated or down-regulated gene sets).
Fig. 7.
Fig. 7.
Linking functional and transcriptome data. (A) Heat map of Spearman’s rho values for common HD genes for the three electrophysiological parameters (IPSC, RRP, and membrane capacitance) that showed the most significant differences between 25Q-Htt and 97Q-Htt neurons. (B) Scatter plots showing the performance of the generalized linear model using single-cell gene expression data to predict neuronal electrophysiological properties IPSC and RRP, based on the expression levels of 10 and 23 genes, respectively. For each model, the cvm (mean cross-validation error), cvsd (cross-validation SE), and MSE (mean square error) are provided. Individual neurons are color coded according to their groups (25Q-Htt, black; 97Q-Htt, red; 25Q-Htt+RGFP109, gray; and 97Q-Htt+RGFP109, orange). The values given in the figures are achieved from machine learning results applied to 25Q-Htt and 97Q-Htt neurons. Other neurons were added to the plot for the purpose of visualization. (C) Heat maps of the 33 genes that could predict the states of the electrophysiological properties IPSC (r = 0.79) and RRP (r = 0.97). The left heat map shows the percentage of cells expressing each gene and the right heat map the expression levels of those genes. (D) Bar plots showing the levels of differential expression as a log2 fold change between 97Q-Htt versus 25Q-Htt and between 97Q-Htt+RGFP109 versus 25Q-Htt for the genes predicted by GLM. Left graph: up-regulated in 97Q-Htt neurons. Right graph: down-regulated in 97Q-Htt neurons.

References

    1. Vonsattel J. P., DiFiglia M., Huntington disease. J. Neuropathol. Exp. Neurol. 57, 369–384 (1998). - PubMed
    1. Graveland G. A., DiFiglia M., The frequency and distribution of medium-sized neurons with indented nuclei in the primate and rodent neostriatum. Brain Res. 327, 307–311 (1985). - PubMed
    1. Kemp J. M., Powell T. P. S., The structure of the caudate nucleus of the cat: Light and electron microscopy. Philos. Trans. R. Soc. Lond. B Biol. Sci. 262, 383–401 (1971). - PubMed
    1. Rosas H. D., et al. ., Cerebral cortex and the clinical expression of Huntington’s disease: Complexity and heterogeneity. Brain 131, 1057–1068 (2008). - PMC - PubMed
    1. The Huntington’s Disease Collaborative Research Group , A novel gene containing a trinucleotide repeat that is expanded and unstable on Huntington’s disease chromosomes. Cell 72, 971–983 (1993). - PubMed

Publication types