. 2021 May 5;12(1):2539.
doi: 10.1038/s41467-021-22759-z.

A data-independent acquisition-based global phosphoproteomics system enables deep profiling

Affiliations

A data-independent acquisition-based global phosphoproteomics system enables deep profiling

Reta Birhanu Kitata et al. Nat Commun. .

Abstract

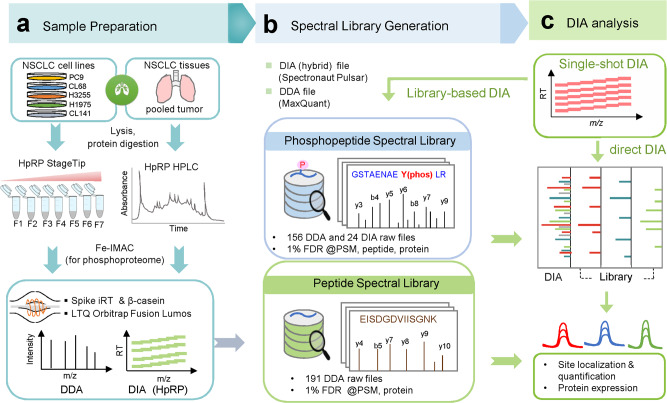
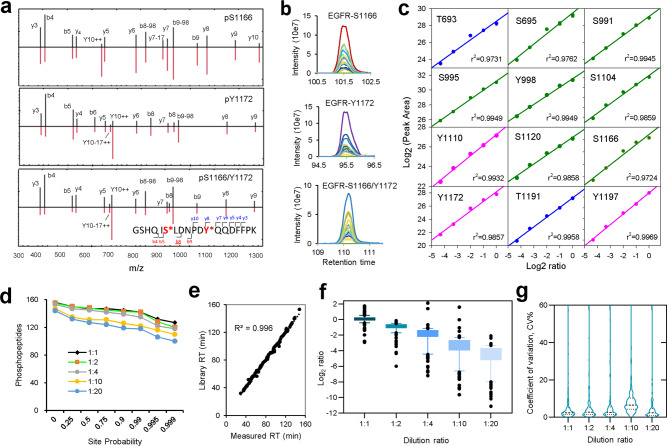
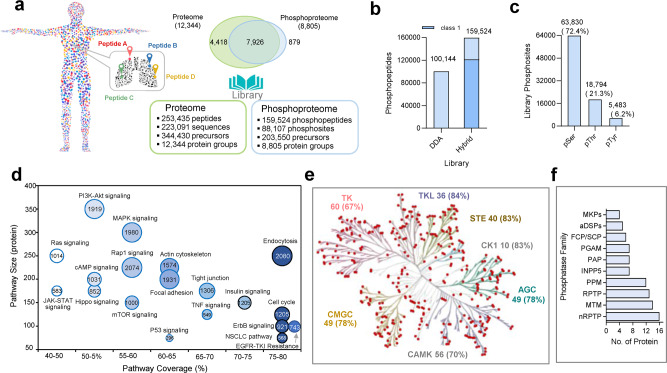
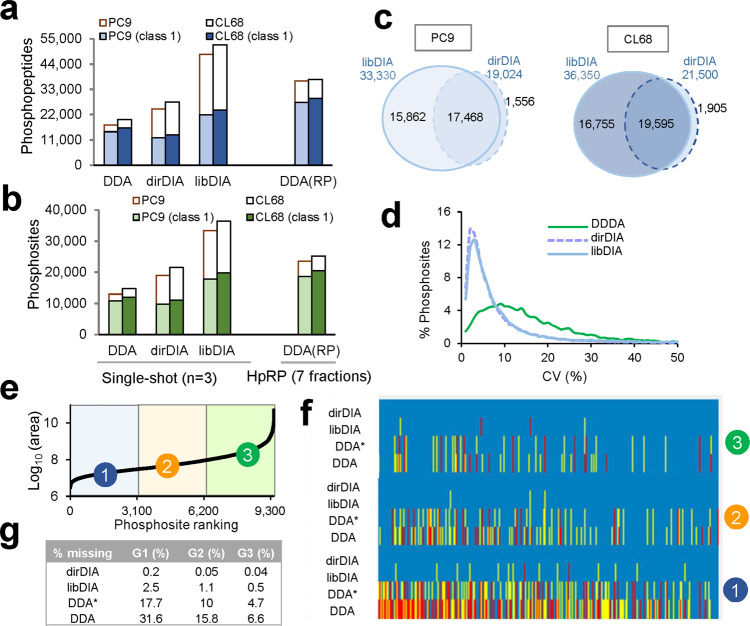
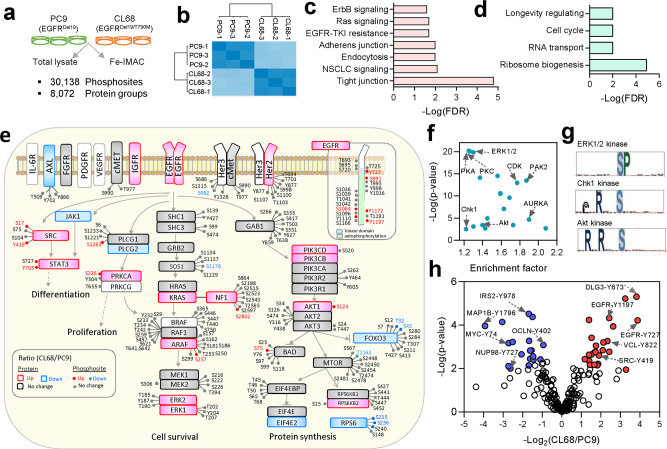
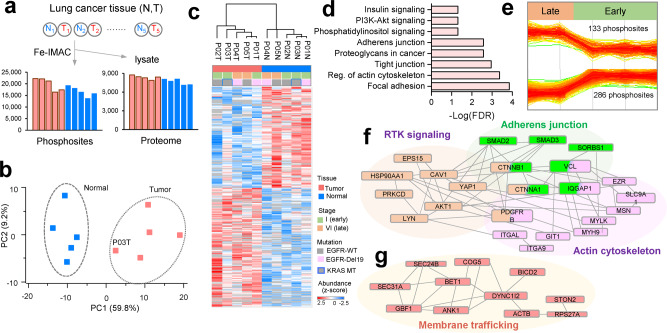
Phosphoproteomics can provide insights into cellular signaling dynamics. To achieve deep and robust quantitative phosphoproteomics profiling for minute amounts of sample, we here develop a global phosphoproteomics strategy based on data-independent acquisition (DIA) mass spectrometry and hybrid spectral libraries derived from data-dependent acquisition (DDA) and DIA data. Benchmarking the method using 166 synthetic phosphopeptides shows high sensitivity (<0.1 ng), accurate site localization and reproducible quantification (~5% median coefficient of variation). As a proof-of-concept, we use lung cancer cell lines and patient-derived tissue to construct a hybrid phosphoproteome spectral library covering 159,524 phosphopeptides (88,107 phosphosites). Based on this library, our single-shot streamlined DIA workflow quantifies 36,350 phosphosites (19,755 class 1) in cell line samples within two hours. Application to drug-resistant cells and patient-derived lung cancer tissues delineates site-specific phosphorylation events associated with resistance and tumor progression, showing that our workflow enables the characterization of phosphorylation signaling with deep coverage, high sensitivity and low between-run missing values.


Conflict of interest statement

The authors declare no competing interests.

Figures

Fig. 1
Fig. 1. Pipeline for hybrid spectral library construction and phosphosite quantification.
a For the construction of the spectral library, non-small cell lung cancer (NSCLC) cells and tissues were lysed, digested, and fractionated by high pH reversed-phase (HpRP) chromatography in StageTip or in column (HPLC), and phosphopeptides were enriched by iron-based immobilized metal affinity chromatography (Fe-IMAC) and analyzed by the data-dependent acquisition (DDA) and data-independent acquisition (DIA) modes. The indexed retention time (iRT) standard peptides were spiked for normalization in retention time. b A phosphopeptide reference library was constructed from both DDA datasets (n = 156 raw files) and DIA datasets (n = 24 raw files), which were processed by Spectronaut Pulsar. Lung cancer proteome library was constructed from 191 DDA raw files processed with MaxQuant search. All data were filtered at 1% false discovery rate (FDR) at peptide spectrum match (PSM)/Precursor, Peptide, and Protein. c Single-shot DIA was acquired and processed by both library-based DIA (libDIA) and direct DIA (dirDIA) approach by Spectronaut. Phosphosite-level quantification was obtained by an in-house customized R program.
Fig. 2
Fig. 2. Quantification performance benchmarking using synthetic phosphopeptides.
Pooled samples of 166 synthetic phosphopeptides with serial dilutions (2, 1, 0.5, 0.2, and 0.1 ng) spiked into 0.5 µg yeast tryptic peptides was used to benchmark phosphoproteome workflow generating spectral library. a Example DIA spectra of mono- and multiple phosphosites on the 1161GSHQISLDNPDYQQDFFPK1179 sequence from EGFR. Spectra matching the DIA signal (top, black line) and fragments in the library (bottom, red line) are shown. b Chromatographic elution profiles of the three phosphopeptides providing unambiguous detection. c Quantification linearity of 12 EGFR phosphosites across dilution series using site abundance against expected theoretical dilution ratio. d Localization probability distribution for the quantified 157 phosphopeptides in DIA scanning m/z range. Overall, among 157 phosphopeptides, 147 (93.6%), 145 (92.4%), 142 (90.4%), 131 (83.4%), and 124 (79%) were quantified as class 1 (minimum of 0.75 site-localization probability) in 1:1, 1:2, 1:4, 1:10, and 1:20 dilutions, respectively. e Correlation between measured retention time in DIA and expected time from library. f Quantification accuracy of class 1 localized phosphosites across dilution series. Box and whiskers were drawn with 10–90% percentile from n = 3 measurements. Median ratio of 0.95, 1.79, 3.36, 8.7, and 20.06 were observed for the theoretical ratio of 1-, 2-, 4-, 10-, and 20-fold, respectively. g Violin plot of distribution of coefficient of variation (CV %) of class 1 quantified phosphosites where the quartiles were shown using dot lines. A median CV% of 2.40%, 2.78%, 2.70%, 6.59%, and 2.46% were observed for phosphosites across 1:1, 1:2, 1:4, 1:10, and 1:20 dilution series, respectively. Source data are provided as a Source Data file.
Fig. 3
Fig. 3. Composition of the reference spectral library for the global phosphoproteome system.
a Proteome and phosphoproteome libraries composition and protein groups overlap. b Phosphopeptides in hybrid and DDA-only libraries. c Distribution of phosphorylated serine (pSer), threonine (pThr), and tyrosine (pTyr) in the global phosphoproteome system (GPS) library. d Pathway annotation of phosphoproteins in the library using Kyoto Encyclopedia of Genes and Genomes (KEGG) database. The circle size corresponds to phosphosite coverage, whereas the X and Y axis shows protein coverage in the pathway and size of protein, respectively. The number in the circles shows number of phosphosites covered in the pathway. The blue color intensity shows the percentage of pathway coverage. e Kinase tree revealed 383 kinases in the library with proportion of each kinase family covered shown in bracket. KinMap database (http://www.kinhub.org/kinmap/) was used with input of protein accession number from GPS library. The kinase families listed includes TK (tyrosine kinases), TKL (tyrosine kinase-like), CK1 (casein kinase 1), CAMK (calcium/calmodulin-dependent protein kinase), AGC (containing PKA, PKG, PKC families), CMGC (containing CDKs, MAPK, GSK, CLK families), and STE (serine/threonine kinases many involved in MAPK kinases cascade). f Phosphatase obtained mapping to human dephosphorylation database (DEPOD) (www.depod.org). A total of 140 phosphatases were included in the library with the top ten families shown. The phosphatase family abbreviated are RPTPs (receptor protein tyrosine phosphatases), nRPTPs (nonreceptor-type protein tyrosine phosphatases), MKPs (MAPK phosphatases), aDSPs (Atypical DSPs), MTM (Myotubularins), PPM (protein phosphatase Mg2+ or Mn2+ dependent), FCP/SCP (TFIIF-associating component of RNA polymerase II CTD phosphatase/small CTD phosphatase), PAP (Phosphatidic acid phosphatase), INPP5 (Inositol-1,4,5-trisphosphate 5-phosphatase), and PGAM (Phosphoglycerate mutase). Source data are provided as a Source Data file.
Fig. 4
Fig. 4. Comparison of quantification performance in DDA and DIA using cell lysate.
Two NSCLC cell lysate of PC9 and CL68 were processed by both DDA and DIA mode including reverse-phase (RP) fractionation. The DDA data were searched by MaxQuant, whereas DIA was analyzed by Spectronaut in both library-based and direct DIA mode. a Summary of phosphopeptides identified by single-shot DDA, StageTip fractionated DDA (7 fractions run in duplicate), library-based DIA (libDIA), and direct DIA (dirDIA). b Phosphosite identification comparison. The single-shot DDA and DIA were acquired in triplicate. c Overlap of phosphosites between dirDIA and libDIA. d Distribution coefficient of variation, CV% of phosphosites of PC9 cell (n = 9,665 for DDA, 19,007 for dirDIA, and 30,260 for libDIA. A median coefficient of variation (CV) value of 13.0%, 4.3%, and 5.2% were obtained for DDA, dirDIA, and libDIA in PC9, respectively. e Distribution of phosphosite abundance rank of commonly quantified 9456 phosphosites in DDA, DDA match between runs (represented as DDA*), libDIA, and dirDIA. f Phosphosites identification per each abundance group across triplicate measurements. The blue, yellow, and red lines represent sites quantified in all the three, two, or only in one replicate, respectively. g Missing values across different abundance groups. Source data are provided as a Source Data file.
Fig. 5
Fig. 5. Differential phosphoproteome profiling of EGFR-TKI-sensitive and resistant lung cancer cells.
a Experimental design and summary of the identification and quantification results of the proteome and phosphoproteome in EGFR-TKI-sensitive (PC9) and EGFR-TKI-resistant (CL68) lung cancer cells in three biological triplicates. b Pearson’s correlation of phosphosite abundance in biological triplicate analysis. KEGG signaling pathways enriched (p < 0.05) from c upregulated and d downregulated phosphosites/phosphoproteins using STRING (two-sampled t-test, FDR < 0.01, S0 = 0.1). e Overall, 161 phosphosites and 49 proteins were quantified in the EGFR-TKI resistance signaling pathway, revealing differentially expressed proteins (two-sampled t-test, FDR < 0.01, S0 = 0.4) and phosphosites (two-sampled t-test, FDR < 0.01, S0 = 0.1). f Kinase motfi enrichment analysis using Fisher’s exact test (FDR < 0.02) where top ones shown among 30 kinase motifs. g Motif logo for ERK1, 2, and PKA or PKC kinases extracted by pLOGO (https://plogo.uconn.edu/). h Tyrosine phosphosites showing differential expression levels between the two cell lines (two-sampled t-test, FDR < 0.01, S0 = 0.1). Source data are provided as a Source Data file.
Fig. 6
Fig. 6. Phosphoproteome profiling of lung cancer tissues.
a Summary of phosphosite and protein-level identification results in each tumor (T) and adjacent normal (N) lung cancer tissue. b Principal component (PC) analysis of tumor and adjacent normal tissues using differentially expressed sites normalized to protein level (two-sampled t-test, p < 0.05, S0 = 0.1). c Unsupervised clustering of 585 (normalized) differentially expressed phosphosites between tumor and normal tissues (two-sampled t-test, p < 0.05, S0 = 0.1). d Pathway analysis of upregulated phosphosites by the Kyoto Encyclopedia of Genes and Genomes (KEGG) database (FDR < 0.05). e Differentially expressed phosphosites showing increasing or decreasing expression between early and late stages (two-sampled t-test, p < 0.05, S0 = 0.1). Protein–protein interaction network and functional category of phosphoproteins for f upregulated in the early and g upregulated in late stages filtered with medium confidence and FDR < 0.05 in STRING database (https://string-db.org/). Source data are provided as a Source Data file.

References

    1. Needham EJ, Parker BL, Burykin T, James DE, Humphrey SJ. Illuminating the dark phosphoproteome. Sci. Signal. 2019;12:eaau8645. doi: 10.1126/scisignal.aau8645. - DOI - PubMed
    1. Riley NM, Coon JJ. Phosphoproteomics in the age of rapid and deep proteome profiling. Anal. Chem. 2016;88:74–94. doi: 10.1021/acs.analchem.5b04123. - DOI - PMC - PubMed
    1. de Graaf EL, Giansanti P, Altelaar AFM, Heck AJR. Single-step enrichment by Ti4+-IMAC and label-free quantitation enables in-depth monitoring of phosphorylation dynamics with high reproducibility and temporal resolution. Mol. Cell. Proteomics. 2014;13:2426. doi: 10.1074/mcp.O113.036608. - DOI - PMC - PubMed
    1. Humphrey SJ, Karayel O, James DE, Mann M. High-throughput and high-sensitivity phosphoproteomics with the EasyPhos platform. Nat. Protoc. 2018;13:1897–1916. doi: 10.1038/s41596-018-0014-9. - DOI - PubMed
    1. Olsen JV, et al. Global, in vivo, and site-specific phosphorylation dynamics in signaling networks. Cell. 2006;127:635–648. doi: 10.1016/j.cell.2006.09.026. - DOI - PubMed

Publication types