. 2021 May 5;11(1):9572.
doi: 10.1038/s41598-021-88985-z.

FoldAffinity: binding affinities from nDSF experiments

Affiliations

FoldAffinity: binding affinities from nDSF experiments

Stephan Niebling et al. Sci Rep. .

Abstract

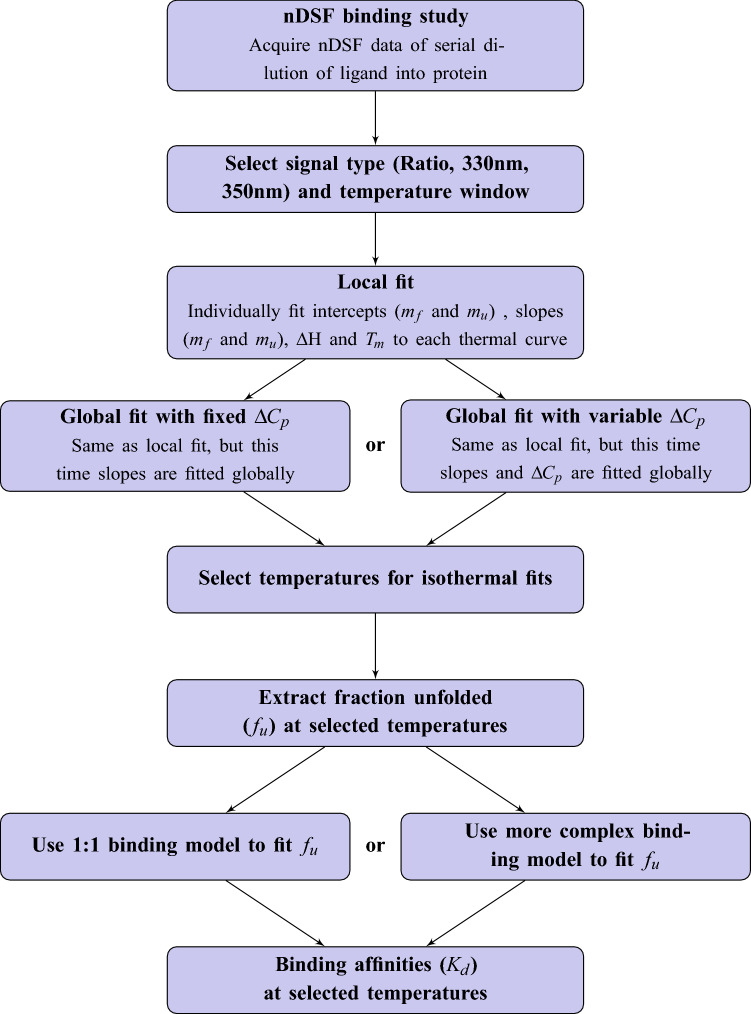
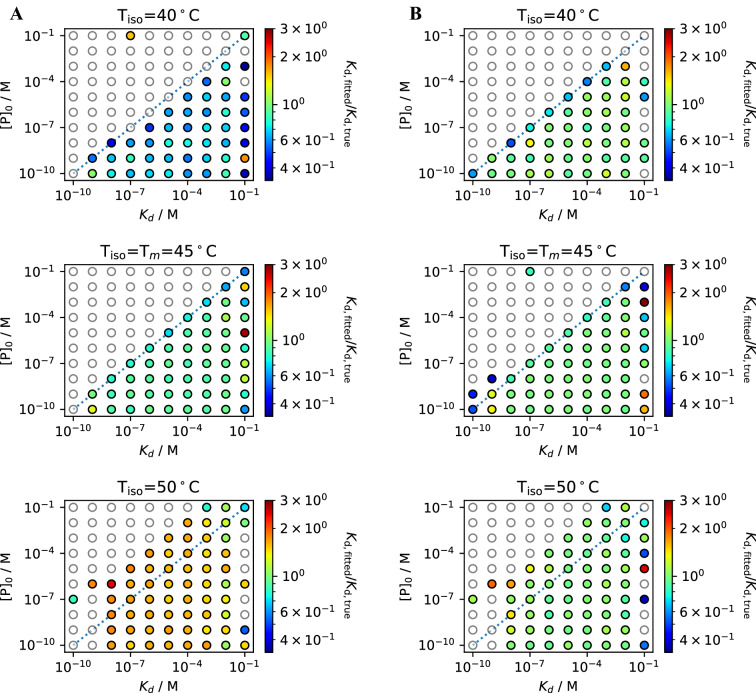
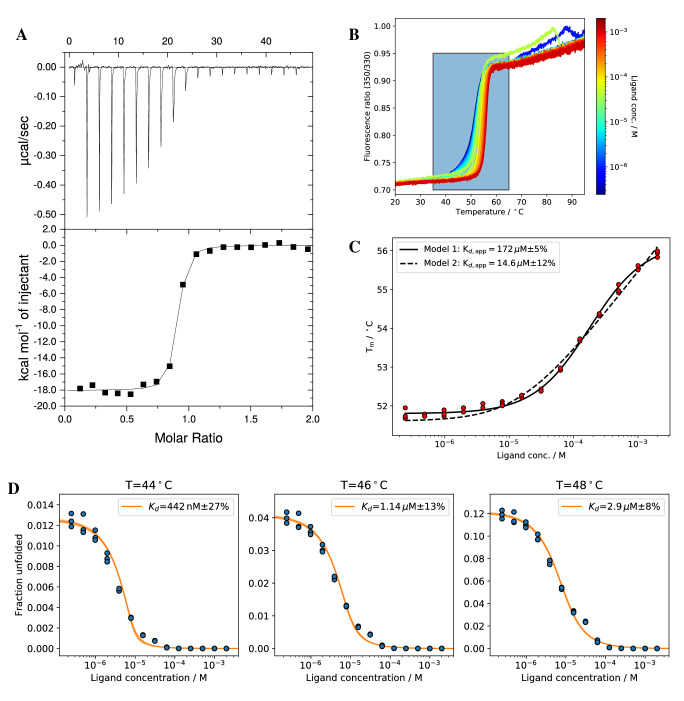
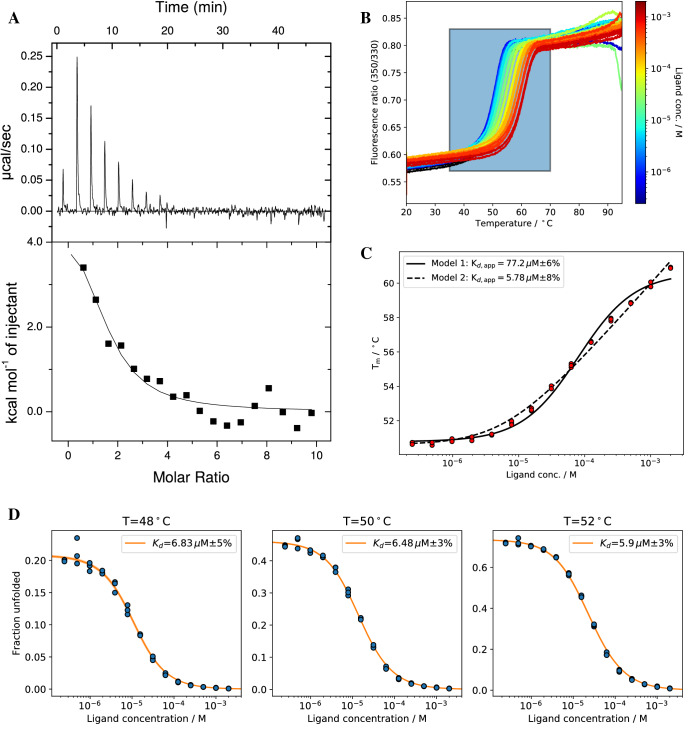
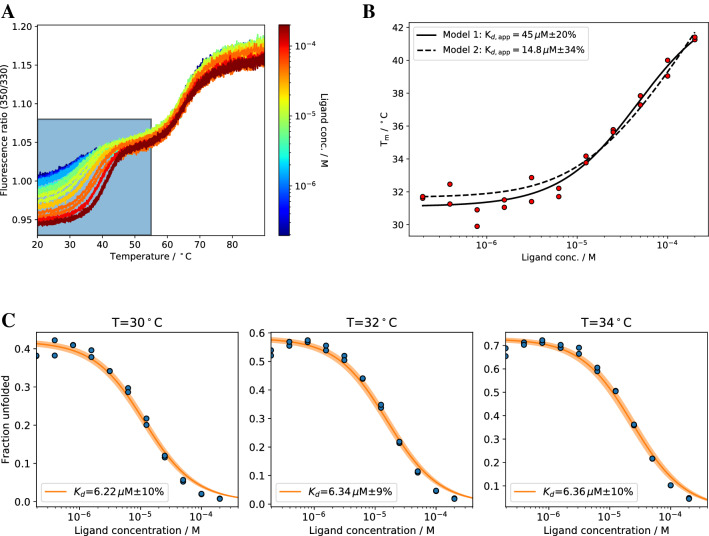
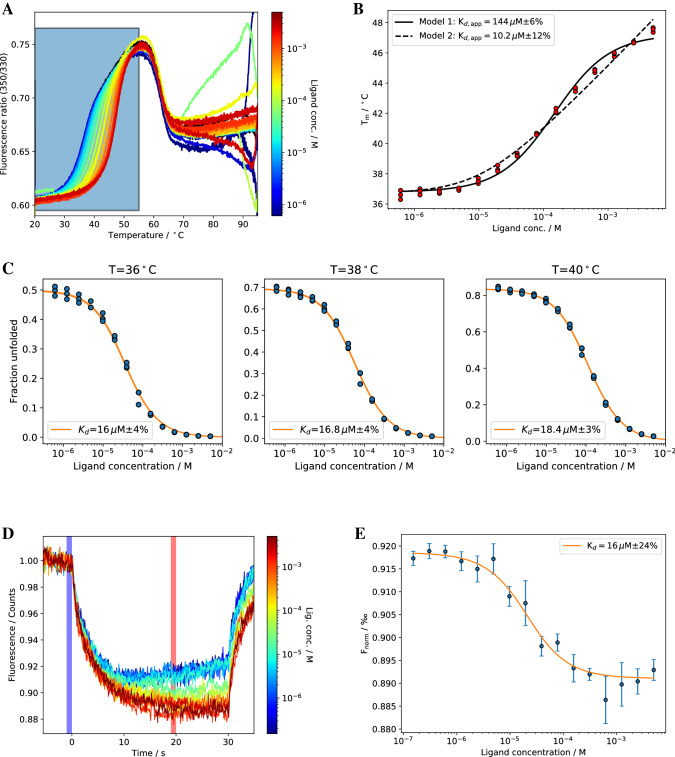
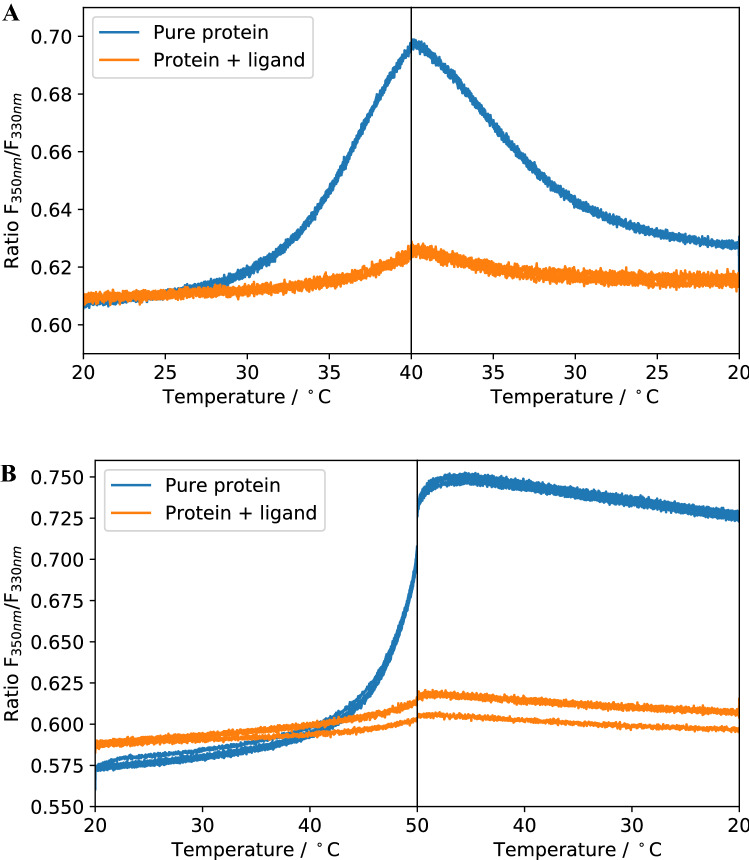
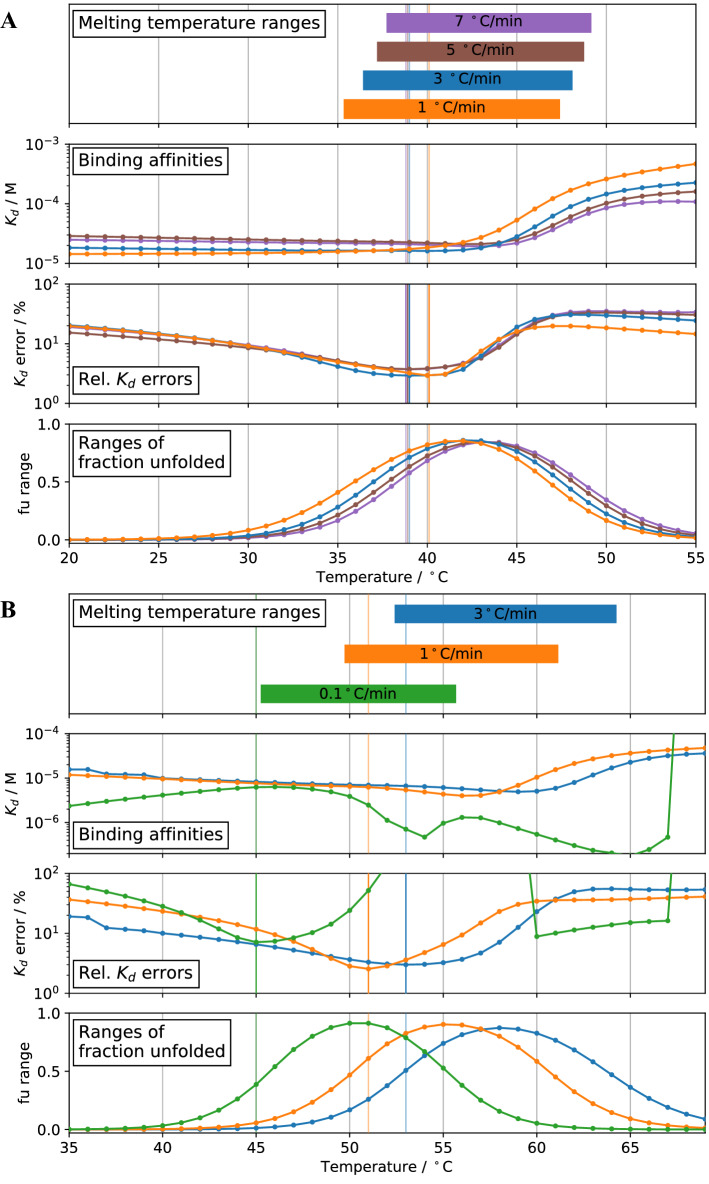
Differential scanning fluorimetry (DSF) using the inherent fluorescence of proteins (nDSF) is a popular technique to evaluate thermal protein stability in different conditions (e.g. buffer, pH). In many cases, ligand binding increases thermal stability of a protein and often this can be detected as a clear shift in nDSF experiments. Here, we evaluate binding affinity quantification based on thermal shifts. We present four protein systems with different binding affinity ligands, ranging from nM to high μM. Our study suggests that binding affinities determined by isothermal analysis are in better agreement with those from established biophysical techniques (ITC and MST) compared to apparent Kds obtained from melting temperatures. In addition, we describe a method to optionally fit the heat capacity change upon unfolding ([Formula: see text]) during the isothermal analysis. This publication includes the release of a web server for easy and accessible application of isothermal analysis to nDSF data.


Conflict of interest statement

The authors declare no competing interests.

Figures

Figure 1
Figure 1
Flow chart of isothermal analysis of nDSF binding study. After selecting the signal type (F330, F350 or Ratio) and the spectral window, a local fit of the thermal curves yields starting values for the subsequent global fit. This can be either done with a fixed ∆Cp or with ∆Cp as fitted variable. The latter option is still an experimental feature. The next step is the calculation of the fraction unfolded fu for selected temperatures. Fitting these fu with a suitable binding model then yields a binding affinity for each selected temperature. A detailed description of the isothermal fitting routine can be found in Supplementary Information S10.
Figure 2
Figure 2
Kd fits for simulated data with ∆Cp = 8 kcal/mol K and 2% noise. Kd deviations Kd,fittedKd,true are color coded with green corresponding to the initial value. Datesets outside the range are shown as white circles. Fitting the ∆Cp during the thermal curve fitting process results in better agreement with the initial Kd values (B) compared to fits with a fixed ∆Cp = 0 kcal/mol K (A). The fitted ∆Cp values are shown in Supplementary Information S22–S23.
Figure 3
Figure 3
(A) The Buffer subtracted ITC of EG1/ADPR yields Kd = 16 ± 4 nM (3 measurements) (B) nDSF signal (Ratio) for EG1/ADPR binding study with a protein concentration of 8 µM and ligand concentrations between 2 mM and 24 nM (14 dilutions). The region in the colored box was used for isothermal analysis (shown in D). (C) Melting temperature analysis with two different models yields apparent Kd,app values. (D) Isothermal analysis of nDSF data for ∆Cp = 0 at three selected temperatures. The same analysis for a fitted ∆Cp (cf. Table 1) is shown in Supplementary Information S25.
Figure 4
Figure 4
(A) The buffer subtracted ITC experiment for SS1/ADPR yields a Kd = 3.5 µM (B) nDSF signal (fluorescence ratio F350/330) for SS1/ADPR binding study. The region in the colored box was used for isothermal analysis (shown in D). The ligand concentrations are color code from blue (low conc.) to red (high conc). The apo protein spectrum in absence of ligand is shown in black. (C) Melting temperature analysis with two different models yields apparent Kd,app values. (D) Isothermal analysis of nDSF data for ∆Cp = 0 at three selected temperatures. The same analysis for a fitted ∆Cp (cf. Table 1) is shown in Supplementary Information S26.
Figure 5
Figure 5
(A) nDSF binding study between MHC and the peptide NT8 (fluorescence ratio F350/330). The region in the colored box was used for isothermal analysis (shown in C). The ligand concentrations are color code from blue (low conc.) to red (high conc). (B) Melting temperature analysis with two different models yields apparent Kd,app values. (C) Isothermal analysis with a ∆Cp = 0. The same analysis for a fitted ∆Cp is show in supplementary information S27.
Figure 6
Figure 6
(A) nDSF signal (fluorescence ratio) for Pcs60/γS-ATP titration. The region in the colored box was used for isothermal analysis (shown in C). (B) Melting temperature analysis with two different models yields apparent Kd,app values. (C) Isothermal analysis of nDSF data for ∆Cp = 0 at three selected temperatures. The same analysis for a fitted ∆Cp (cf. Table 1) is shown in supplementary information S28. (D) MST experiment with Pcs60/γS-ATP. The “cold” and “hot” regions used for calculating Fnorm are marked as blue and red shadows, respectively. (E) Fitting Fnorm to a 1:1 model yields a Kd of 16 µM.
Figure 7
Figure 7
Refolding experiment with Pcs60 (A) and SS1 (B) with a maximum temperature set to the temperature at which Kd values were extracted by isothermal analysis in Figs. 4 and 6 (40 °C for Pcs60 and 50 °C for SS1). Refolding experiment for Pcs60 up to 50 °C and SS1 up to 45 °C are shown in S32.
Figure 8
Figure 8
Isothermal analysis at different heating rates for Pcs60/γS-ATP (A) and SS1/ADPR (B). For all datasets, the ∆Cp = 0 was assumed. The binding affinities were extracted at the temperature with minimum Kd fitting error marked by vertical lines (lines are horizontally shifted for visibility). All temperature and values are summarized in Table 3. The analyses for a fitted ∆Cp for a heating rate of 1 °C/min (cf. Table 1) are shown in Supplementary Information S33.

References

    1. Linkuvienė V, et al. Thermodynamic, kinetic, and structural parameterization of human carbonic anhydrase interactions toward enhanced inhibitor design. Q. Rev. Biophys. 2018 doi: 10.1017/s0033583518000082. - DOI - PubMed
    1. Wienken CJ, Baaske P, Rothbauer U, Braun D, Duhr S. Protein-binding assays in biological liquids using microscale thermophoresis. Nat. Commun. 2010 doi: 10.1038/ncomms1093. - DOI - PubMed
    1. Seidel SAI, et al. Label-free microscale thermophoresis discriminates sites and affinity of protein-ligand binding. Angew. Chem. Int. Ed. 2012;51:10656–10659. doi: 10.1002/anie.201204268. - DOI - PMC - PubMed
    1. Kairys V, Baranauskiene L, Kazlauskiene M, Matulis D, Kazlauskas E. Binding affinity in drug design: Experimental and computational techniques. Expert. Opin. Drug Discov. 2019;14:755–768. doi: 10.1080/17460441.2019.1623202. - DOI - PubMed
    1. Sandoval PJ, Santiago J. In vitro analytical approaches to study plant ligand-receptor interactions. Plant Physiol. 2020;182:1697–1712. doi: 10.1104/pp.19.01396. - DOI - PMC - PubMed

Publication types