. 2021 Jul;14(4):862-872.
doi: 10.1038/s41385-021-00406-6. Epub 2021 May 5.

The human memory T cell compartment changes across tissues of the female reproductive tract

Affiliations

The human memory T cell compartment changes across tissues of the female reproductive tract

Amanda S Woodward Davis et al. Mucosal Immunol. 2021 Jul.

Abstract

Memory CD4 T cells in tissues fulfill numerous functions that are critical for local immune homeostasis and protection against pathogens. Previous studies have highlighted the phenotypic and functional heterogeneity of circulating and tissue-resident memory CD4 T cells across different human tissues such as skin, lung, liver, and colon. Comparatively little is known in regard to memory CD4 T cells across tissues of the female reproductive tract (FRT). We examined CD4 T cells in donor-matched vaginal, ecto- and endocervical tissues, which differ in mucosal structure and exposure to external environmental stimuli. We hypothesized that this could be reflected by tissue-specific differences in the memory CD4 T cell compartment. We found differences in CD4 subset distribution across these tissues. Specifically, CD69+CD103+ CD4 T cells were significantly more abundant in vaginal than cervical tissues. In contrast, the transcriptional profiles of CD4 subsets were fairly conserved across FRT tissues. CD69+CD103+ CD4 T cells showed a TH17 bias independent of tissue niche. Our data suggest that FRT tissues affect T cell subset distribution but have limited effects on the transcriptome of each subset. We discuss the implications for barrier immunity in the FRT.


Conflict of interest statement

Conflict of Interest Statement

The authors declare no conflict.

Figures

Figure 1.
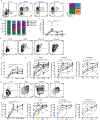
Figure 1.. Distinct CD4 to CD8 T cell ratios in FRT tissues.
(A) Gating strategy for CD8 and CD4 T cells (top) and exclusion of CD25+CD127lo Treg from CD4 T cells (bottom) in blood, vagina (VT), ectocervix (EctoCx) and endocervix (EndoCx). Gated on Live, CD45+CD3+ cells. Numbers indicate percentages of the parent population. (B) Diagram of VT, EctoCx and EndoCx within the female reproductive tract. (C) Ratio of CD4 to CD8 T cells. Lines connect samples from individual donors where all four compartments are represented. (D) Representative flow plots and (E) quantification of the memory (CCR7 and CD45RA) phenotype for CD4 Tconv cells. (Blood n=9, VT n=13, EctoCx n=10, EndoCx n=10) *p≤0.05 **p≤0.01 ***p≤0.001 ****p≤0.0001 generated by repeated measures one-way ANOVA with Tukey’s post-test
Figure 2.
Figure 2.. CD69+CD103+ cells are enriched in the vaginal tissue and express high levels of PD-1 and CCR5.
(A) Representative flow plots for tissue memory (CD69 and CD103) phenotype of CD4 Tconv cells. Gated on Live, CD45+, CD3+, CD4+, CD25 CD127+ cells (B) Proportions of CD69+CD103 (purple), CD69+CD103+ (blue), CD69CD103+ (orange) and CD69CD103 (green) and (C) percent of CD69+CD103+ on CD4 Tconv cells in blood n=8, vagina (VT) n=14, ectocervix (EctoCx) n=9, and endocervix (EndoCx) n=9. Lines connect samples from individual donors where all four compartments are represented. (D) Representative flow plots and (E) quantification of PD-1 positive CD4 Tconv cells in blood and mucosal tissues. Gated on Live, CD45+, CD3+, CD4+, CD25CD127+ cells. (F) Percent PD-1+CD4+ T cell in each memory population subset. Lines connect samples from individual donors where all four compartments are represented. (G) Representative flow plots and (H) quantification of CCR5 positive CD4 Tconv cells in blood and mucosal tissues. Gated on Live, CD45+, CD3+, CD4+, CD25CD127+ cells. (I) Percent CCR5+CD4+ T cell in each memory population subset. Lines connect samples from individual donors where all four compartments are represented. *p≤0.05 **p≤0.01 ***p≤0.001 ****p≤0.0001 generated by repeated measures one-way ANOVA with Tukey’s post-test
Figure 3.
Figure 3.. CD69+CD103+ CD4 T cells sorted from vaginal tissue have a unique transcriptional profile.
(A) Schematic diagram showing experimental setup for RNA-Seq experiment and representative flow plots and RNAseq sort gates for CD69CD103 (green), CD69+CD103 (purple) and CD69+CD103+ (blue) CD4 T cells. Cells were gated on Live, CD45+CD3+CD4+CCR7. (n=4 donors) (B) The number of DEGs between tissue memory CD4 T cell comparisons in the vagina. (C) The percentage of overlapping DEGs represented by circles for each cell subset comparison in the vagina. Percentages were calculated by dividing the number of shared DEGs between two cell subsets by the total number of DEGs. Larger circles represent more overlapping genes and smaller circles represent fewer overlapping genes. (D) Heatmap of DEGs from cell populations sorted from the vagina. An absolute log-2-fold change cutoff of 1 and an FDR cutoff of 5% were used to determine DEGs. Only the top DEGs from each comparison are shown.
Figure 4.
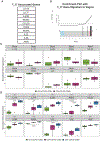
Figure 4.. CD69+CD103+ CD4 TRM cells in VT are enriched for a TH17 gene signature.
(A) List of TH17 associated genes used for gene set enrichment analysis. (B) Gene set enrichment analysis showing TH17 associated genes upregulated (red) or downregulated (blue) in CD69+CD103+ cells isolated from the vagina compared to CD69+CD103 CD4 T cells. (C) Boxplot graph showing normalized gene expression levels of TH17 associated genes in CD69CD103 (green) and CD69+CD103 (purple) in the blood. (D) Boxplot graph of normalized gene expression levels of Th17 associated genes in CD69CD103 (green), CD69+CD103 (purple), and CD69+CD103+ (blue) from the vagina. (C-D) Each dot represents cells sorted from one individual (n=4).
Figure 5.
Figure 5.. IL-17A in the VT is primarily produced by CD69+CD103+ CD4 TRM.
CD4 Tconv cells isolated from vaginal tissue were stimulated with PMA/lonomycin (or left unstimulated), stained for tissue memory markers and IL-17A production, and analyzed by flow cytometry. A sufficient number of T cells to undergo stimulation was isolated from tissues in three individuals, but only two individuals had enough cells to adequately examine CD69 and CD103 expressing populations. Representative flow plots (A-B) and quantification (C) from two individuals looking at percent IL-17A positive of CD4 Tconv in tissue memory subsets CD69CD103 (green), CD69+CD103 (purple), and CD69+CD103+ (blue). (D) Cells were gated on lymphocytes, then live, CD45+, CD3+, and CD4+ T cells, then gated on the CD45RA-CCR7+, CD45RA-CCR7-, and CD45RA+CCR7- T cell subsets, excluding CD45RA+CCR7+ naive cells from analysis. Percent IL-17A of CD4+ Tconv cells in the blood compared to the vagina (n=3). *p≤0.05 generated by two-tailed paired T test.
Figure 6.
Figure 6.. CD69+CD103+ CD4 TRM TH17 gene enrichment is conserved across adjacent mucosal tissues.
(A) Gene set enrichment analysis showing TH17 associated genes upregulated (red) or downregulated (blue) in CD69+CD103+ compared to CD69+CD103cells isolated from the ectocervix (EctoCx) (B) Boxplot graph showing normalized gene expression levels of TH17 associated genes in CD69CD103 (green), CD69+CD103 (purple), and CD69+CD103+ (blue) in the EctoCx. (C) Gene set enrichment analysis showing TH17 associated genes upregulated (red) or downregulated (blue) in CD69+CD103+ compared to CD69+CD103cells isolated from the endocervix (EndoCx) (D) Boxplot graph of normalized gene expression levels of TH17 associated genes in CD69CD103 (green), CD69+CD103 (purple), and CD69+CD103+ (blue) from the EndoCx. Each dot represents cells sorted from one individual (n=4).
Figure 7.
Figure 7.. Tissue-memory CD4 T cell subsets in adjacent mucosal sites have largely shared transcriptional profiles.
(A) RNAseq sort gates for CD69CD103 (green), CD69+CD103 (purple) and CD69+CD103+ (blue) CD4 T cells. Cells were gated on Live, CD45+CD3+CD4+CCR7. (n=4 donors) (B) The number of DEGs between tissue memory CD4 T cell comparisons in the blood, vagina, ectocervix (EctoCx), and endocervix (EndoCx).

References

    1. Williams MA & Bevan MJ Effector and memory CTL differentiation. Annu Rev Immunol 25, 171–192, doi:10.1146/annurev.immunol.25.022106.141548 (2007). - DOI - PubMed
    1. Sallusto F, Lenig D, Forster R, Lipp M & Lanzavecchia A Two subsets of memory T lymphocytes with distinct homing potentials and effector functions. Nature 401, 708–712, doi:10.1038/44385 (1999). - DOI - PubMed
    1. Sathaliyawala T et al. Distribution and compartmentalization of human circulating and tissue-resident memory T cell subsets. Immunity 38, 187–197, doi:10.1016/j.immuni.2012.09.020 (2013). - DOI - PMC - PubMed
    1. Ariotti S, Haanen JB & Schumacher TN Behavior and function of tissue-resident memory T cells. Adv Immunol 114, 203–216, doi:10.1016/B978-0-12-396548-6.00008-1 (2012). - DOI - PubMed
    1. Milner JJ & Goldrath AW Transcriptional programming of tissue-resident memory CD8(+) T cells. Curr Opin Immunol 51, 162–169, doi:10.1016/j.coi.2018.03.017 (2018). - DOI - PMC - PubMed

Publication types