. 2021 Jul;27(7):1178-1186.
doi: 10.1038/s41591-021-01355-0. Epub 2021 May 5.

Delayed production of neutralizing antibodies correlates with fatal COVID-19

Collaborators, Affiliations

Delayed production of neutralizing antibodies correlates with fatal COVID-19

Carolina Lucas et al. Nat Med. 2021 Jul.

Erratum in

  • Author Correction: Delayed production of neutralizing antibodies correlates with fatal COVID-19.
    Lucas C, Klein J, Sundaram ME, Liu F, Wong P, Silva J, Mao T, Oh JE, Mohanty S, Huang J, Tokuyama M, Lu P, Venkataraman A, Park A, Israelow B, Vogels CBF, Muenker MC, Chang CH, Casanovas-Massana A, Moore AJ, Zell J, Fournier JB; Yale IMPACT Research Team; Wyllie AL, Campbell M, Lee AI, Chun HJ, Grubaugh ND, Schulz WL, Farhadian S, Dela Cruz C, Ring AM, Shaw AC, Wisnewski AV, Yildirim I, Ko AI, Omer SB, Iwasaki A. Lucas C, et al. Nat Med. 2021 Jul;27(7):1309. doi: 10.1038/s41591-021-01416-4. Nat Med. 2021. PMID: 34145437 Free PMC article. No abstract available.

Abstract

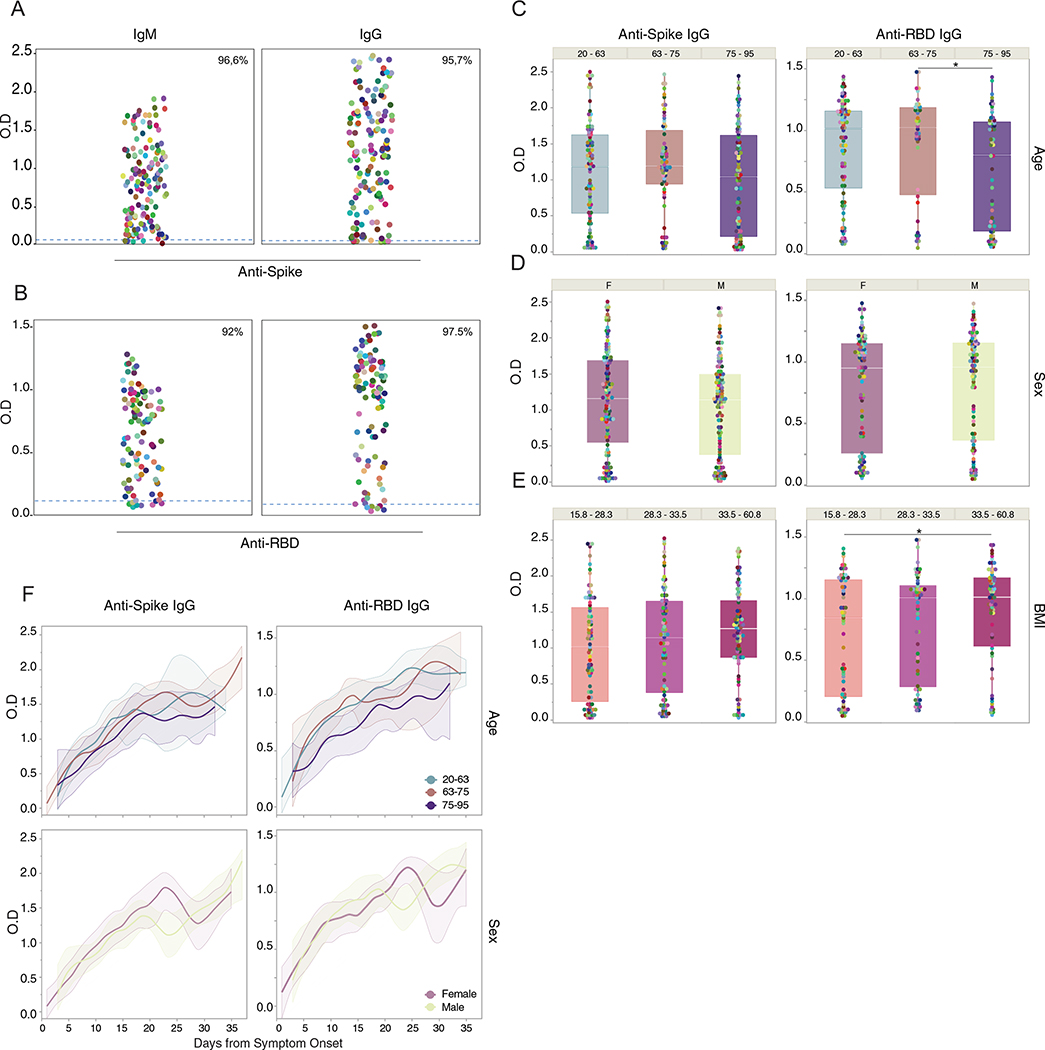
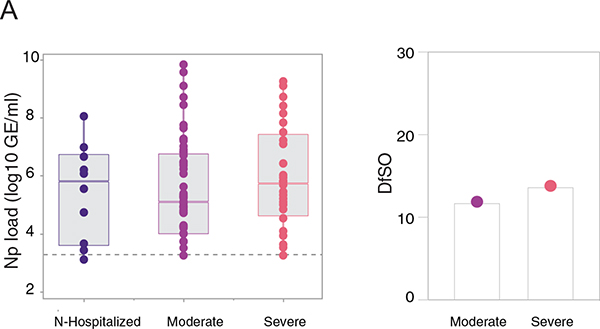
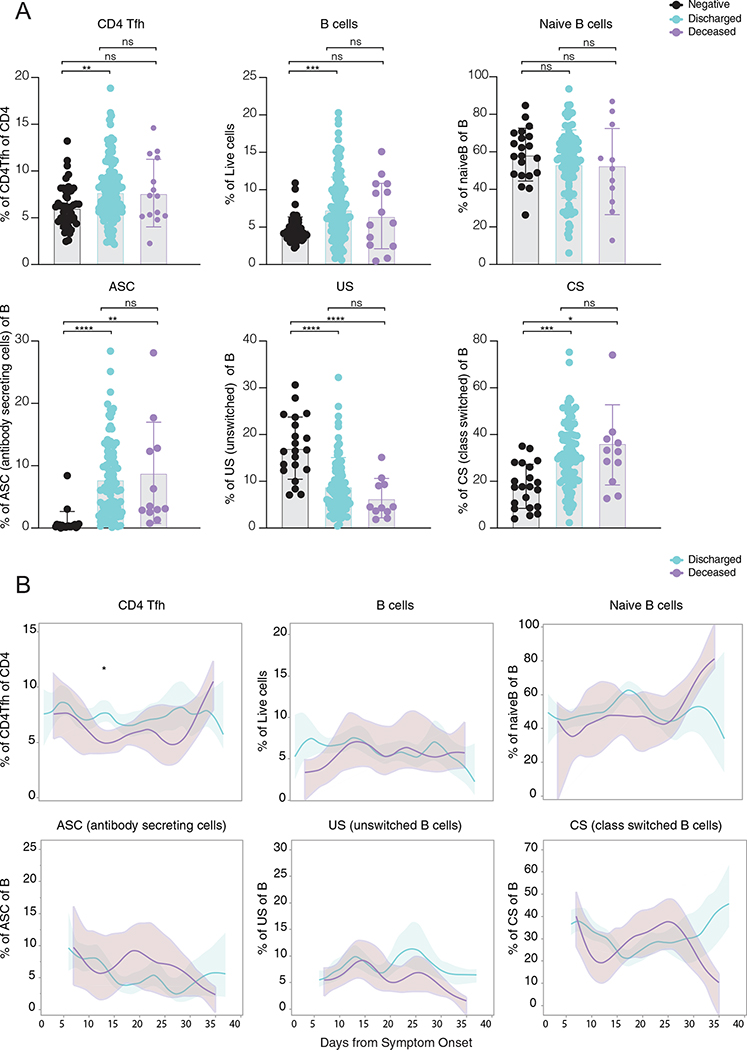
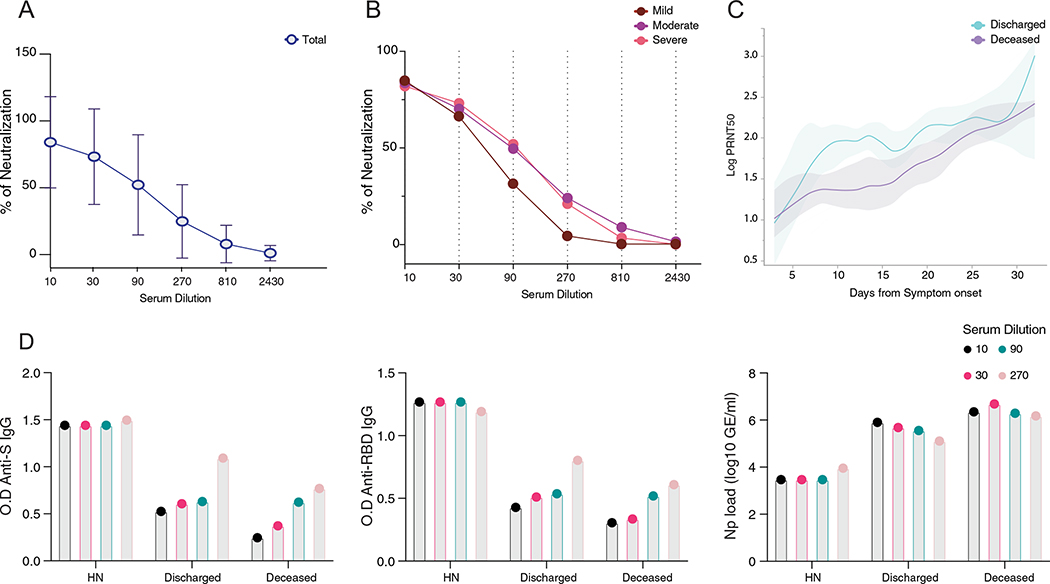
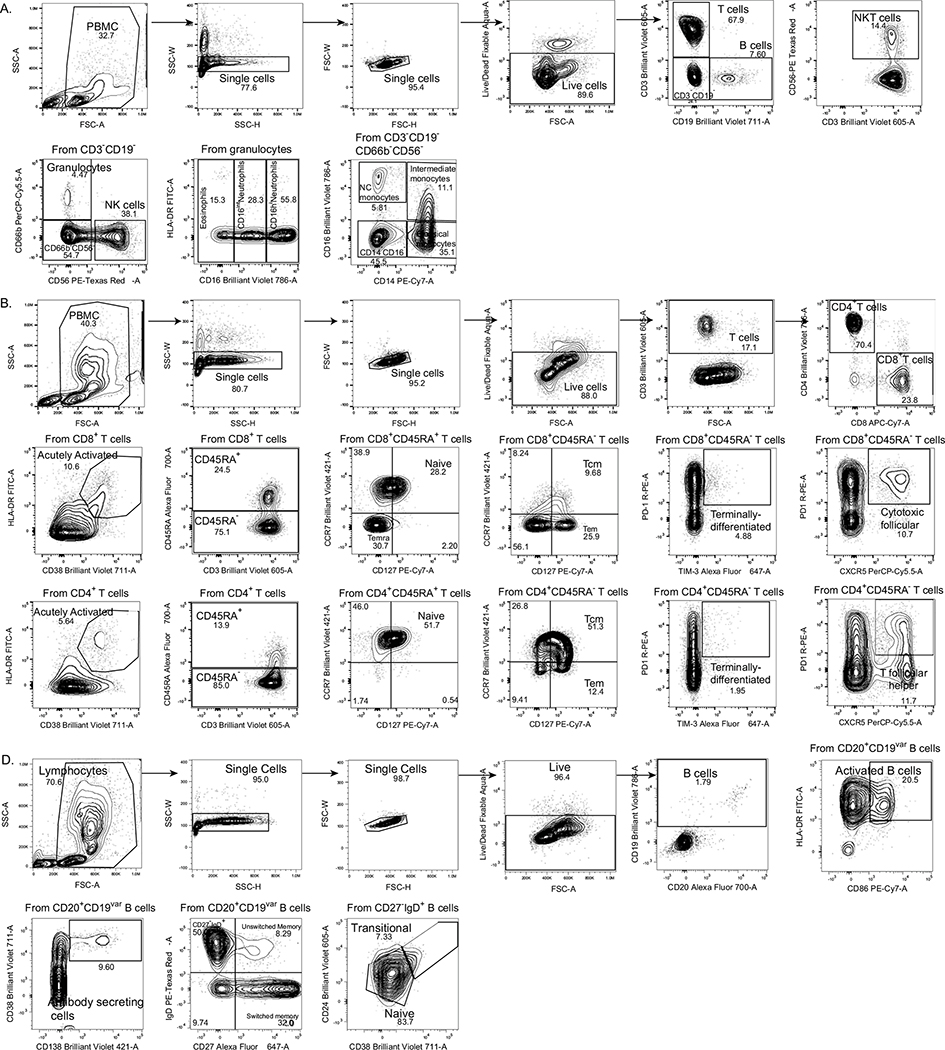
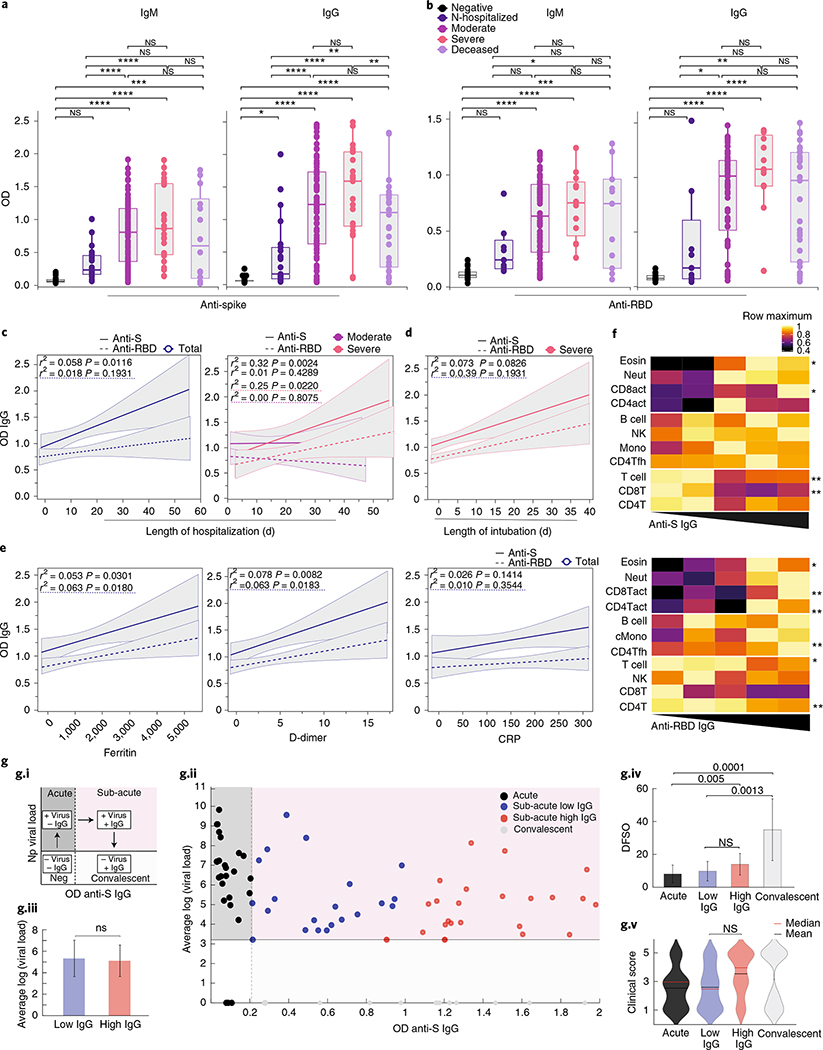
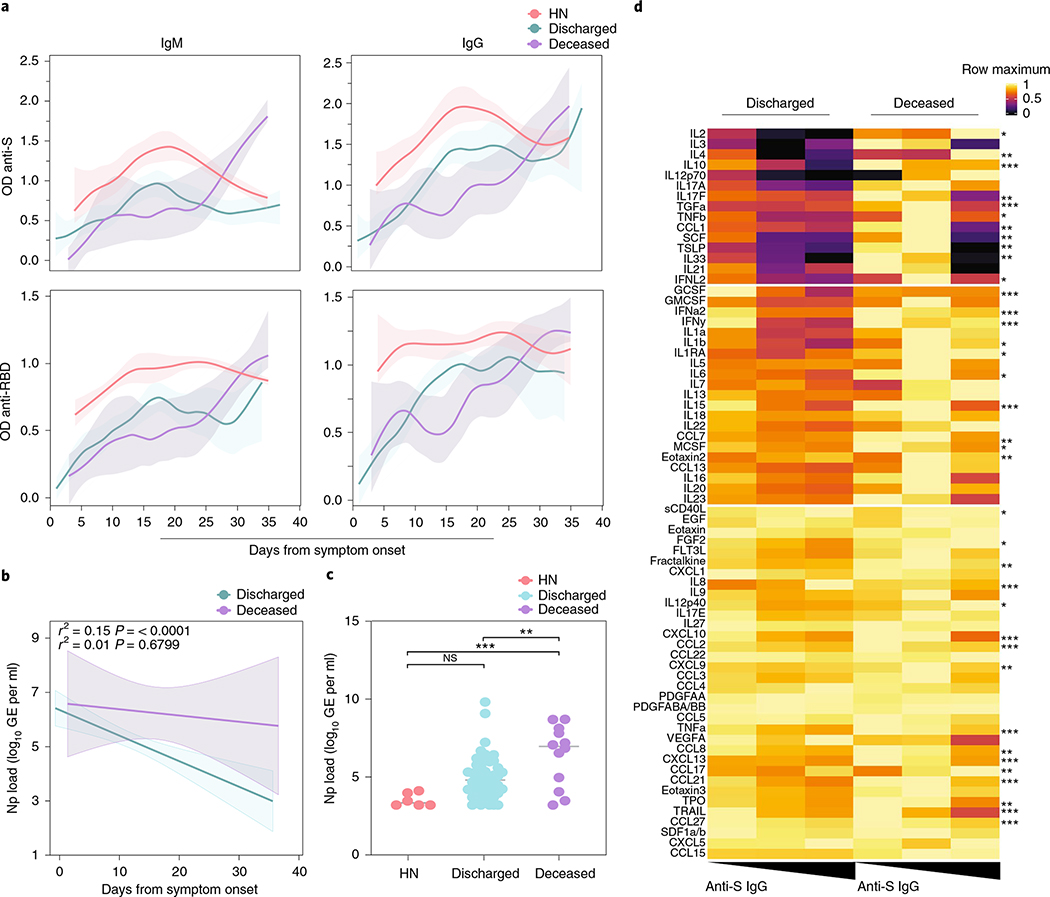
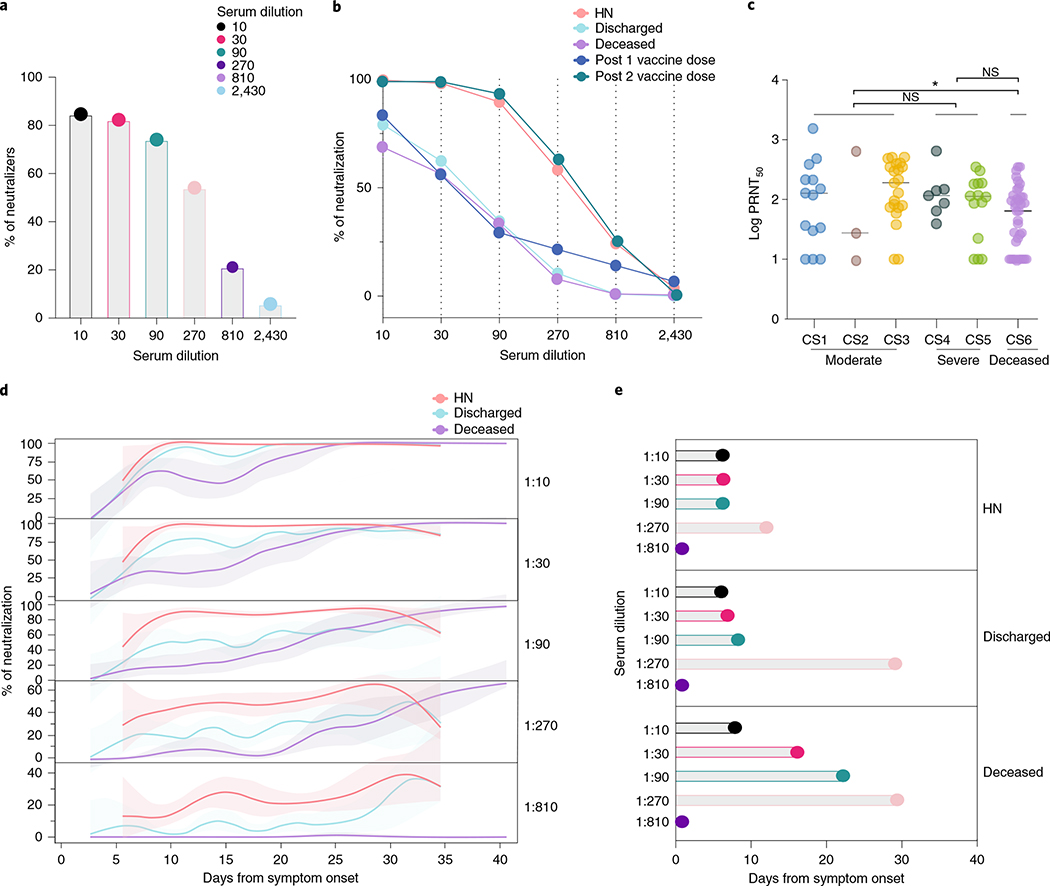
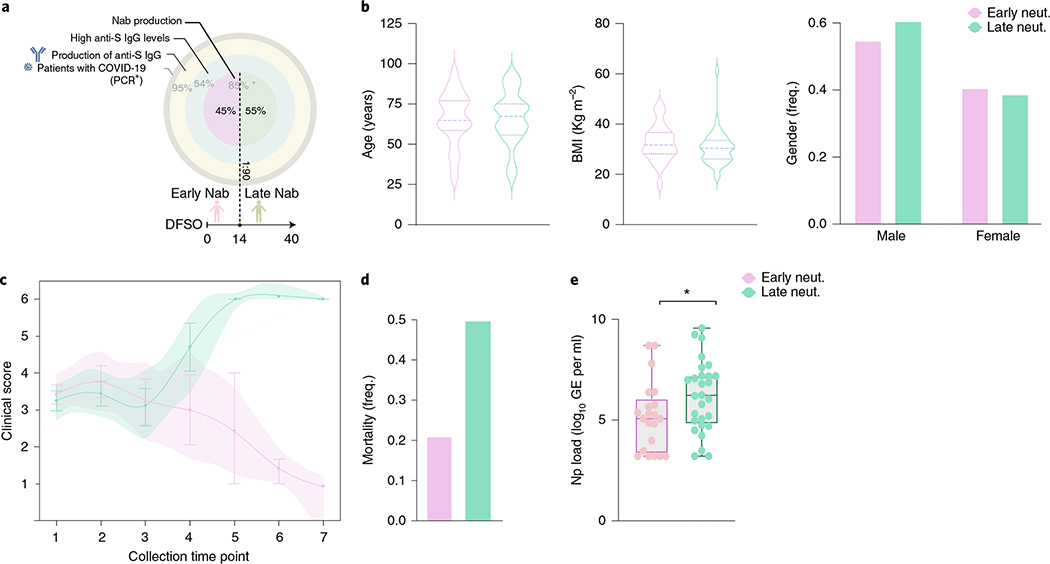
Recent studies have provided insights into innate and adaptive immune dynamics in coronavirus disease 2019 (COVID-19). However, the exact features of antibody responses that govern COVID-19 disease outcomes remain unclear. In this study, we analyzed humoral immune responses in 229 patients with asymptomatic, mild, moderate and severe COVID-19 over time to probe the nature of antibody responses in disease severity and mortality. We observed a correlation between anti-spike (S) immunoglobulin G (IgG) levels, length of hospitalization and clinical parameters associated with worse clinical progression. Although high anti-S IgG levels correlated with worse disease severity, such correlation was time dependent. Deceased patients did not have higher overall humoral response than discharged patients. However, they mounted a robust, yet delayed, response, measured by anti-S, anti-receptor-binding domain IgG and neutralizing antibody (NAb) levels compared to survivors. Delayed seroconversion kinetics correlated with impaired viral control in deceased patients. Finally, although sera from 85% of patients displayed some neutralization capacity during their disease course, NAb generation before 14 d of disease onset emerged as a key factor for recovery. These data indicate that COVID-19 mortality does not correlate with the cross-sectional antiviral antibody levels per se but, rather, with the delayed kinetics of NAb production.


Conflict of interest statement

Competing interests

A.I. served as a consultant for Spring Discovery, Boehringer Ingelheim and Adaptive Biotechnologies. I.Y. reports being a member of the mRNA-1273 Study Group and has received funding to her institution to conduct clinical research from BioFire, MedImmune, Regeneron, PaxVax, Pfizer, GlaxoSmithKline, Merck, Novavax, Sanofi-Pasteur and Micron. All other authors declare no competing financial interests.

Figures

Extended Data Fig. 1 |
Extended Data Fig. 1 |. Correlation analysis of virus-specific antibodies and age, sex and BMI.
a-e, Plasma reactivity to S protein and RBD by ELISA. a, Anti-S IgM and IgG of total COVID-19 patients regardless of disease severity. Patients, IgM (n = 139); IgG (n = 159). b, Anti-RBD IgM and IgG of total COVID-19 patients regardless of disease severity. Patients, IgM (n = 99); IgG (n = 120). Each color dot represents a single individual at its maximum antibody titer over the disease course. Dashed line indicates HCW average values (limit threshold). HCW, Anti-S IgM (n = 21); IgG (n = 87); HCW, Anti-RBD IgM (n = 21); IgG (n = 21). IgG levels of Anti-S (left) or Anti-RBD (right) by (c) age, (d) sex and (e) BMI. Each dot represents a single individual at its maximum antibody titer over the disease course. Boxes represent variables’ distribution with quartiles and outliers. Horizontal bars indicate mean values. OD, optical density at 450 nm (OD450 nm). F, females; M, males. One-way ANOVA corrected for multiple comparisons using Tukey’s and unpaired t-test (two-tailed) were used to determine significance. Anti-RBD IgG *p = 0.0130 (age); *p = 0.0301 (BMI). f, IgG levels of Anti-S (left) or Anti-RBD by age and sex. Longitudinal analysis over time. Lines indicate cross-sectional averages from each group, with shading representing 95% CI and colored accordingly.
Extended Data Fig. 2 |
Extended Data Fig. 2 |. SARS-CoV-2 viral load and disease severity.
a, Left, Viral load measured by nasopharyngeal swabs plotted as log10 of genome equivalents in non-hospitalized and hospitalized, moderate and severe COVID-19 patients. (N-hospitalized, n = 10; moderate, n = 97; severe, n = 65). Each dot represents a single individual at its maximum viral titer over the disease course. Dashed line indicates threshold for positivity. Boxes represent variables’ distribution with quartiles and outliers. Horizontal bars indicates mean values. Right, Average of days from symptom onset (DfSO) comparison between groups. N-hospitalized, non-hospitalized. One-way ANOVA corrected for multiple comparisons using Tukey’s were used to determine significance.
Extended Data Fig. 3 |
Extended Data Fig. 3 |. Overview of cellular immune profiles in COVID-19 patients.
a,b, Immune cell subsets of interest, plotted as a percentage of a parent population as (a) aggregate and (b) continuously over time according to the days of symptom onset for discharged or deceased patients. a, Immune cell subsets comparison in discharged or deceased patients. Negative controls (HCWs) are shown in black. Each dot represents a single individual at its maximum antibody titer over the disease course. Grey bars indicate mean values. ANOVA corrected for multiple comparisons using Tukey’s were used to determine significance. b, Longitudinal data plotted over time continuously. Regression lines are shown as light blue (discharged) and purple (deceased) and indicate cross-sectional averages from each group with shading representing 95% CI and are coloured accordingly. (HCW, n = 49; Discharged, n = 118; Deceased, n = 15). CD4Tfh, follicular helper T cells. ASC, antibody secreting cells. US, unswitched. CS, class switched.
Extended Data Fig. 4 |
Extended Data Fig. 4 |. Virus-specific antibodies and viral load correlation with PRNT50.
a,b, Neutralization capacity among (a) total COVID-19 patients or (b) between mild (dark red), moderate (purple) and severe (pink) at the experimental sixfold serially dilutions (from 1:3 to 1:2430). Lines represent average ± standard deviations. Total patients, n = 63; Moderate, n = 45; Severe, n = 19. Pearson correlation analysis were used to accessed significance. moderate: R2 0.575, p(two-tailed) 0.0804; severe: R2 0.552, p(two-tailed) 0.0902; c, Longitudinal data plotted over time of PRNT50 between discharged (light blue) and deceased (purple). Lines indicates cross-sectional averages from each group, with shading representing 95% CI and colored accordingly. d, Levels of IgG (left) Anti-S, (middle) RBD and (right) viral load between high neutralizers, deceased and discharged patients. The indicated levels were measured at the average day from symptom onset in which each group reach 50% of neutralization at each experimental serum dilution as specified in Fig. 3f. HN, high neutralizers.
Extended Data Fig. 5 |
Extended Data Fig. 5 |. Gating strategies.
Gating strategies are shown for the key cell populations described in Fig. 1f and Extended Data Fig. 3. a, Leukocyte gating strategy to identify lymphocytes and granulocytes. b, T cell surface staining gating strategy to identify CD4 and CD8 T cells, TCR-activated T cells, follicular T cells, and additional subsets. c, B cell surface staining gating strategy to identify B cells subsets.
Fig. 1 |
Fig. 1 |. COVID-19 severity correlates with anti-S antibodies.
a,b, Plasma reactivity to S protein and RBD in patients with COVID-19. a, Anti-S IgM and IgG. IgM (HCW, n = 21; non-hospitalized, n = 21; moderate, n = 92; severe, n = 25; deceased, n = 14). IgG (HCW, n = 87; non-hospitalized, n = 21; moderate, n = 94; severe, n = 23; deceased, n = 34). b, Anti-RBD IgM and IgG. IgM (HCW, n = 21; non-hospitalized, n = 7; moderate, n = 75; severe, n = 13; deceased, n = 11). IgG (HCW, n = 21; non-hospitalized, n = 6; moderate, n = 74; severe, n = 13; deceased, n = 31). Negative controls: HCWs. N-hospitalized, non-hospitalized. Each dot represents a single individual at their maximum antibody titer over the disease course. Significance: one-way ANOVA corrected for multiple comparisons using Tukey’s method. Boxes represent the distribution of variables with quartiles and outliers. Horizontal bars: mean values. c, Correlation and linear regression of maximum levels for each patient of virus-specific IgG and length of hospitalization over time. Left, all patients. Right, patients grouped by disease severity. Regression lines are shown as dark purple (moderate) or pink (severe). d,e, Correlation of virus-specific IgG and (d) length of intubation or (e) patients’ maximum levels of ferritin, D-dimer and CRP. Pearson’s correlation coefficients and linear regression significance are colored accordingly; shading represents 95% CI. f, Heat map correlation analysis between virus-specific IgG levels and major immune cell populations in PBMCs. Color intensity indicates the relative cell frequency. Significance: one-way ANOVA corrected for multiple comparisons using Dunnett’s method. **P < .01, *P < .05. g.i, Scheme. g.ii, Scatter plot of patients with COVID-19 with S1 IgG+ samples at their first collection time point. Dashed vertical line: threshold of S1 IgG positivity. Solid horizontal line: limit of detection. g.iii, Comparison of mean log viral loads between IgG-low and IgG-high groups using two-sample t-test (two-sided). Bars represent average ± s.d. g.iv, Days from symptom onset for each group. Bars represent average ± s.d. g.v, Violin plots of clinical scores for each cluster. Solid black lines, mean; dashed lines, median. Significance: Kruskal–Wallis corrected for multiple comparisons using Dunn’s method. CI, confidence interval; OD, optical density; NK, natural killer; Np, nasopharyngeal; NS, not significant.Source data
Fig. 2 |
Fig. 2 |. Serum antibody kinetics reveals distinct COVID-19 outcomes.
a, Patients’ plasma reactivity to S protein and RBD measured by ELISA. Anti-S and Anti-RBD IgM and IgG comparison in discharged or deceased patients. Longitudinal data plotted over time continuously. Regression lines are shown as light blue (discharged), purple (deceased) and red (high neutralizers). Lines indicates cross-sectional averages from each group, with shading representing 95% CI and colored accordingly. Anti-S IgM (discharged, n = 126; deceased, n = 14). Anti-S IgG (discharged, n = 127; deceased, n = 33). Anti-RBD IgM (discharged, n = 88; deceased, n = 11). Anti-S RBD (discharged, n = 87; deceased, n = 30). b,c, Viral loads measured by nasopharyngeal swabs are plotted as log10 of genome equivalents (GEs). b, Viral loads against time after symptom onset accordingly with patient outcome. Regression lines are shown as light blue (discharged) or purple (deceased), with shading representing 95% CI. Pearson’s correlation coefficients and linear regression significance are colored accordingly. c, Viral load measured in discharged, deceased and high neutralizer (HN) patients. (HN, n = 6; discharged, n = 53; deceased, n = 12). Each dot represents the viral load of a single individual at their maximum antibody titer over the disease course. One-way ANOVA corrected for multiple comparisons using Tukey’s method were used to determine significance. ***P = 0.0005, **P = 0066. d, Heat map correlation analysis between Anti-S IgG (OD450 nm) levels and plasma cytokine/chemokine measurements in discharged (n = 146) or deceased (n = 26) patients. Patients are arranged across columns based on anti-S IgG levels. Each row represents a cytokine/chemokine and is normalized by its maximum value (assigned value of 1). Color intensity indicates the relative cytokine concentration (log10) normalized against the same population across all subjects. k-means clustering was used to arrange patients and measurements. Significance was assessed by one-way ANOVA testing corrected for multiple comparisons using Tukey’s method. sCD40L, FGF2, IL-1β, IL-1RA, IL-2, IL-6, IL-12, MCSF, TNF-β, CCL1, TPO, IFN-L2 (P < .05); fractalkine, IL-4, IL-17F, CCL7, CXCL9, eotaxin2, CC17, SCF, TSLP, IL-33 (P < .01); GCSF, IFN-α, IFN-γ, IL-8, IL-10, IL-15, CXCL10, CCL2, TGF-α, TNF-α, CCL8, CXCL13, CCL21, LIF, TRAIL, CCL27 (P < 0.001). ***P < .001 **P < .01, *P < .05. CI, confidence interval; NS, not significant; OD, optical density.
Fig. 3 |
Fig. 3 |. Neutralizing antibody temporal dynamics distinguish discharged and deceased patients with COVID-19.
a–e, Longitudinal neutralization assay using wild-type SARS-CoV-2. a, Frequency of neutralizers, n = 83. b, Neutralization capacity among discharged (light blue), deceased (purple) and high neutralizer (HN) (red) patients at the experimental six-fold serially dilutions (from 1:3 to 1:2,430). HCWs, below the threshold for anti-S/RBD ELISA, were used as negative controls. Post 1 vaccine dose, 28 d after 1 vaccine dose. Post 2 vaccine dose, 7 d after 2 vaccine dose. (HCWs, n = 22; discharged, n = 41; deceased, n = 37; HN, n = 13; post 1 vaccine dose, n = 9; post 2 vaccine dose, n = 7). Pearson’s correlation analysis were used to accessed significance. HN: r2 0.785, P (two-tailed) 0.0185; discharged: r2 0.438, P (two-tailed) 0.1516; deceased: r2 0.437, P (two-tailed) 0.1524; Post 1 vaccine dose: r2 0.424, P (two-tailed) 0.1609; post 2 vaccine dose: r2 0.822, P (two-tailed) 0.0126. c, Maximum neutralization titer (PRNT50) per patient according to clinical severity scale as described in Methods. CS, clinical score. One-way ANOVA corrected for multiple comparisons using Tukey’s method was used to determine significance. *P = 0.0213. d, Longitudinal data plotted over time of neutralization capacity among discharged (light blue), deceased (purple) and HN (red) patients at the experimental six-fold serially dilutions (from 1:3 to 1:2,430). Lines indicates cross-sectional averages from each group, with shading representing 95% CI and colored accordingly. e, Average of days from symptom onset to reach 50% of neutralization at each experimental serum dilution among groups. CI, confidence interval; NS, not significant.
Fig. 4 |
Fig. 4 |. Early neutralizing antibodies correlate with better COVID-19 clinical trajectory.
Patient stratification by early NAb capacity, based on levels of anti-S IgG, PRNT50 titers and days from symptom onset. a, Cohort overview by IgG anti-S titers (three external circles) and NAb production (internal circle). Frequency of patients in each level is indicated in light gray. Frequency of early and late neutralizers stratified based on days from symptom onset at 1:90 dilution is indicated in black. *Frequency of patients with NAb capacity over the disease course in patients with high levels of anti-S IgG. b, Distribution of age, BMI and frequency of males and females between early (>50% neutralization activity in 1:90 titer before day 14 after symptom onset) or late (<50% neutralization activity in 1:90 titer before day 14 after symptom onset) neutralizers, as determined in a. c, Disease progression measured by clinical severity score for patients in each group. The lines represent the mean ± s.e.m for each group and are ordered by the collection time points for each patient, with regular collection intervals of 3–4 d. Shade represents 95% CI and is colored accordingly. d, Percentage of mortality in each group (early neutralizers, n = 27; late neutralizers, n = 45). e, Viral load measured by nasopharyngeal (Np) swabs plotted as log10 of genome equivalents (GEs) in early and late neutralizers (early neutralizers, n = 21; late neutralizers, n = 28). Each dot represents a single individual at their maximum antibody titer over the disease course. Box analysis with minimum and maximum represented for each group. Horizontal bar indicates mean values. Significance was accessed using unpaired t-test. *P (two-tailed) = 0.0467. CI, confidence interval.

References

    1. Hoffmann M et al. SARS-CoV-2 cell entry depends on ACE2 and TMPRSS2 and is blocked by a clinically proven protease inhibitor. Cell 181, 271–280 (2020). - PMC - PubMed
    1. Yan R et al. Structural basis for the recognition of SARS-CoV-2 by full-length human ACE2. Science 367, 1444–1448 (2020). - PMC - PubMed
    1. Xu Z et al. Pathological findings of COVID-19 associated with acute respiratory distress syndrome. Lancet Respir. Med. 8, 420–422 (2020). - PMC - PubMed
    1. Huang C et al. Clinical features of patients infected with 2019 novel coronavirus in Wuhan, China. Lancet 395, 497–506 (2020). - PMC - PubMed
    1. Chen G et al. Clinical and immunologic features in severe and moderate Coronavirus Disease 2019. J. Clin. Invest. 130, 2620–2629 (2020). - PMC - PubMed

Publication types

MeSH terms