Comparative Study
. 2021 Jun;594(7861):77-81.
doi: 10.1038/s41586-021-03519-x. Epub 2021 May 5.

A high-quality bonobo genome refines the analysis of hominid evolution

Affiliations
Comparative Study

A high-quality bonobo genome refines the analysis of hominid evolution

Yafei Mao et al. Nature. 2021 Jun.

Abstract

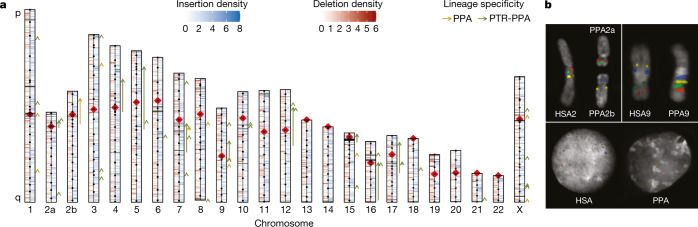
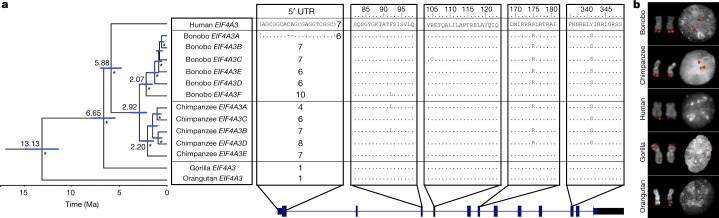
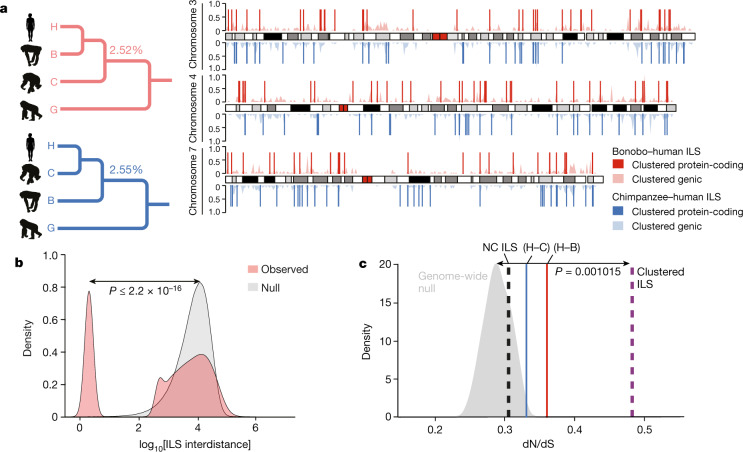
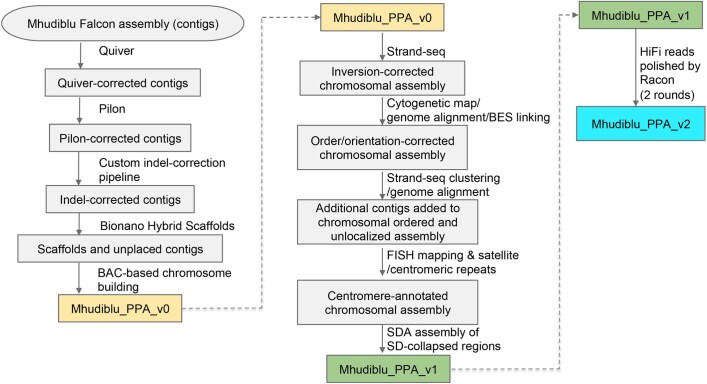
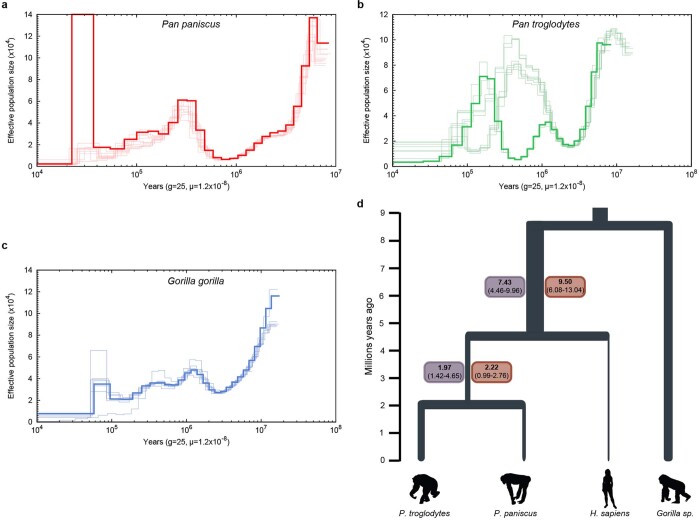
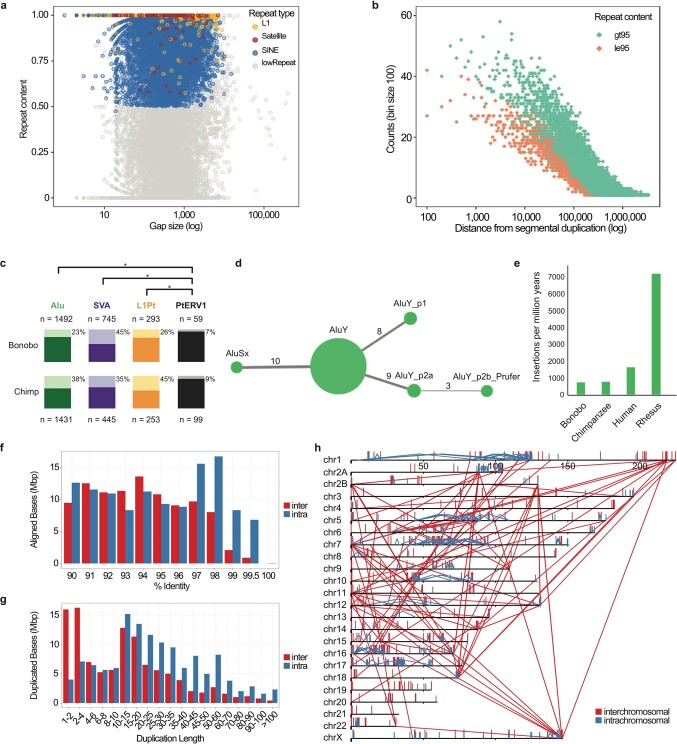
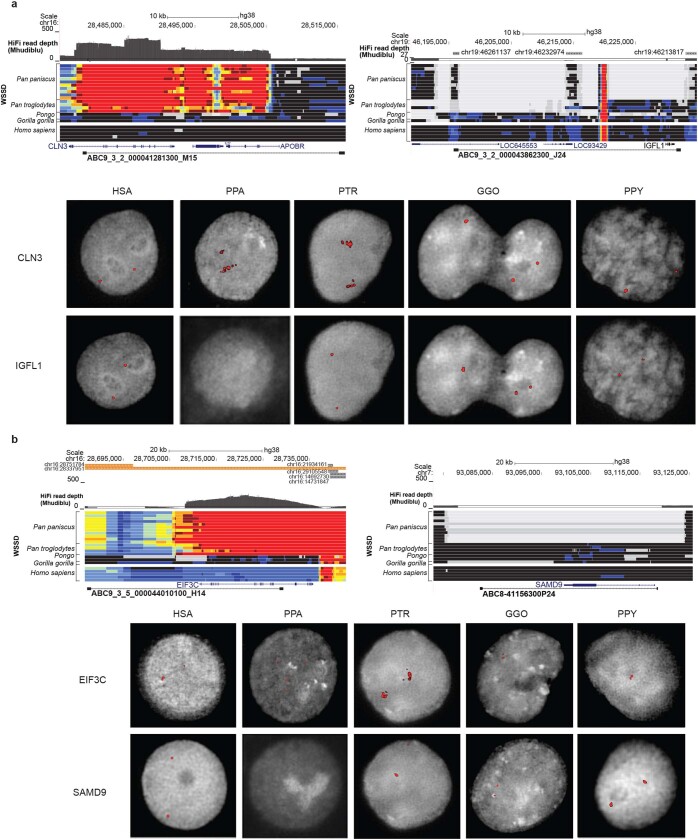
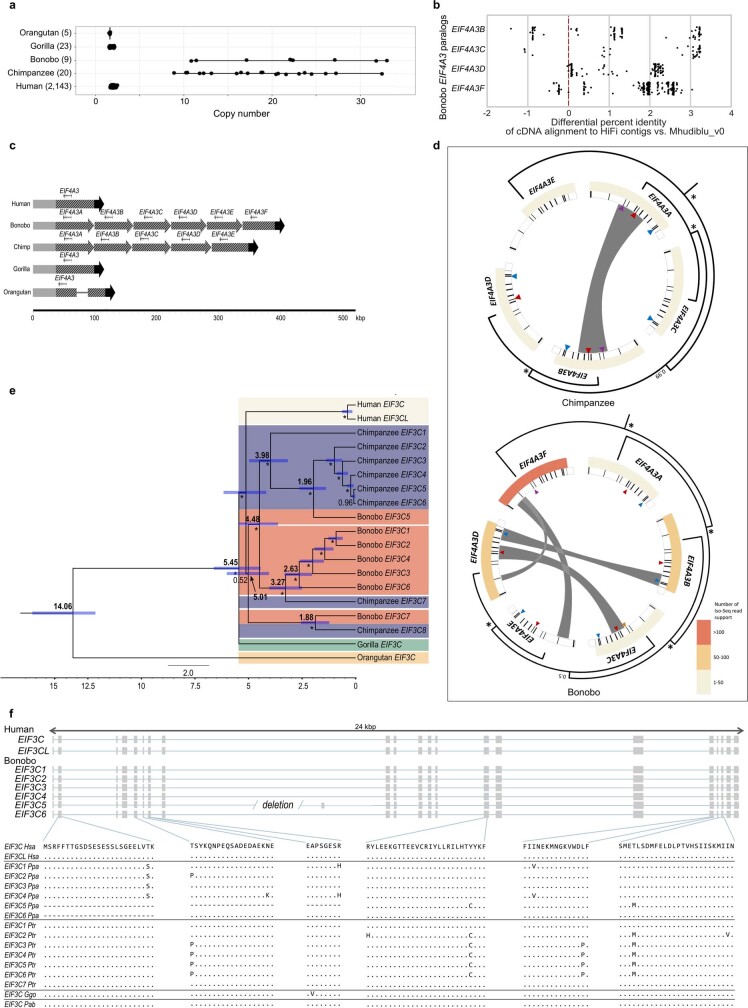
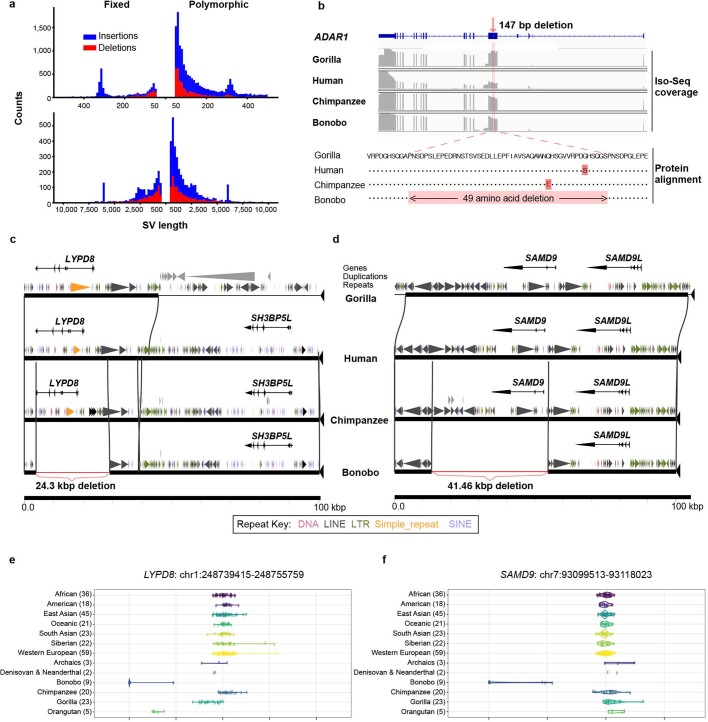
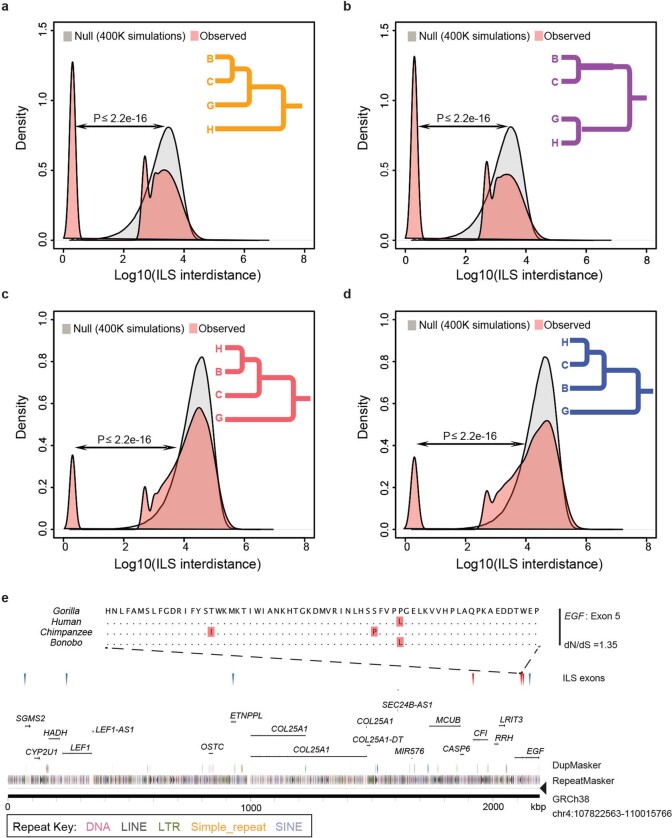
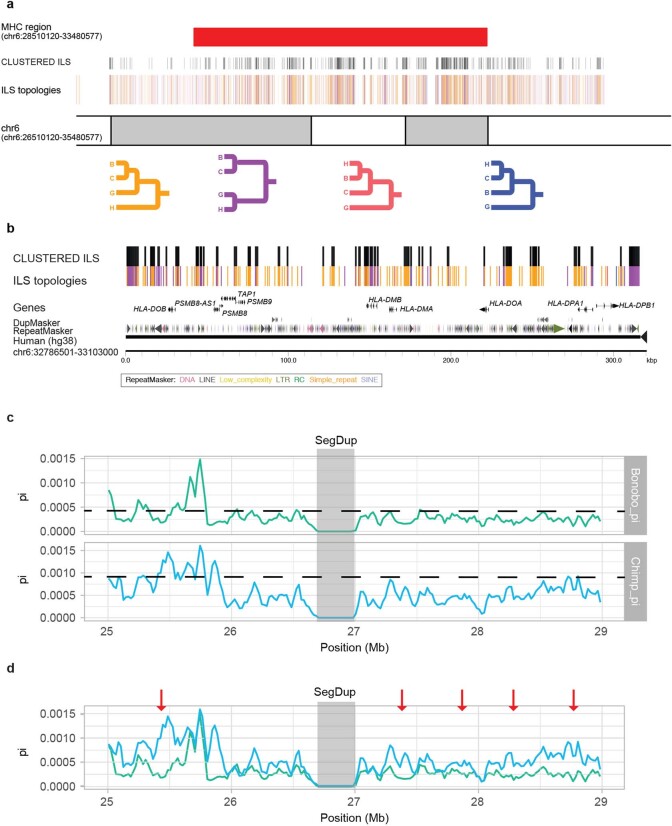
The divergence of chimpanzee and bonobo provides one of the few examples of recent hominid speciation1,2. Here we describe a fully annotated, high-quality bonobo genome assembly, which was constructed without guidance from reference genomes by applying a multiplatform genomics approach. We generate a bonobo genome assembly in which more than 98% of genes are completely annotated and 99% of the gaps are closed, including the resolution of about half of the segmental duplications and almost all of the full-length mobile elements. We compare the bonobo genome to those of other great apes1,3-5 and identify more than 5,569 fixed structural variants that specifically distinguish the bonobo and chimpanzee lineages. We focus on genes that have been lost, changed in structure or expanded in the last few million years of bonobo evolution. We produce a high-resolution map of incomplete lineage sorting and estimate that around 5.1% of the human genome is genetically closer to chimpanzee or bonobo and that more than 36.5% of the genome shows incomplete lineage sorting if we consider a deeper phylogeny including gorilla and orangutan. We also show that 26% of the segments of incomplete lineage sorting between human and chimpanzee or human and bonobo are non-randomly distributed and that genes within these clustered segments show significant excess of amino acid replacement compared to the rest of the genome.


Conflict of interest statement

J.G.U. is an employee of Pacific Biosciences. A.W.C.P., J.L. and A.R.H. are employees of Bionano Genomics. The other authors declare no competing interests.

Figures

Fig. 1
Fig. 1. Sequence and assembly of the bonobo genome.
a, Schematic of the Mhudiblu_PPA_v0 assembly depicting the centromere location (red rhombus), FISH probes used to create assembly backbone (black dots), fixed bonobo-specific insertions (blue) and deletions (red) (Supplementary Data), remaining gaps (black horizontal lines) and large-scale inversions (arrows). We distinguish bonobo-specific inversions (dark orange, PPA) from Pan-specific inversions (dark green, PTR-PPA). b, FISH validation of the bonobo chromosome 2a and 2b fusion and the 2b pericentric inversion (probes: RP11-519H15 in red, RP11-67L14 in green, RP11-1146A22 in blue, RP11-350P7 in yellow) (top left); the chromosome 9 pericentric inversion (probes: RP11-1006E22 in red, RP11-419G16 in green, RP11-876N18 in blue, RP11-791A8 in yellow) (top right); and the inversion Strand-seq_chr7_inv4a (probes: RP11-118D11 in green, WI2-3210F8 in red, RP11-351B3 in blue) (bottom).
Fig. 2
Fig. 2. EIF4A3 gene family expansion and sequence resolution.
a, Multiple sequence alignment shows EIF4A3 amino acid differences between the human, Mhudiblu_PPA and chimpanzee assembled paralogues, and sequences of other great apes. A polymorphic 18-bp motif VNTR is located at the 5′ UTR of nonhuman primate EIF4A3 and accounts for most of the differences between various isoforms. A phylogenetic tree is built from neutral sequences of EIF4A3 paralogues using Bayesian phylogenetic inference. This analysis is conducted using BEAST2 software. Numbers on each major node denote estimated divergence time. Ma, million years ago. The blue error bar on each node indicates the 95% confidence interval of the age estimation. Bayesian posterior probabilities are reported using asterisks for nodes with posterior probability >99%. b, FISH on metaphase chromosomes and interphase nuclei with human probe WI2-3271P14 confirms an EIF4A3 subtelomeric expansion of chromosome 17 in bonobo and chimpanzee relative to human, gorilla and orangutan.
Fig. 3
Fig. 3. Hominid ILS.
a, A whole-genome ILS cladogram analysis (left) for bonobo–human (red) and chimpanzee–human (blue) and a schematic map (right) of clustered ILS segments (500-bp resolution) specifically for chromosomes 3, 4 and 7. The lighter density plot represents the clustered ILS events mapping to intragenic regions, whereas the vertical lines represent the subset that overlap with protein-coding exons. b, Distribution of distances between ILS segments (inter-ILS) (500-bp resolution) compared with a simulated (null) expectation (from 400,000 simulations) reveals a bimodal pattern with a subset (26%) that is clustered and significantly non-randomly distributed. A two-sample Wilcoxon rank-sum test was used to calculate the P value in R. c, ILS exons show a significant excess of amino acid replacement (dN/dS) for both human–bonobo (H–B; red line; P = 0.004778) and human–chimpanzee (H–C; blue line; P = 0.03924) ILS. In particular, exons mapping to the ILS clustered segments (b) show the most significant excess of amino acid replacements dN/dS (dotted purple line; P = 0.001015) compared to the genome-wide null distribution (grey density plot). This shift is not observed for the non-clustered ILS segments (NC ILS; dotted black line; P = 0.3161). Significance was analysed using the one-sample Student’s t-test in R. The silhouette of the chimpanzee in a is created by T. Michael Keesey and Tony Hisgett (http://phylopic.org/; image is under a Creative Commons Attribution 3.0 Unported licence); silhouettes of bonobo and gorilla are from http://phylopic.org/ under a Public Domain Dedication 1.0 licence.
Extended Data Fig. 1
Extended Data Fig. 1. Workflow schematic of bonobo assembly pipeline.
Processing steps to create the reference sequences Mhudiblu_PPA_v0, Mhudiblu_PPA_v1 and Mhudiblu_PPA_v2.
Extended Data Fig. 2
Extended Data Fig. 2. Pairwise sequentially Markovian coalescent analysis and estimates of the effective population size predating the divergence in Homo and Pan.
ac, Pairwise sequentially Markovian coalescent (PSMC) plots based on an analysis of Illumina WGS genomes of 10 bonobos (a; red), 10 chimpanzees (b; green) and 7 gorillas (c; blue). The y axis represents the effective population size (Ne) (×104) inferred by the PSMC and the x axis represents the time in years. Ne values and time are scaled with generation time g = 25 years and a mutation rate of μ = 1.2 × 10−8 per bp per generation. d, Values in boxes refer to median and 95% confidence interval Ne (×104) values inferred through PSMC analysis considering bonobo (red boxes) and chimpanzee (purple). We extracted size estimates from time intervals between 4 and 7 million years ago for the Homo, Pan Ne and been 1 and 2.5 million years ago for the P. paniscus, P. troglodytes Ne, considering μ = 0.5 × 10−9 mutations (bp × year) and a generation time of 25 years. Values using μ = 1 × 10−9 mutations (bp × year) are reported in Supplementary Data.
Extended Data Fig. 3
Extended Data Fig. 3. Sequence and assembly of the bonobo genome and bonobo genome repeat structure.
a, The size (x axis is shown on a log scale) and repeat content of gaps filled in the new bonobo assembly compared with the panpan1.1 assembly. Gaps composed of more than 50% repeat content for any particular class of repeat are coloured. b, Distance from filled gaps to the nearest segmental duplication (x axis) versus the counts of highly repetitive (>95%, green) and less repetitive (≤95%, orange) filled gaps in 100 base-pair bins (y axis). An additional 2,600 and 1,755 filled gaps map directly within segmental duplication sites with ≤95% and >95% repeat content, respectively. c, Polymorphism rates for lineage-specific MEIs. Alu, SVA, L1Pt and PTERV1 insertions that do not ‘lift over’ between chimpanzee and bonobo reference genomes were identified and genotyped for deletions using data from 10 bonobos and 10 chimpanzees. Light-coloured bars and percentages represent the fraction of instances of the MEI type that display support for polymorphism; dark-coloured bars represent the fraction of fixed insertions in these populations. PTERV1 displays a significantly less polymorphic fraction than Alu (P = 2.6 × 10−74, chimpanzee; P = 6.9 × 10−35, bonobo; χ2 test, Bonferroni correction), SVA (P = 3.8 × 10−19; P = 1.9 × 10−62) or L1Pt (P = 2.2 × 10−18; P = 1.3 × 10−8), reflecting its lack of activity since the divergence of Pan. SVA is the only MEI type with a greater polymorphism rate in bonobo. d, A COSEG network of bonobo-specific Alu subfamilies indicating the relative number of elements (size of the node) and number of mutations (line thickness) that distinguish subfamilies. e, A comparison of the retrotransposition rate per million years based on lineage-specific Alu insertions from a select panel of primate genomes. fh, The percentage identity distribution (f) and length distribution (g) of segmental duplications (≥90% identify, ≥1 kb and no unplaced contigs) are shown as well as the pattern of the largest and most identical (≥10 kb and ≥98%) intrachromosomal (blue) and interchromosomal (red) segmental duplications (h) in the bonobo genome.
Extended Data Fig. 4
Extended Data Fig. 4. Pan-specific duplications and bonobo-specific deletions.
a, Pan-specific duplication of the CLN3 locus and bonobo-specific deletion of IGFL1. HiFi read depth and whole-genome shotgun detection of bonobo, chimpanzee, orangutan, gorilla and human individuals relative to GRCh38 detect these events (top), which are validated by interphase FISH of each species using fosmid clones spanning the region (bottom). b, Pan-specific duplication of the EIF3C locus and bonobo-specific deletion of SAMD9. HiFi read depth and whole-genome shotgun detection of bonobo, chimpanzee, orangutan, gorilla and human individuals relative to GRCh38 detect these events (top), which are validated by interphase FISH of each species using fosmid clones spanning the region (bottom). Genomes were included from the following individuals (from top to bottom): bonobo (Pan_paniscus_A915_Kosana, A927_Salonga, A922_Catherine, A917_Dzeeta, A918_Hermien, A924_Chipita, A926_Natalie, A928_Kumbuka, A914_Hortense, A919_Desmond, A925_Bono); chimpanzee (Pan_troglodytes_troglodytes_A958_Doris, A957_Vaillant, A960_Clara, Pan_troglodytes_verus_Clint); orangutan (Pongo_abelii_A950_Babu, Pongo_pygmaeus_A944_Napoleon); gorilla (Gorilla_gorilla_gorilla_KB4986_Katie); human (AFR_Aari_ETAR005_F, AMR_Nahua_Mex20_M, EA_Mongola_HGDP01228_M, SA_Kalash_HGDP00328_M, WEA_FinlandFIN_HG00360_M).
Extended Data Fig. 5
Extended Data Fig. 5. EIF4A3 and EIF3C gene family expansion and sequence resolution.
a, A comparison of EIF4A3 copy number among great apes based on a sequence-read-depth analysis confirms a variable copy number expansion in the bonobo and chimpanzee lineages (9–33 diploid copies). This recent duplication was not fully resolved initially in the bonobo reference genome (Mhudiblu_PPA_v0) because high-identity duplicated sequences were collapsed. b, Bonobo Iso-Seq full-length transcript reads map with higher identity to four of the paralogues compared to Mhudiblu_PPA_v0. c, Contigs that encompass EIF4A3 expansions and 100 kb of the flanking regions were assembled using bonobo and chimpanzee PacBio HiFi data. The 12-kb genomic sequence of human EIF4A3 mapped onto the assembled contigs. Six tandem copies of EIF4A3 spanning 310 kb in bonobo and five tandem copies spanning 262 kb in chimpanzee are recovered. Schematics show structural differences in EIF4A3 in primate genomes. Grey, black and striped arrows show different alignment blocks across the samples. A solid line connecting alignment blocks indicates an insertion event. d, Paralogues are expressed and show evidence of gene conversion in both bonobo and chimpanzee lineages. Analysis of bonobo Iso-Seq data confirms that five of the six EIF4A3 copies are expressed and maintain an open-reading frame (heat map indicates the number of Iso-Seq transcripts supporting each copy; minimap2 -ax splice -G 3000 -f 1000 --sam-hit-only --secondary=no --eqx -K 100M -t 20 --cs -2 | samtools view -F 260). GENECONV software shows significant signals (P ≤ 0.05 after multiple-test correction) of gene conversion for 16 out of 67 kb of the paralogous locus (grey bars) using multiple sequence alignment was performed using MAFFT version 7.453 (command: mafft -adjustdirection [input.fasta] > [output.msa_fasta]; GENECONV version 1.81a)). A subset of gene conversion events overlap with sites of amino acids that are specific to the Pan lineage. Triangles indicate the sites of amino acid change in each of the primate genomes compared to GRCh38. Different colours mark different changes: purple marks phenylalanine to leucine; yellow marks arginine to cysteine; red marks serine to arginine; teal marks tyrosine to serine. Same phylogenetic tree from Fig. 2 is reshaped to show the inferred evolutionary relationships among the paralogues. Nodes with >99% Bayesian posterior probabilities are indicated by asterisks; otherwise the actual number is shown. e, A phylogenetic tree was constructed from 16-kb noncoding EIF3C paralogues using Bayesian phylogenetic inference. This analysis was conducted using BEAST2 software. Numbers in bold on each major node denote estimated divergence time. The other numbers (not bold) indicate posterior probabilities. The blue error bar on each node indicates the 95% confidence interval of the age estimation. Bootstrap supports are reported using asterisks for nodes with posterior probability >99%. f, Gene models for transcribed loci based on Iso-Seq data (top). Human EIF3C and EIF3CL are compared to predicted open-reading frames for bonobo paralogues and Liftoff gene predictions for chimpanzee, orangutan and gorilla paralogues from contigs assembled from HiFi reads (bottom).
Extended Data Fig. 6
Extended Data Fig. 6. Bonobo structural variants and gene deletions.
a, Size distribution of fixed (left) and polymorphic (right) structural variant (SV) insertions and deletions in the bonobo genome for structural variants of 50–1,000 bp (top) or >1,000 bp (bottom) in length. Events are deemed to be specific to the bonobo lineage based on copy number genotyping against a panel of 27 ape genomes and a threshold of FST > 0.8 to define fixed events in bonobo. Modes are observed corresponding to full-length L1 (6 kb) and Alu (300 bp) mobile elements and are predominantly insertions reflecting the homoplasy-free nature of this class of mutation. b, A small fixed deletion predicts a 49 amino acid deletion in ADAR1 in the bonobo lineage. RefSeq ADAR1 structure is shown (top) compared with the Iso-Seq coverage of gorilla, human, chimpanzee and bonobo (middle). The protein alignment (bottom) shows that an in-frame deletion is created. c, A 24.3-kb fixed deletion results in the complete loss of LYPD8 in bonobo. Gene structure, duplication and repeat annotations are shown with respect to gorilla, human, chimpanzee and bonobo genomes. A lineage-specific duplication adjacent to LYPD8 is present in the gorilla genome (large grey triangles). d, A 41.5-kb fixed deletion mediated by directly orientated L1 repeats ablates SAMD9 leaving only SAMD9L in the bonobo lineage. e, Short-read whole-genome shotgun detection genotyping shows that LYPD8 was lost in the bonobo lineage. f, Short-read whole-genome shotgun detection genotyping shows SAMD9 was lost in the bonobo lineage.
Extended Data Fig. 7
Extended Data Fig. 7. Hominid ILS.
The distance between adjacent ILS segments (inter-ILS) (500-bp resolution) was calculated and the distribution was compared to a simulated expectation based on a random distribution. The analysis reveals a bimodal (and possibly an emerging trimodal) pattern in which a distinct subset of ILS segments are clustered (that is, clustered ILS sites). Four different topologies were considered. a, A (orangutan, (((bonobo, chimpanzee), gorilla), human)) ILS topology in which 31.58% of inter-ILS is clustered is shown. b, A (orangutan, ((bonobo, chimpanzee), (gorilla, human))) ILS topology in which 33.5% is clustered is shown. c, A (orangutan, (((bonobo, human), chimpanzee), gorilla)) ILS topology in which 8.14% is clustered is shown. d, A (orangutan, ((bonobo, (chimpanzee, human)), gorilla)) ILS topology in which 9.89% of sites is clustered is shown. e, An example of a cluster of human–bonobo (red triangles) and human–chimpanzee (blue triangles) ILS corresponding to a group of genes. A four-species alignment of one exon from EGF (exon 5) is shown with a nominal signal of positive selection.
Extended Data Fig. 8
Extended Data Fig. 8. Ideogram of the MHC region with ILS annotations.
a, The four main ILS topologies are colour-coded. The four colour lines representing ILS segments are shown above the chromosome coordinate (GRCh38). The clustered ILS segments are shown above the four colour lines (black). The MHC region (red bar) corresponds to genomic coordinates on chromosome 6: 28510120–33480577. b, A magnified view of the MHC region (chromosome 6: 32786501–33103000) depicting clustered ILS nearby HLA genes. c, Nucleotide diversity of bonobo (green) and chimpanzee (blue) is shown based on human genomic coordinates (GRCh38, chromosome 6: 25000000–29000000). The mean (dashed line) is shown for bonobo (mean = 4.45 × 10−4) and chimpanzee (mean = 9.35 × 10−4). A region of reduced diversity (grey) is shown that corresponds to a segmental duplication in which single-nucleotide polymorphisms were excluded due to potential mismapping. d, Same as c but merged onto the same scale and highlighting five regions (red arrows) in which diversity is reduced in bonobo compared to chimpanzee. Three of these correspond to previously identified regions; however, they are not among the top 1% of genome candidates showing positive selection by Tajima’s D and SweepFinder2. The overall diversity of single-nucleotide polymorphisms is reduced across the region in bonobo compared to chimpanzee.

References

    1. Prüfer K, et al. The bonobo genome compared with the chimpanzee and human genomes. Nature. 2012;486:527–531. doi: 10.1038/nature11128. - DOI - PMC - PubMed
    1. Takemoto H, Kawamoto Y, Furuichi T. How did bonobos come to range south of the Congo River? Reconsideration of the divergence of Pan paniscus from other Pan populations. Evol. Anthropol. 2015;24:170–184. doi: 10.1002/evan.21456. - DOI - PubMed
    1. Scally A, et al. Insights into hominid evolution from the gorilla genome sequence. Nature. 2012;483:169–175. doi: 10.1038/nature10842. - DOI - PMC - PubMed
    1. Locke DP, et al. Comparative and demographic analysis of orang-utan genomes. Nature. 2011;469:529–533. doi: 10.1038/nature09687. - DOI - PMC - PubMed
    1. The Chimpanzee Sequencing and Analysis Consortium Initial sequence of the chimpanzee genome and comparison with the human genome. Nature. 2005;437:69–87. doi: 10.1038/nature04072. - DOI - PubMed

Publication types

Substances