. 2021 Jul;595(7866):309-314.
doi: 10.1038/s41586-021-03520-4. Epub 2021 May 5.

Epigenetic silencing by SETDB1 suppresses tumour intrinsic immunogenicity

Affiliations

Epigenetic silencing by SETDB1 suppresses tumour intrinsic immunogenicity

Gabriel K Griffin et al. Nature. 2021 Jul.

Abstract

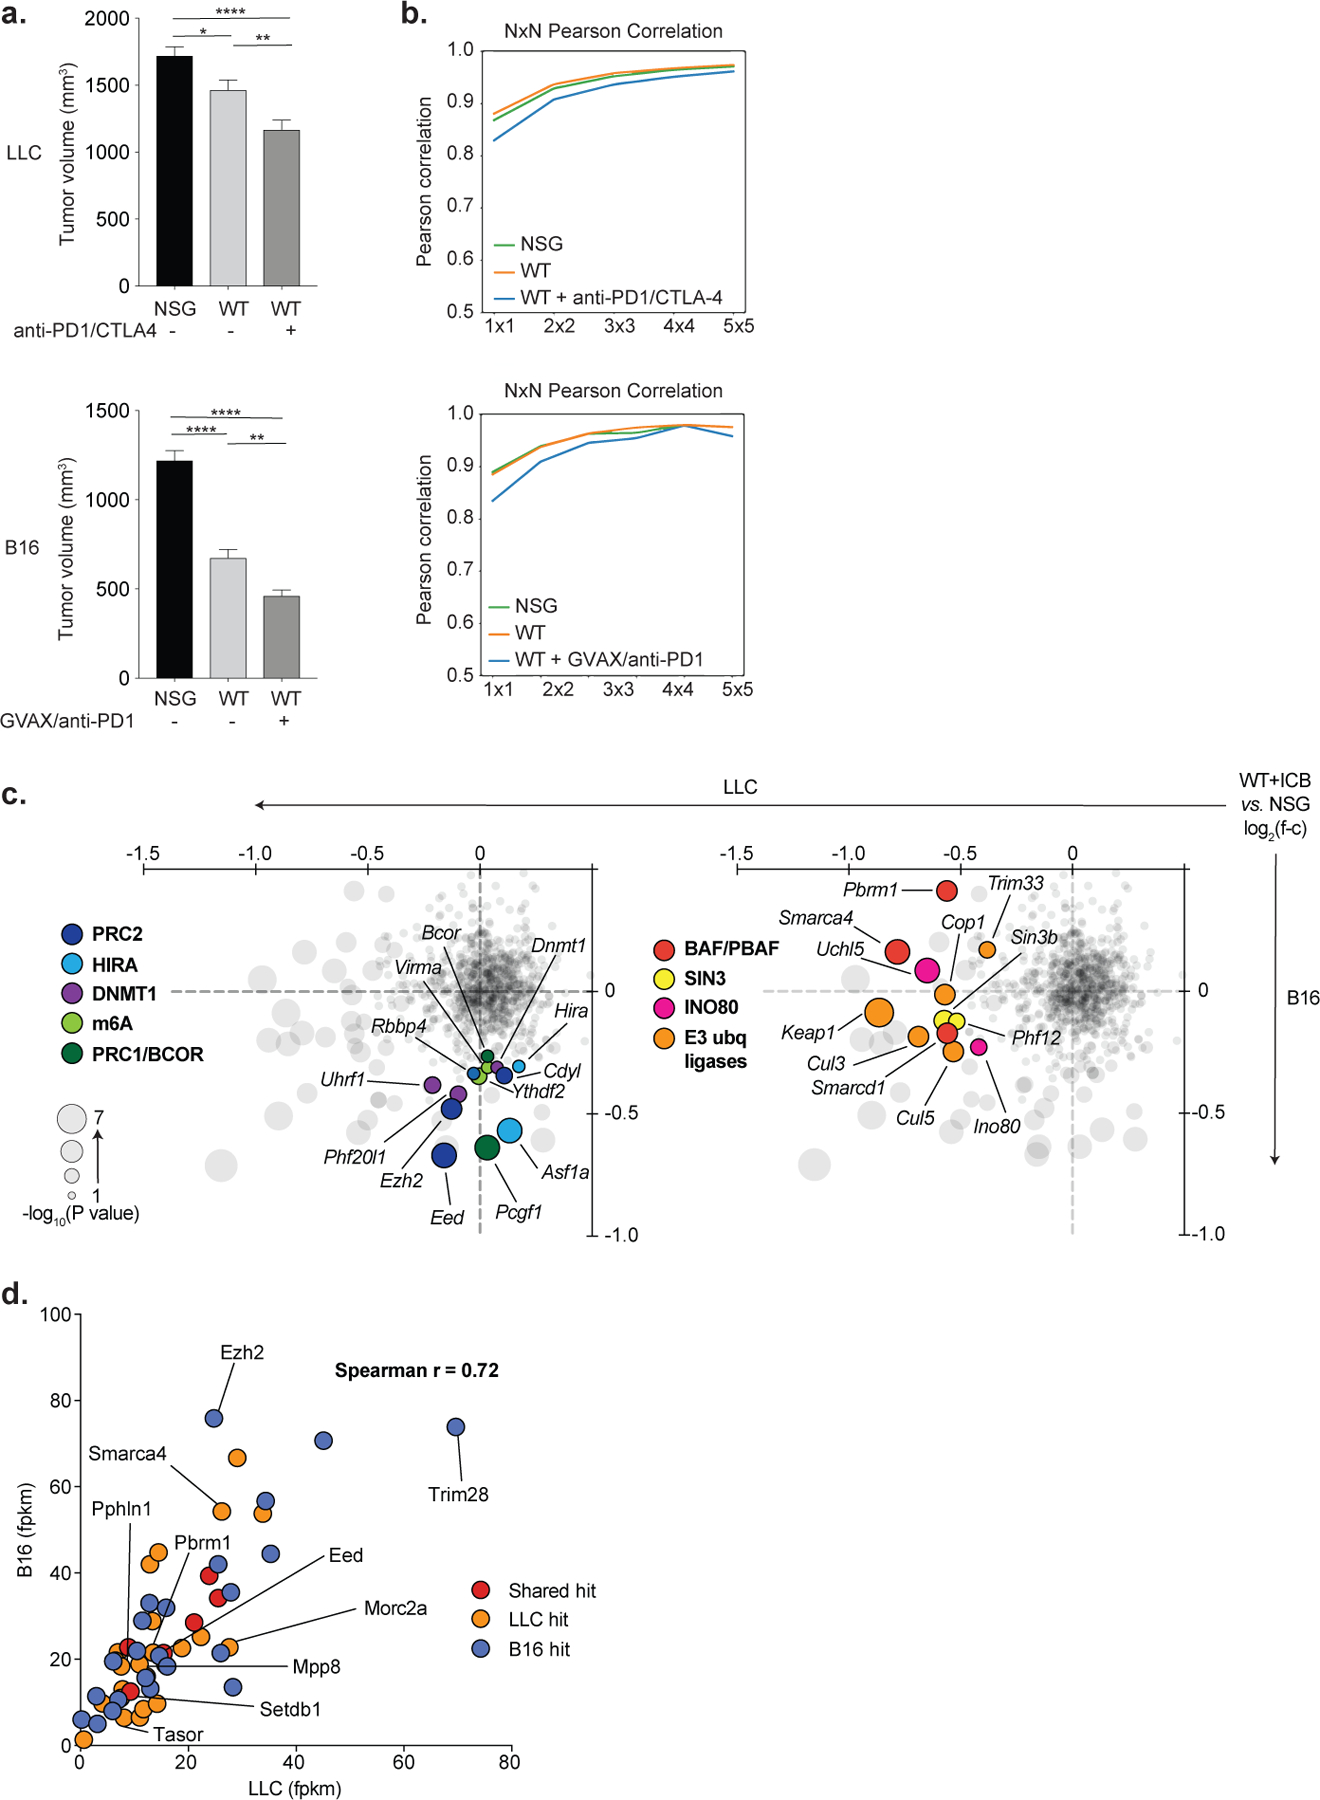
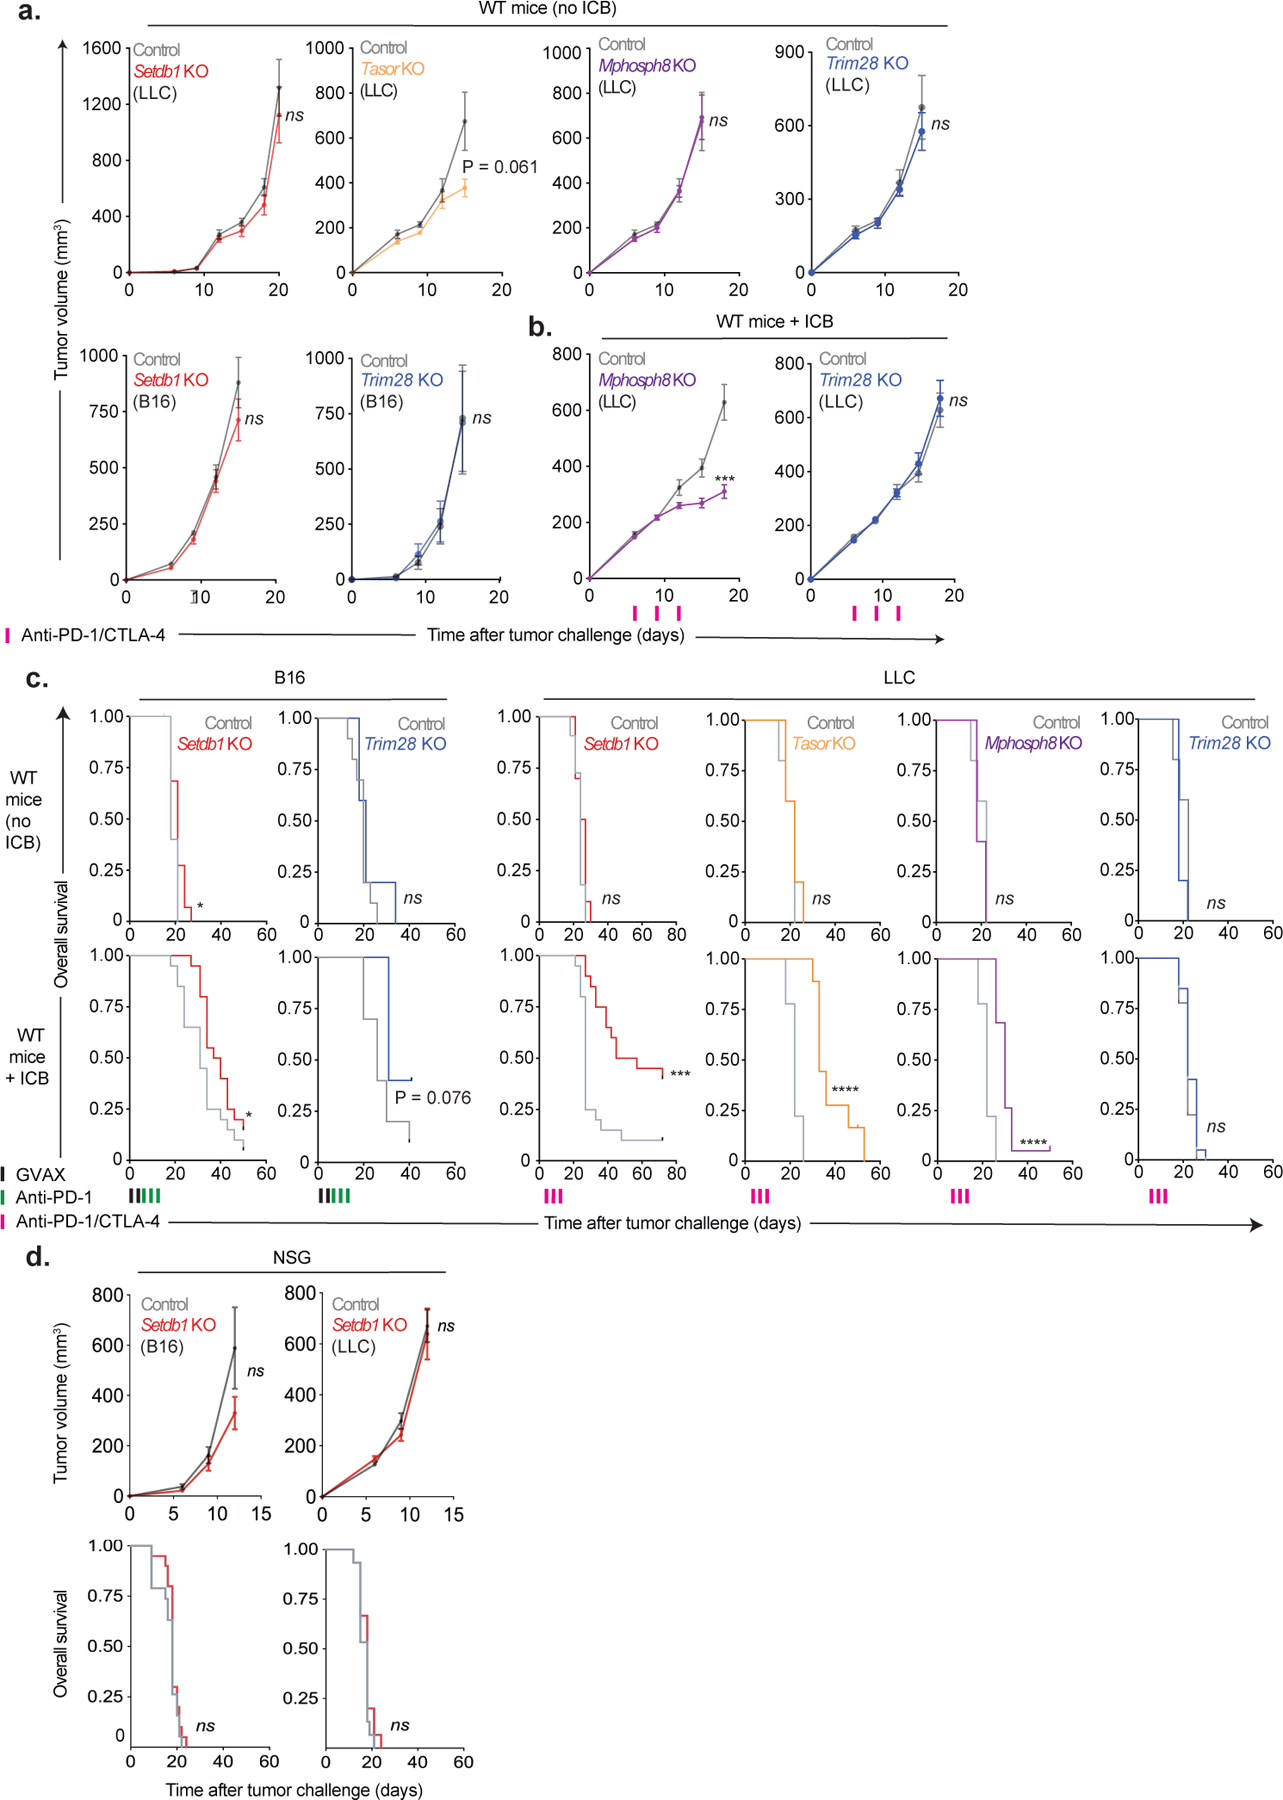
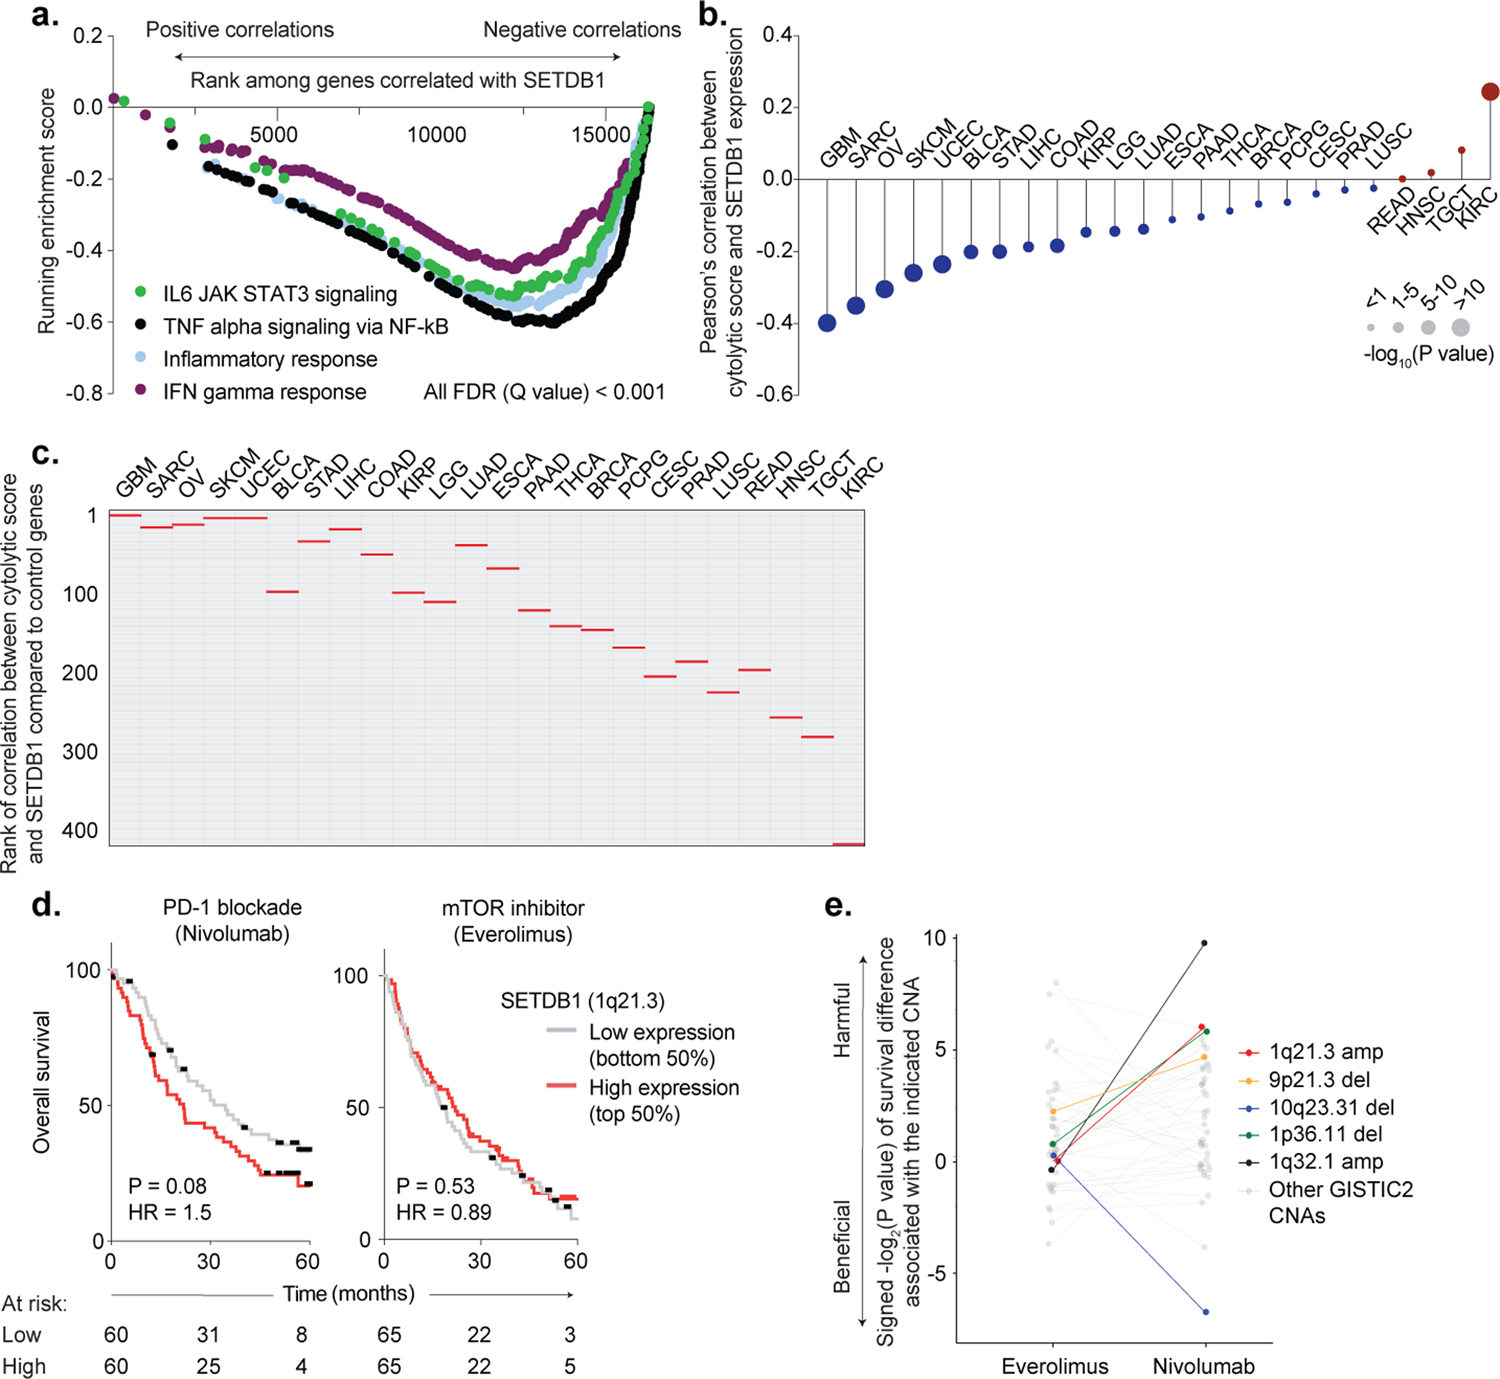
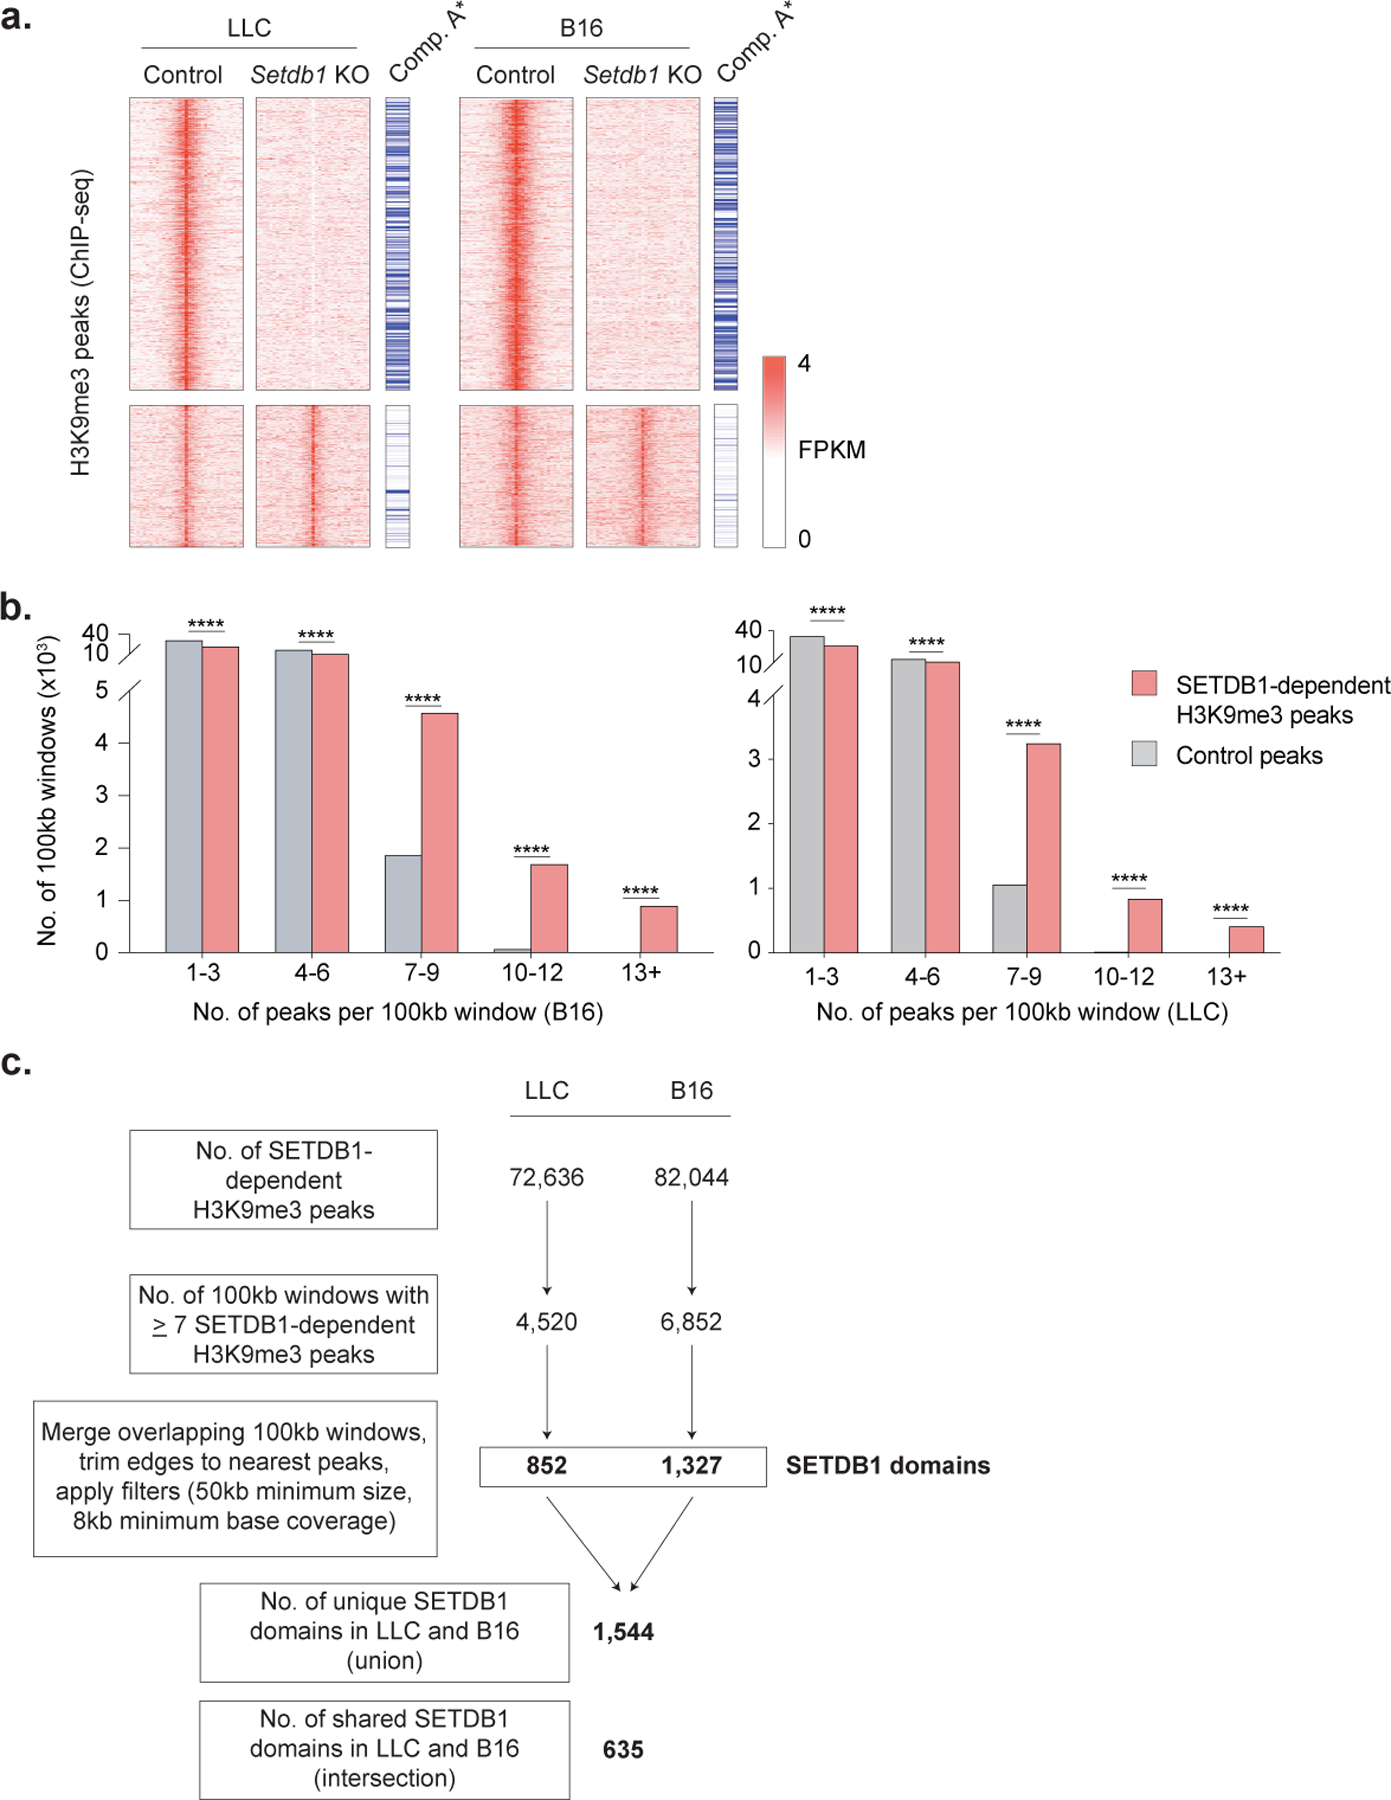
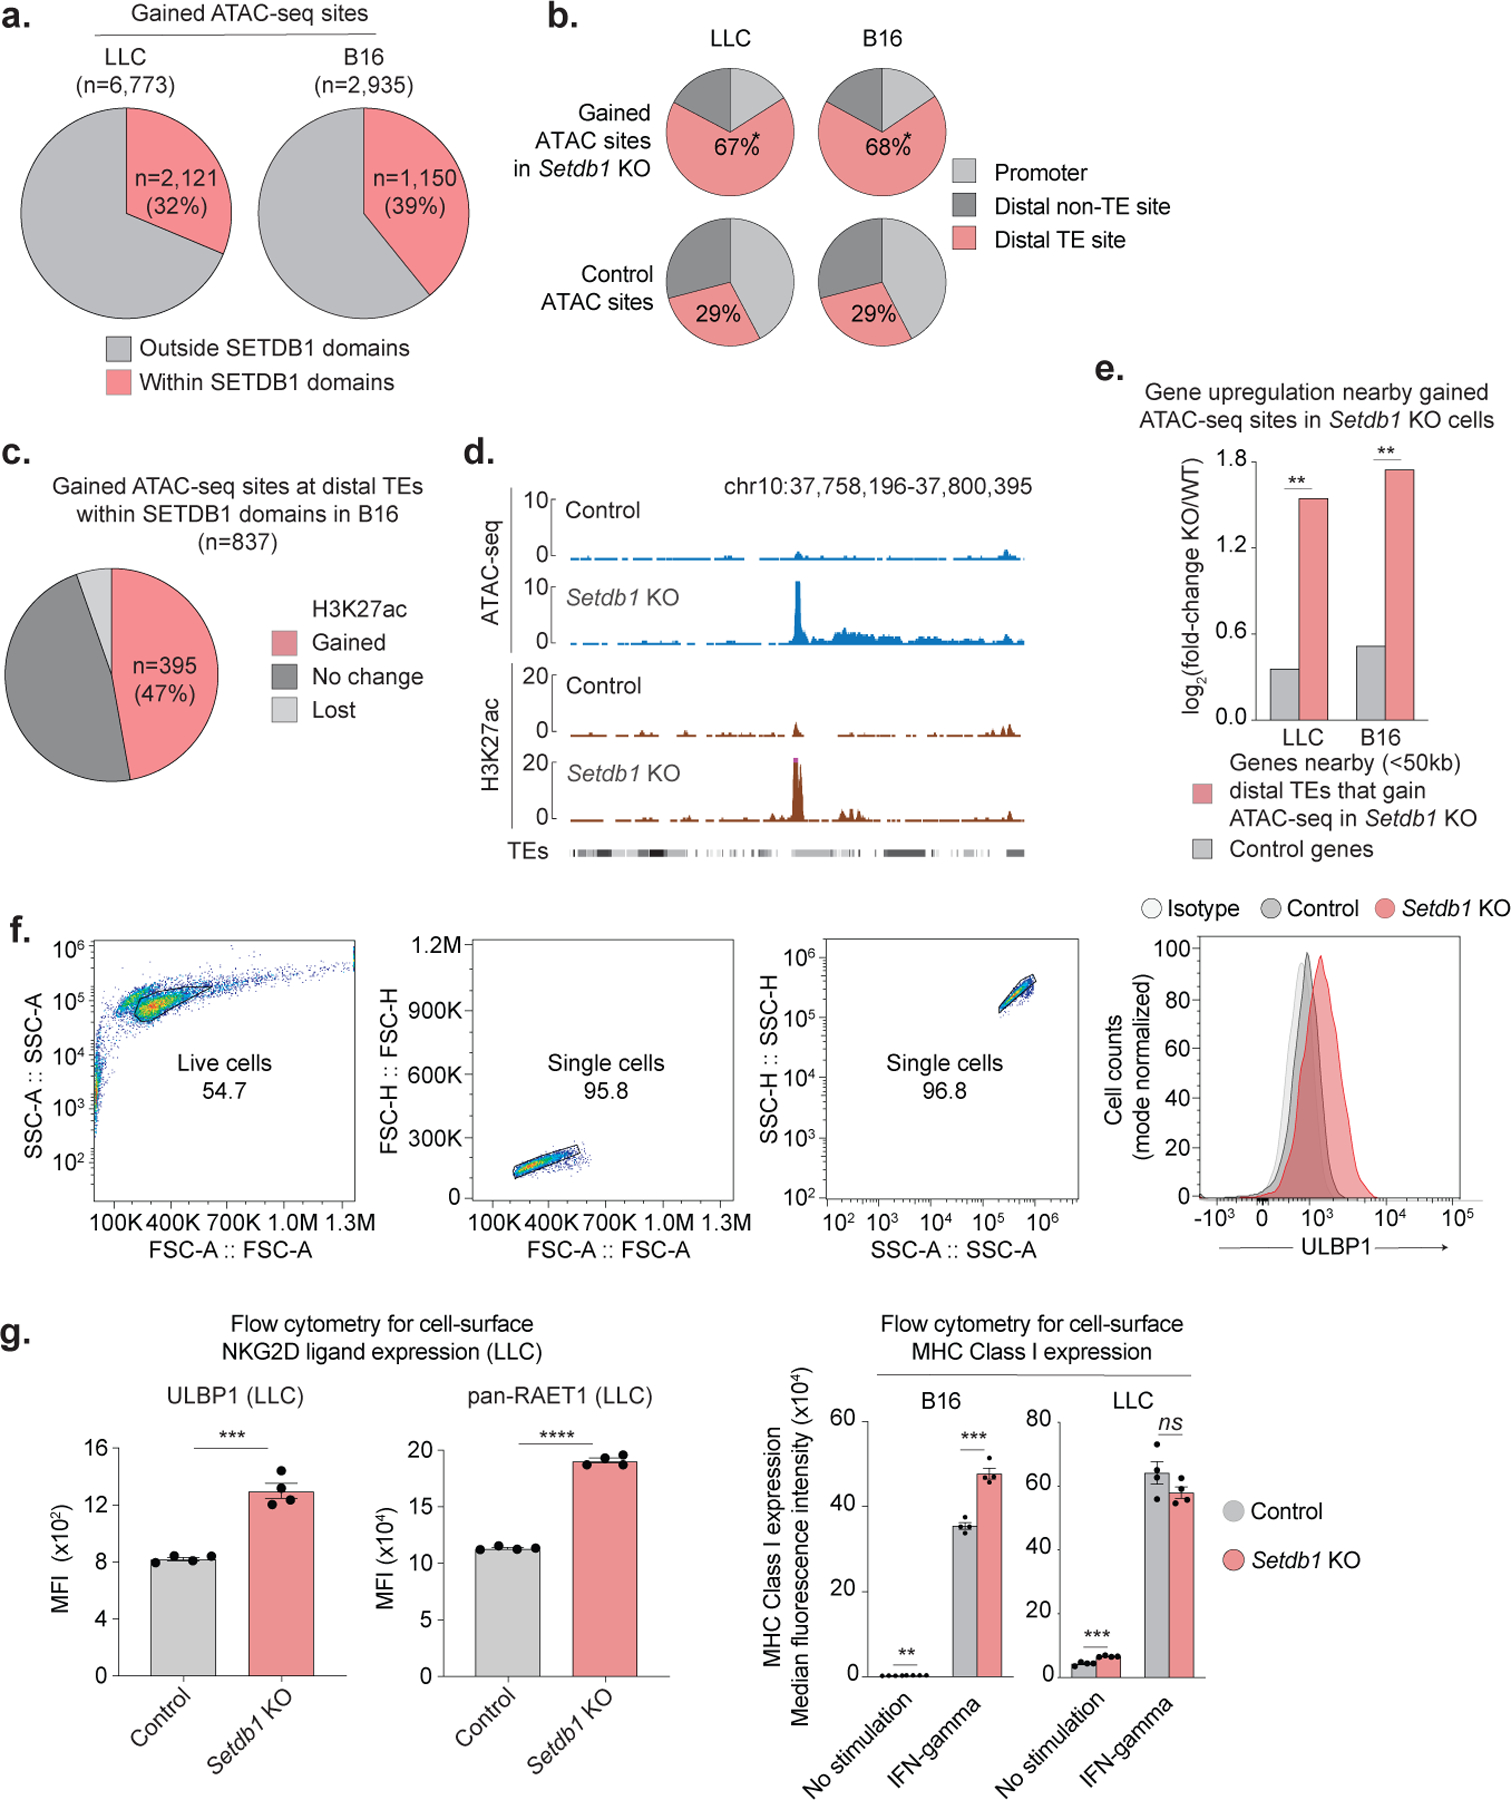
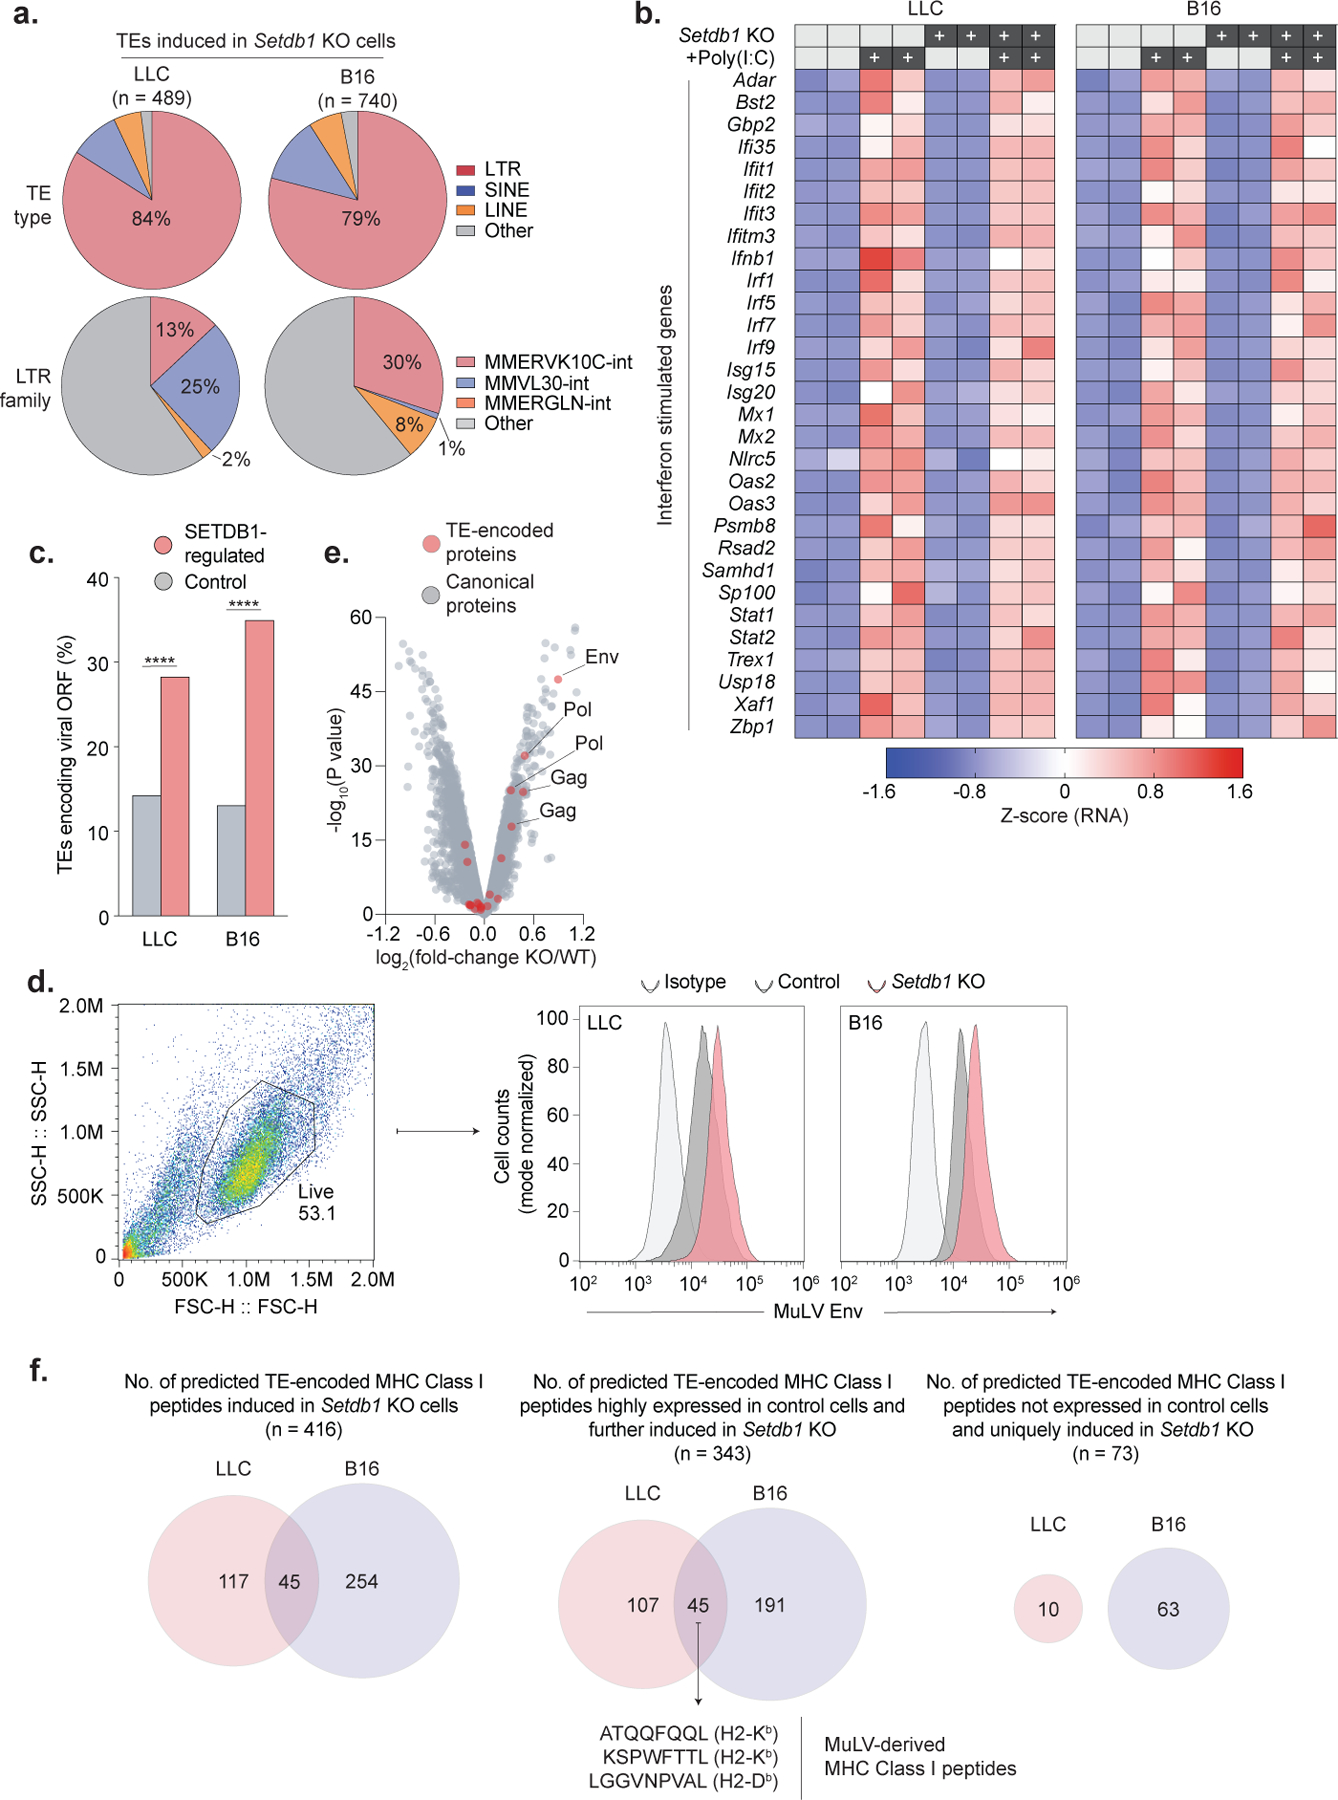
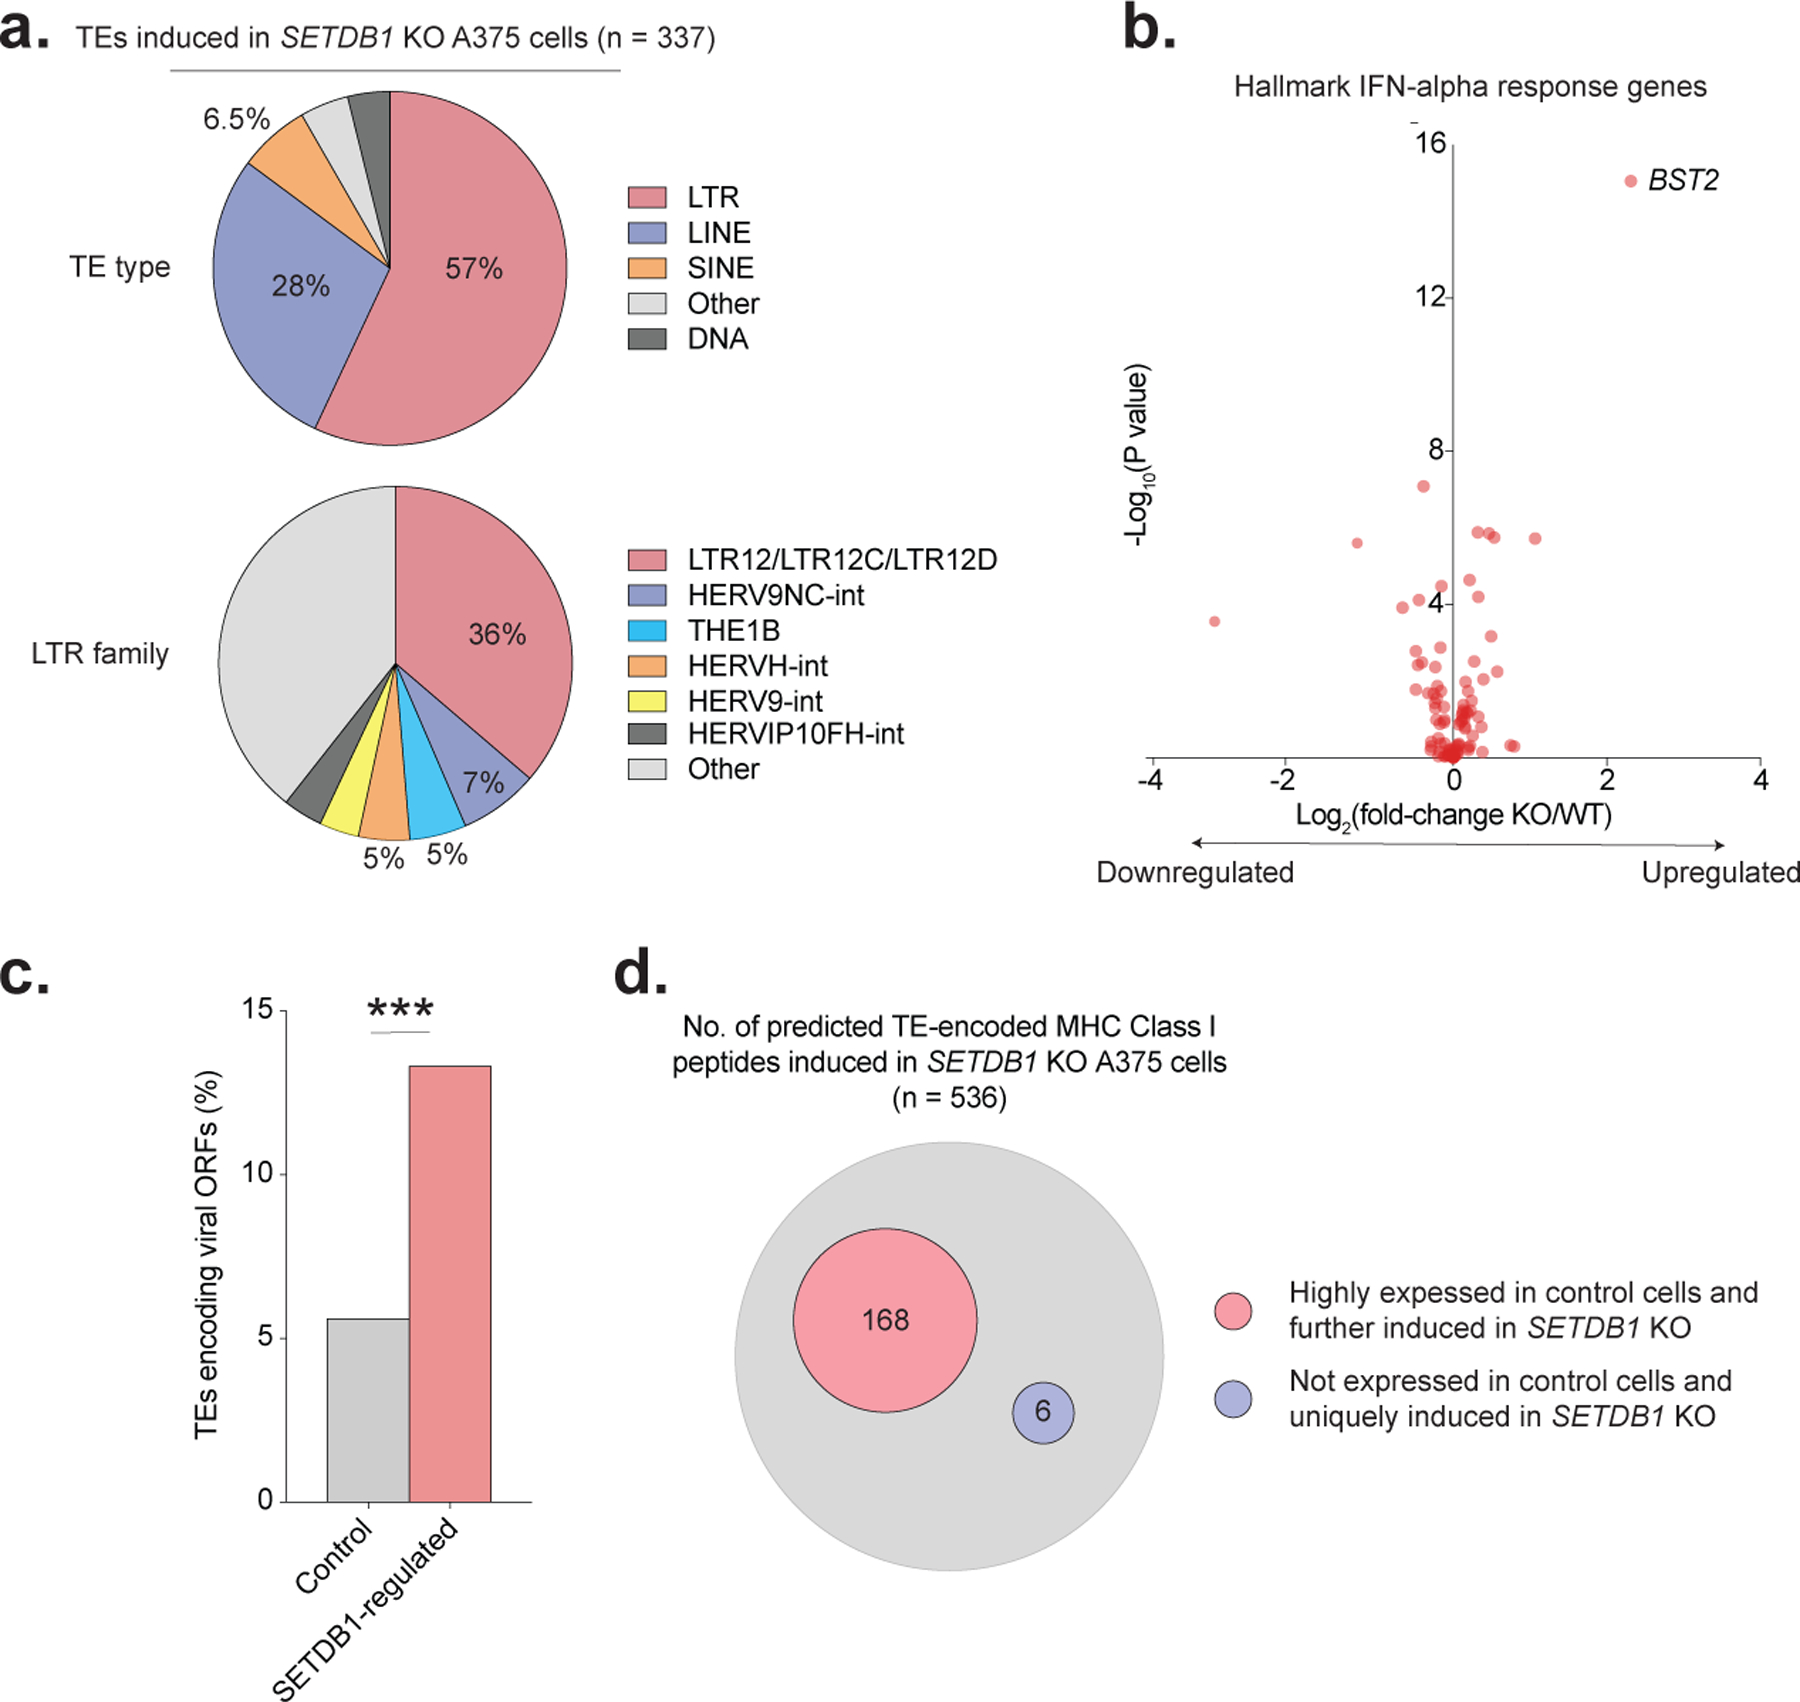
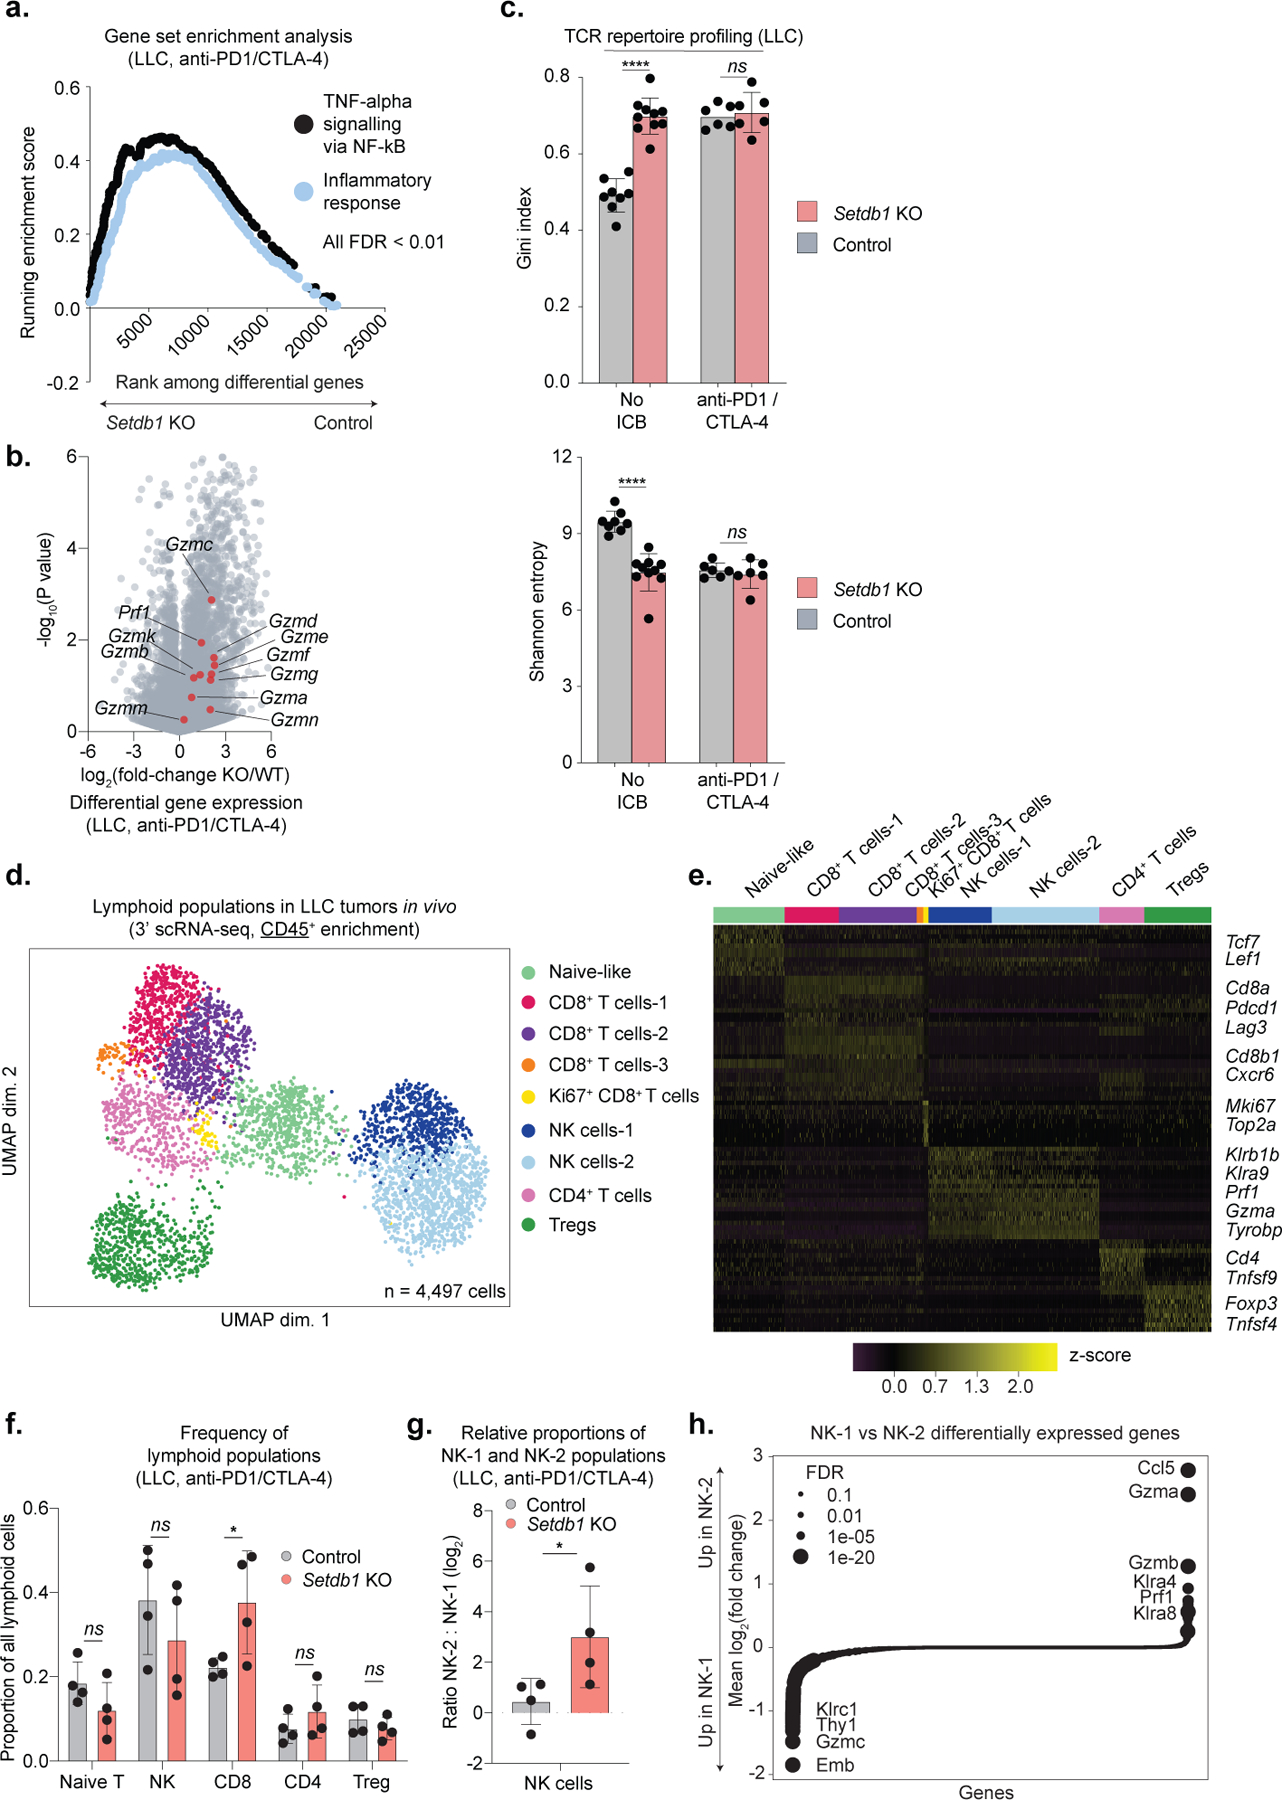
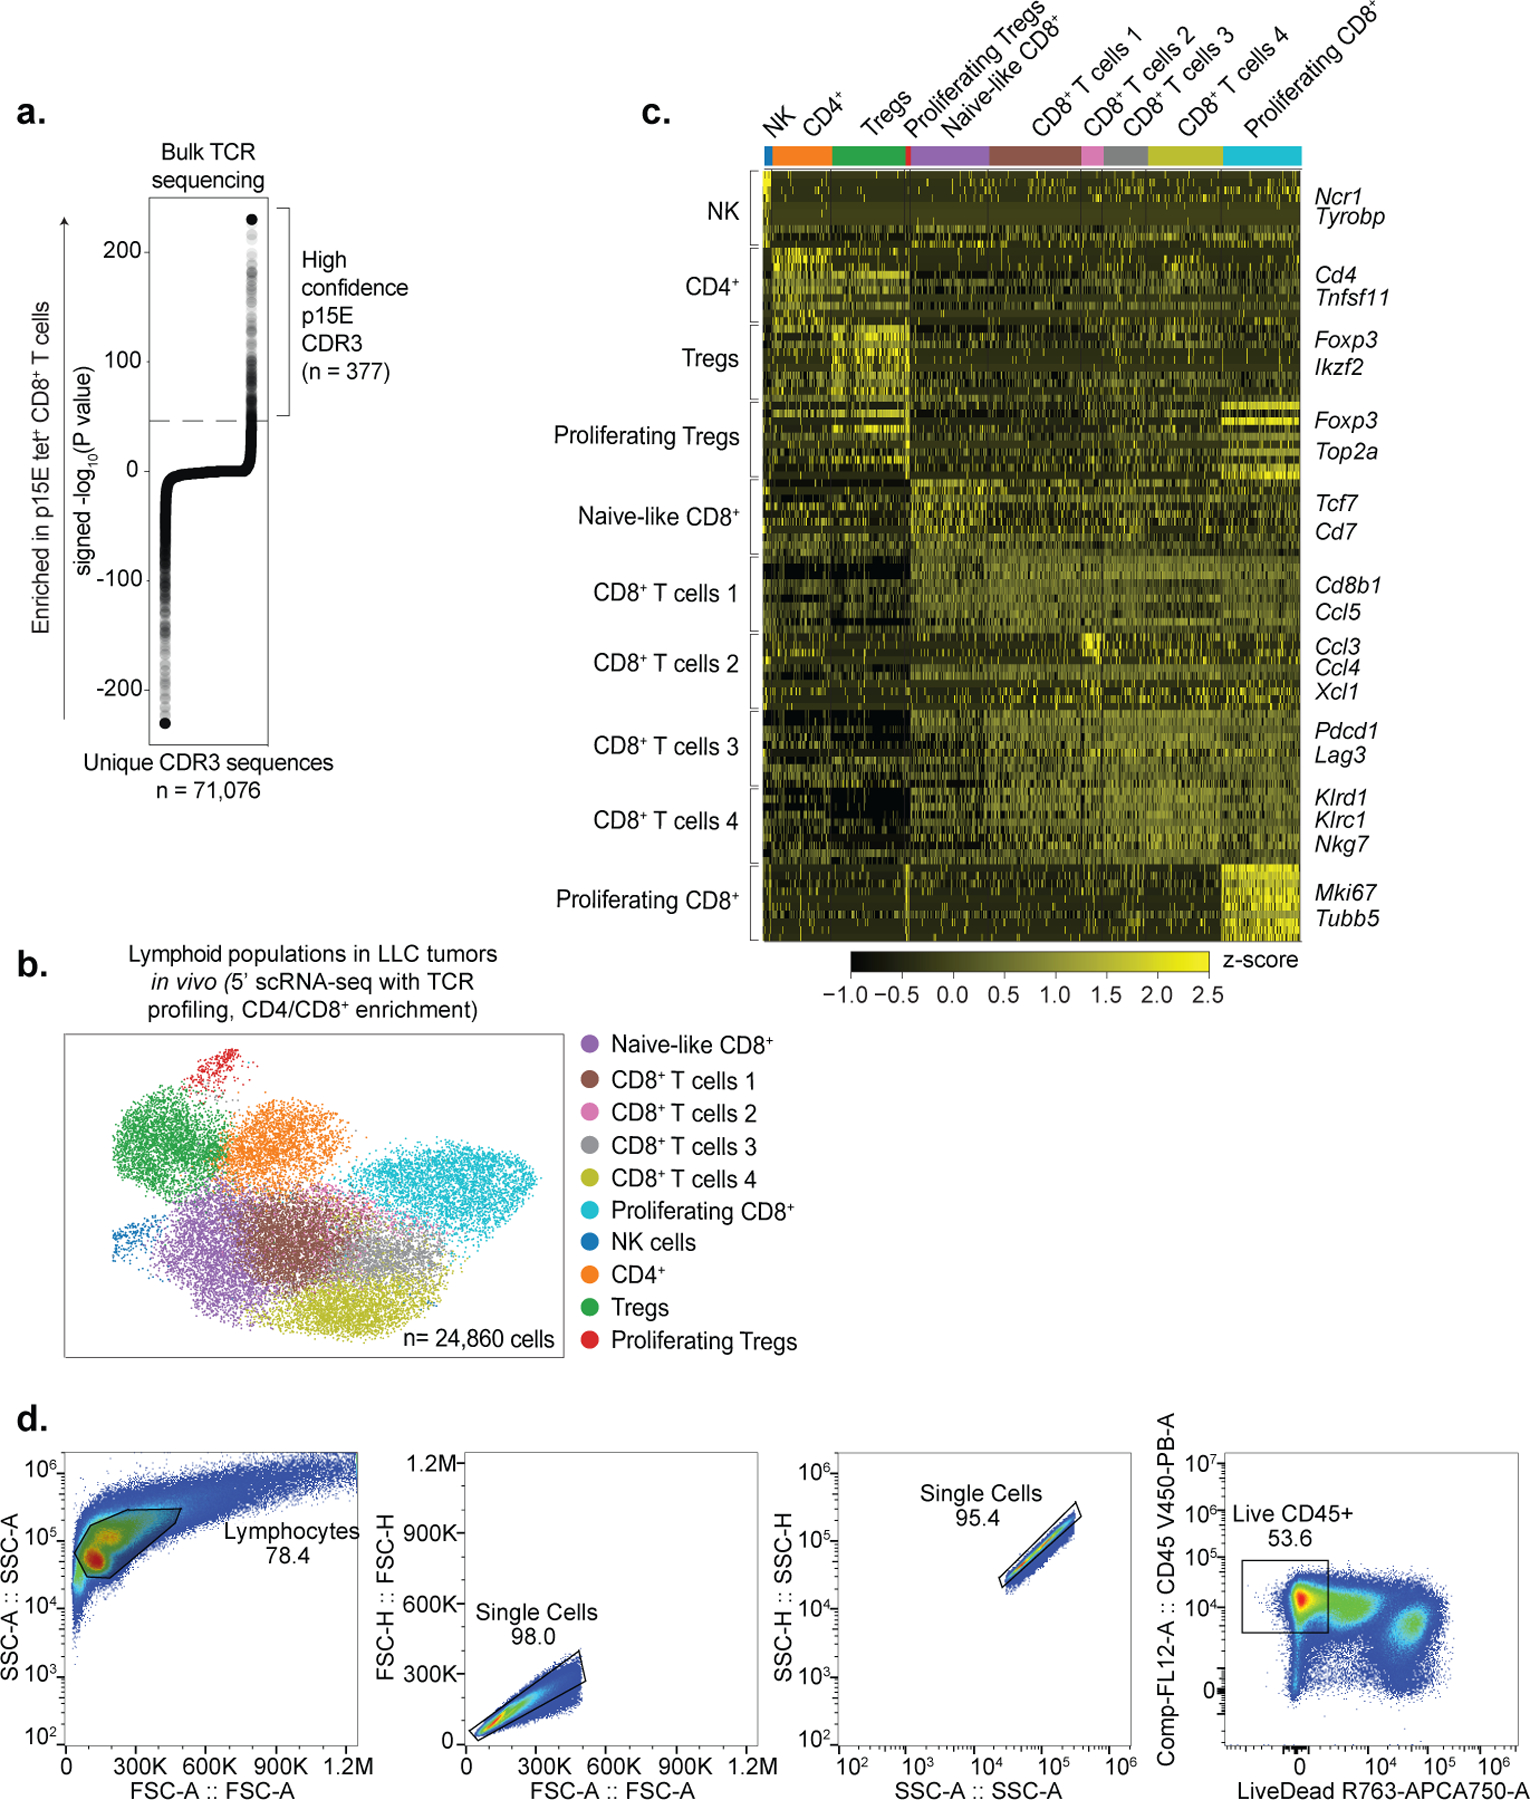
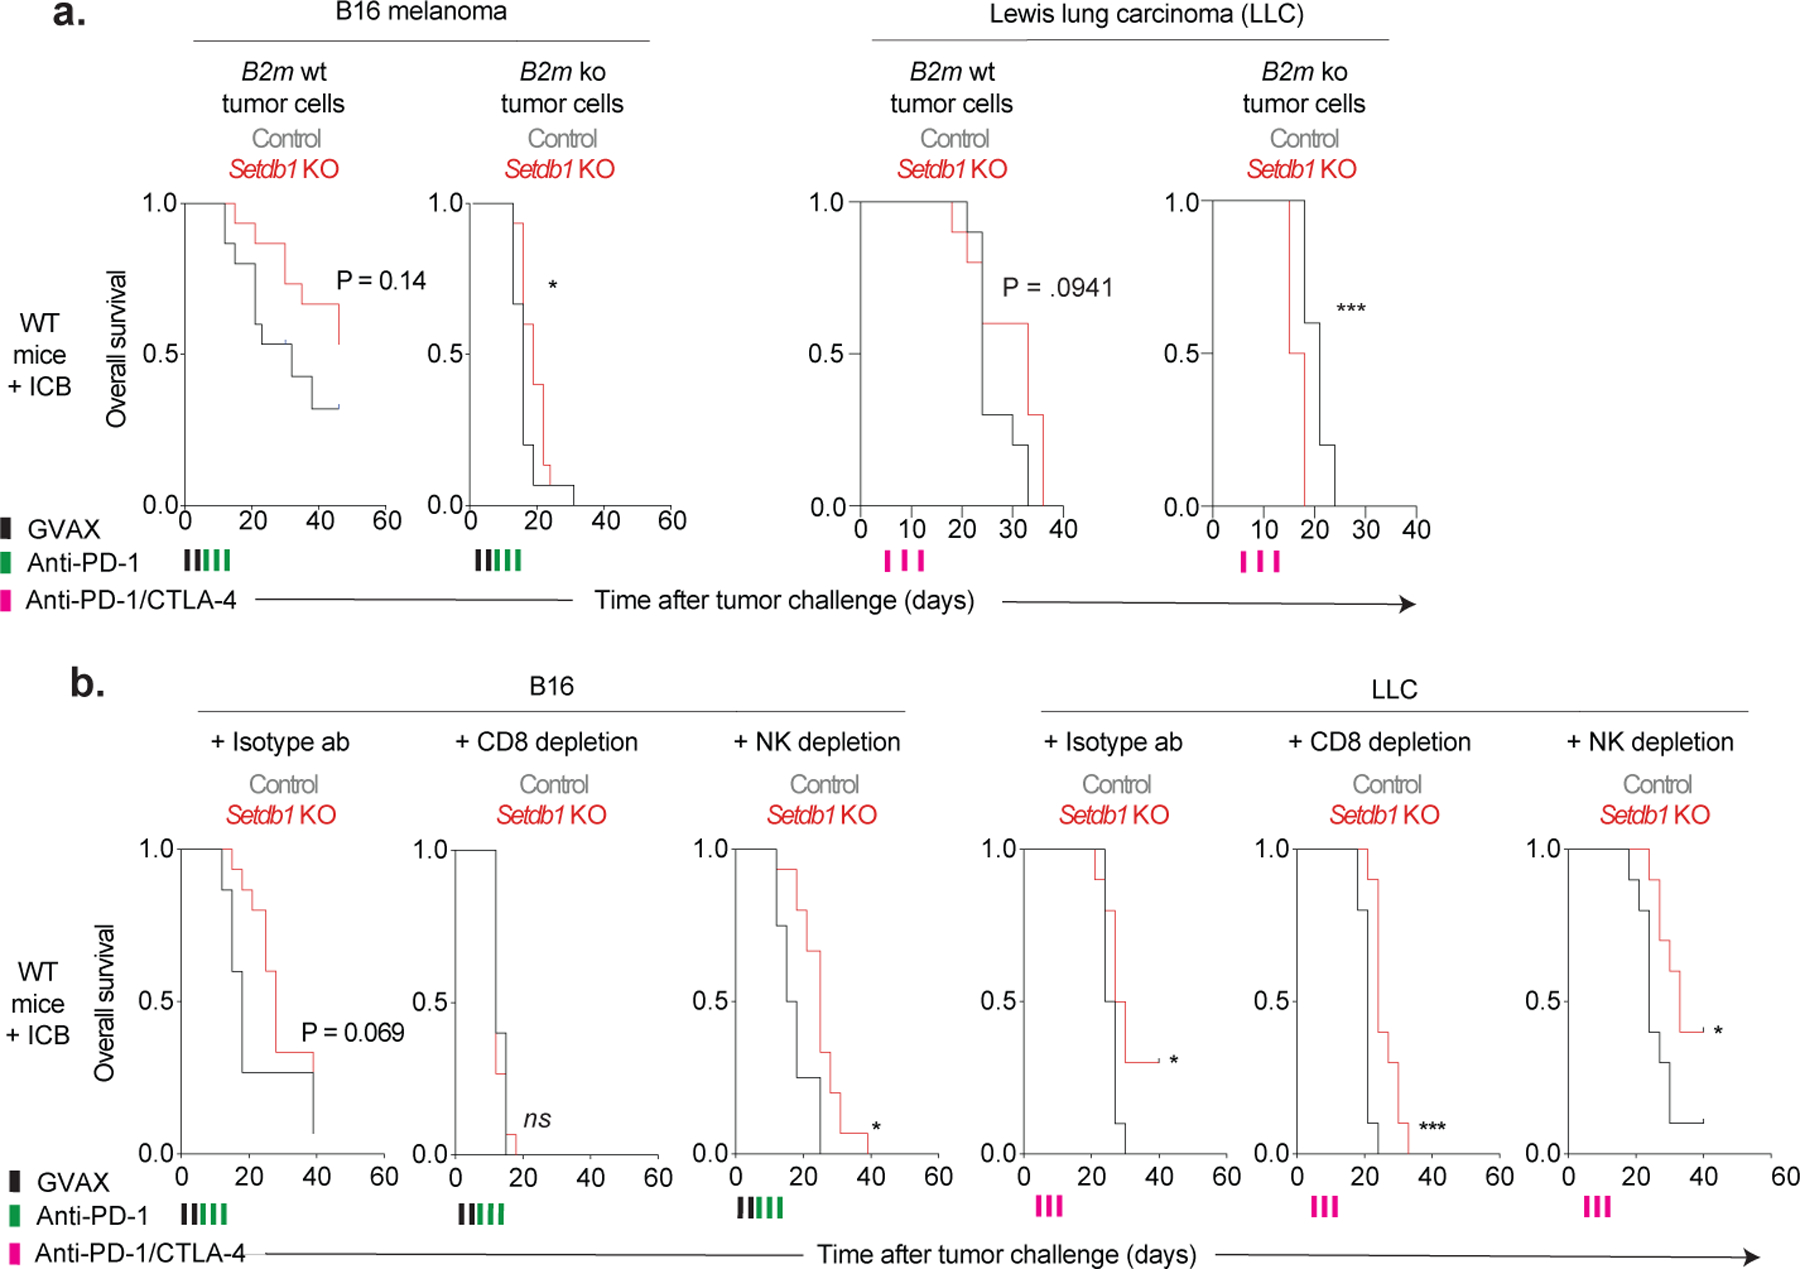
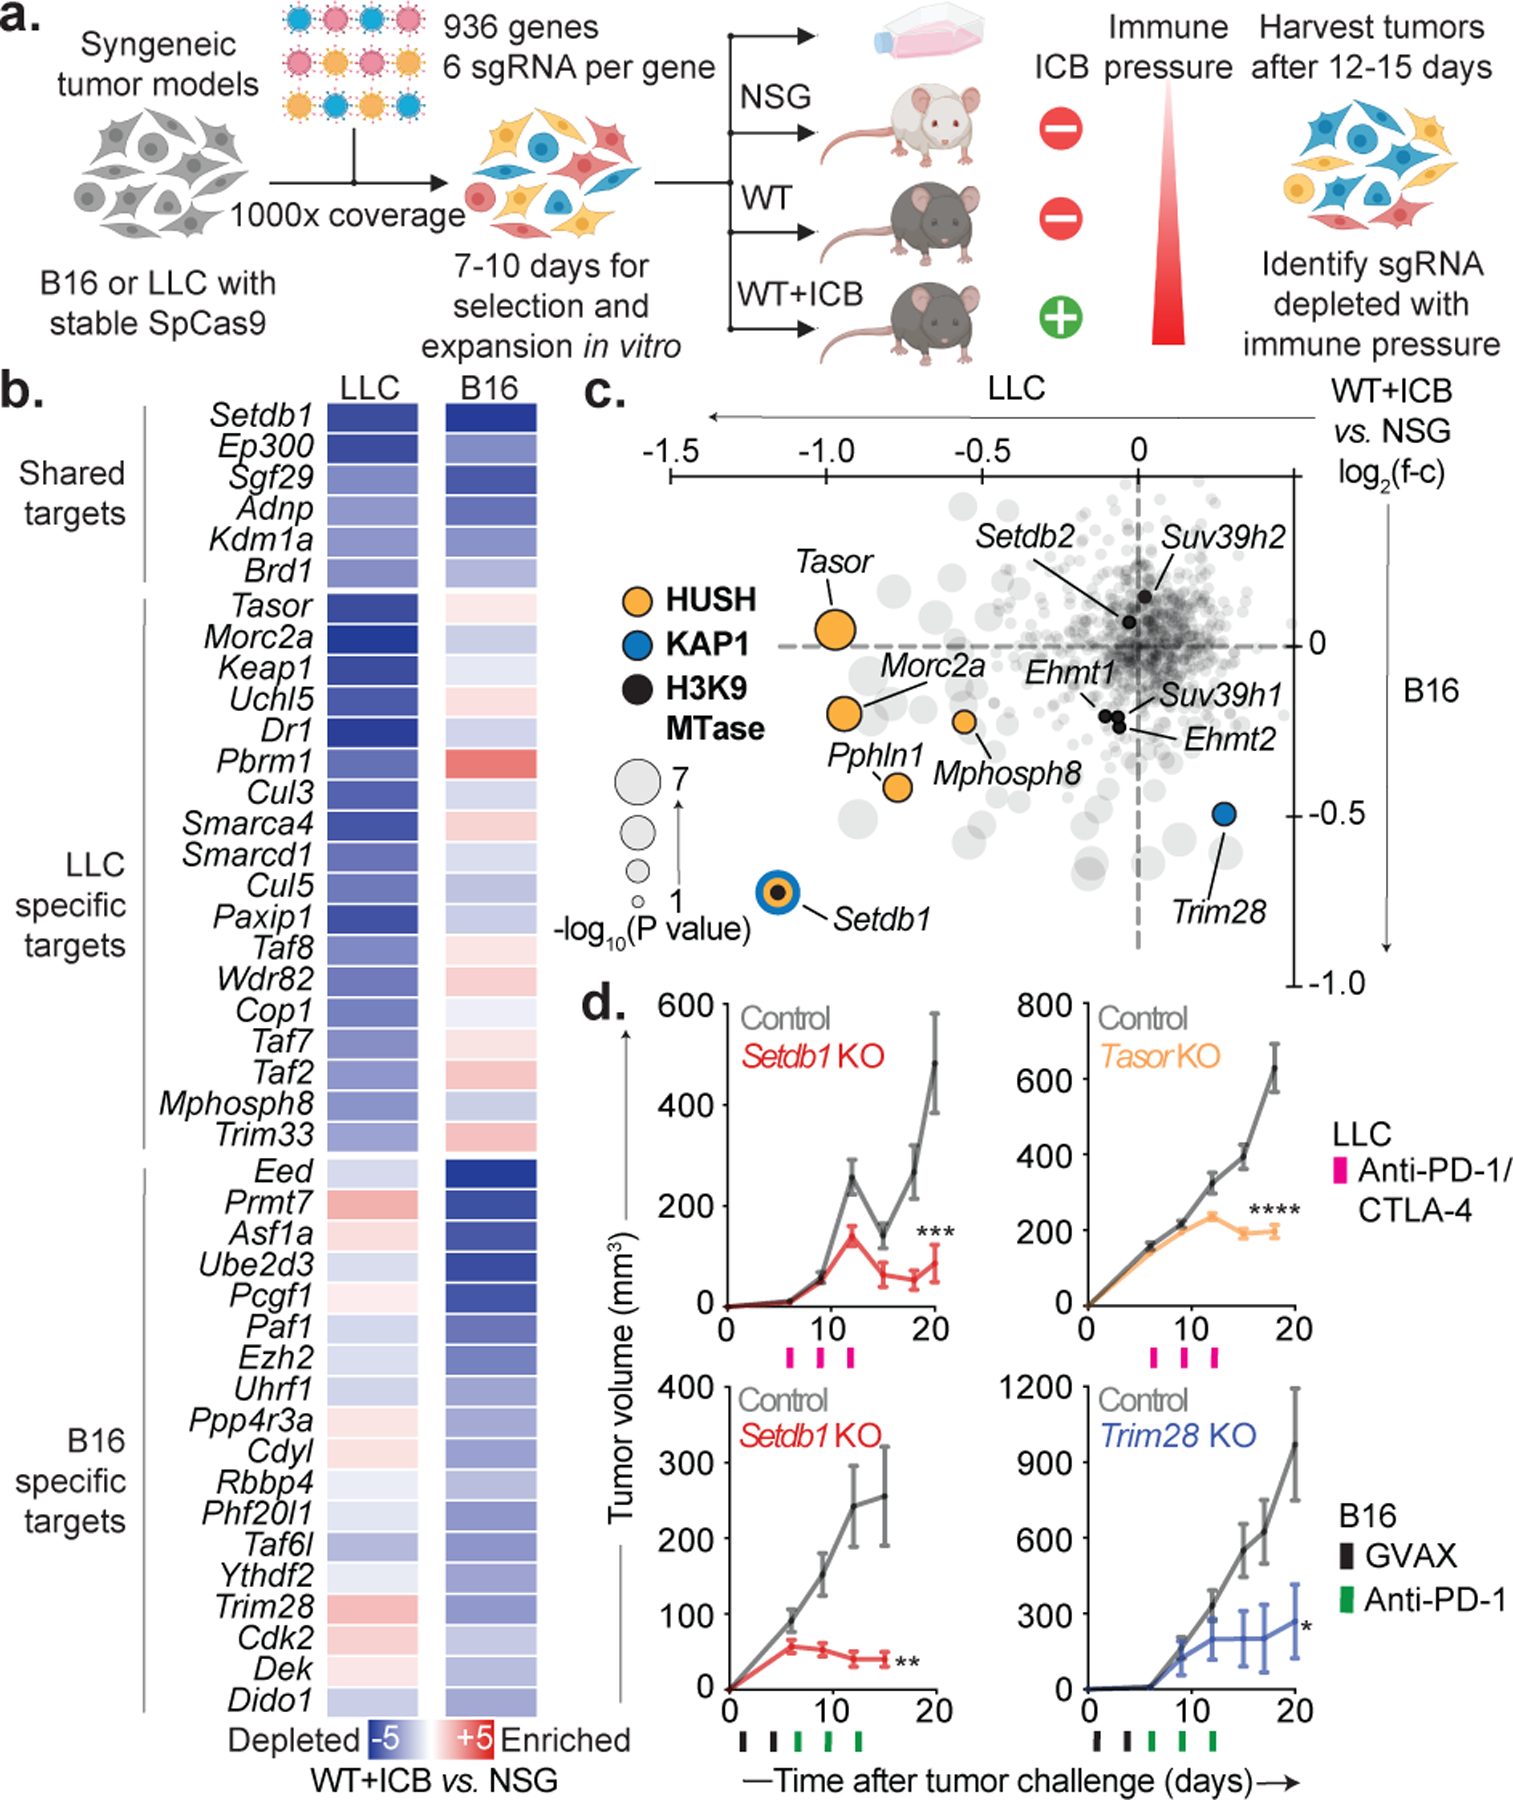
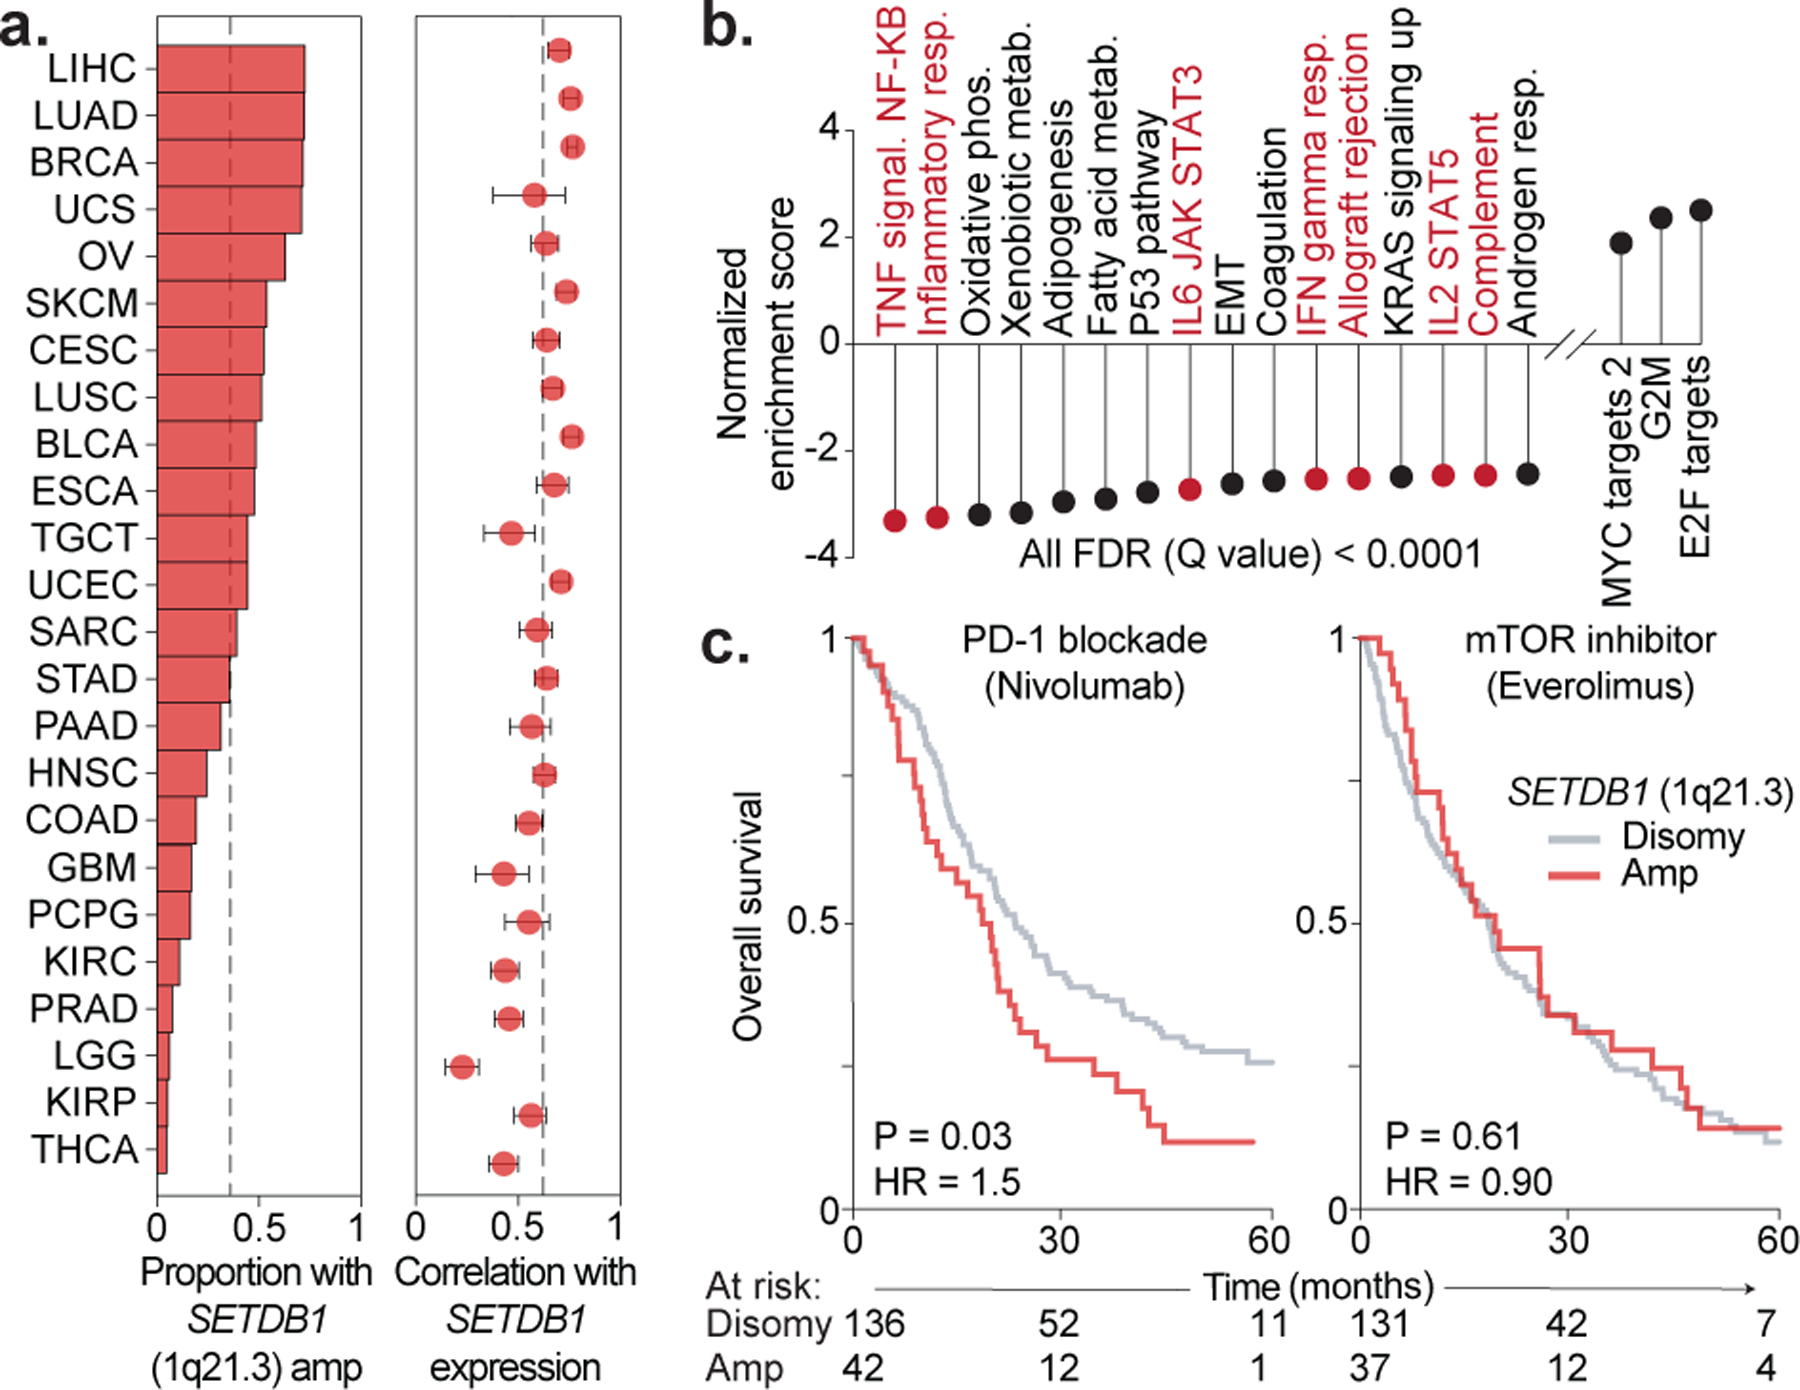
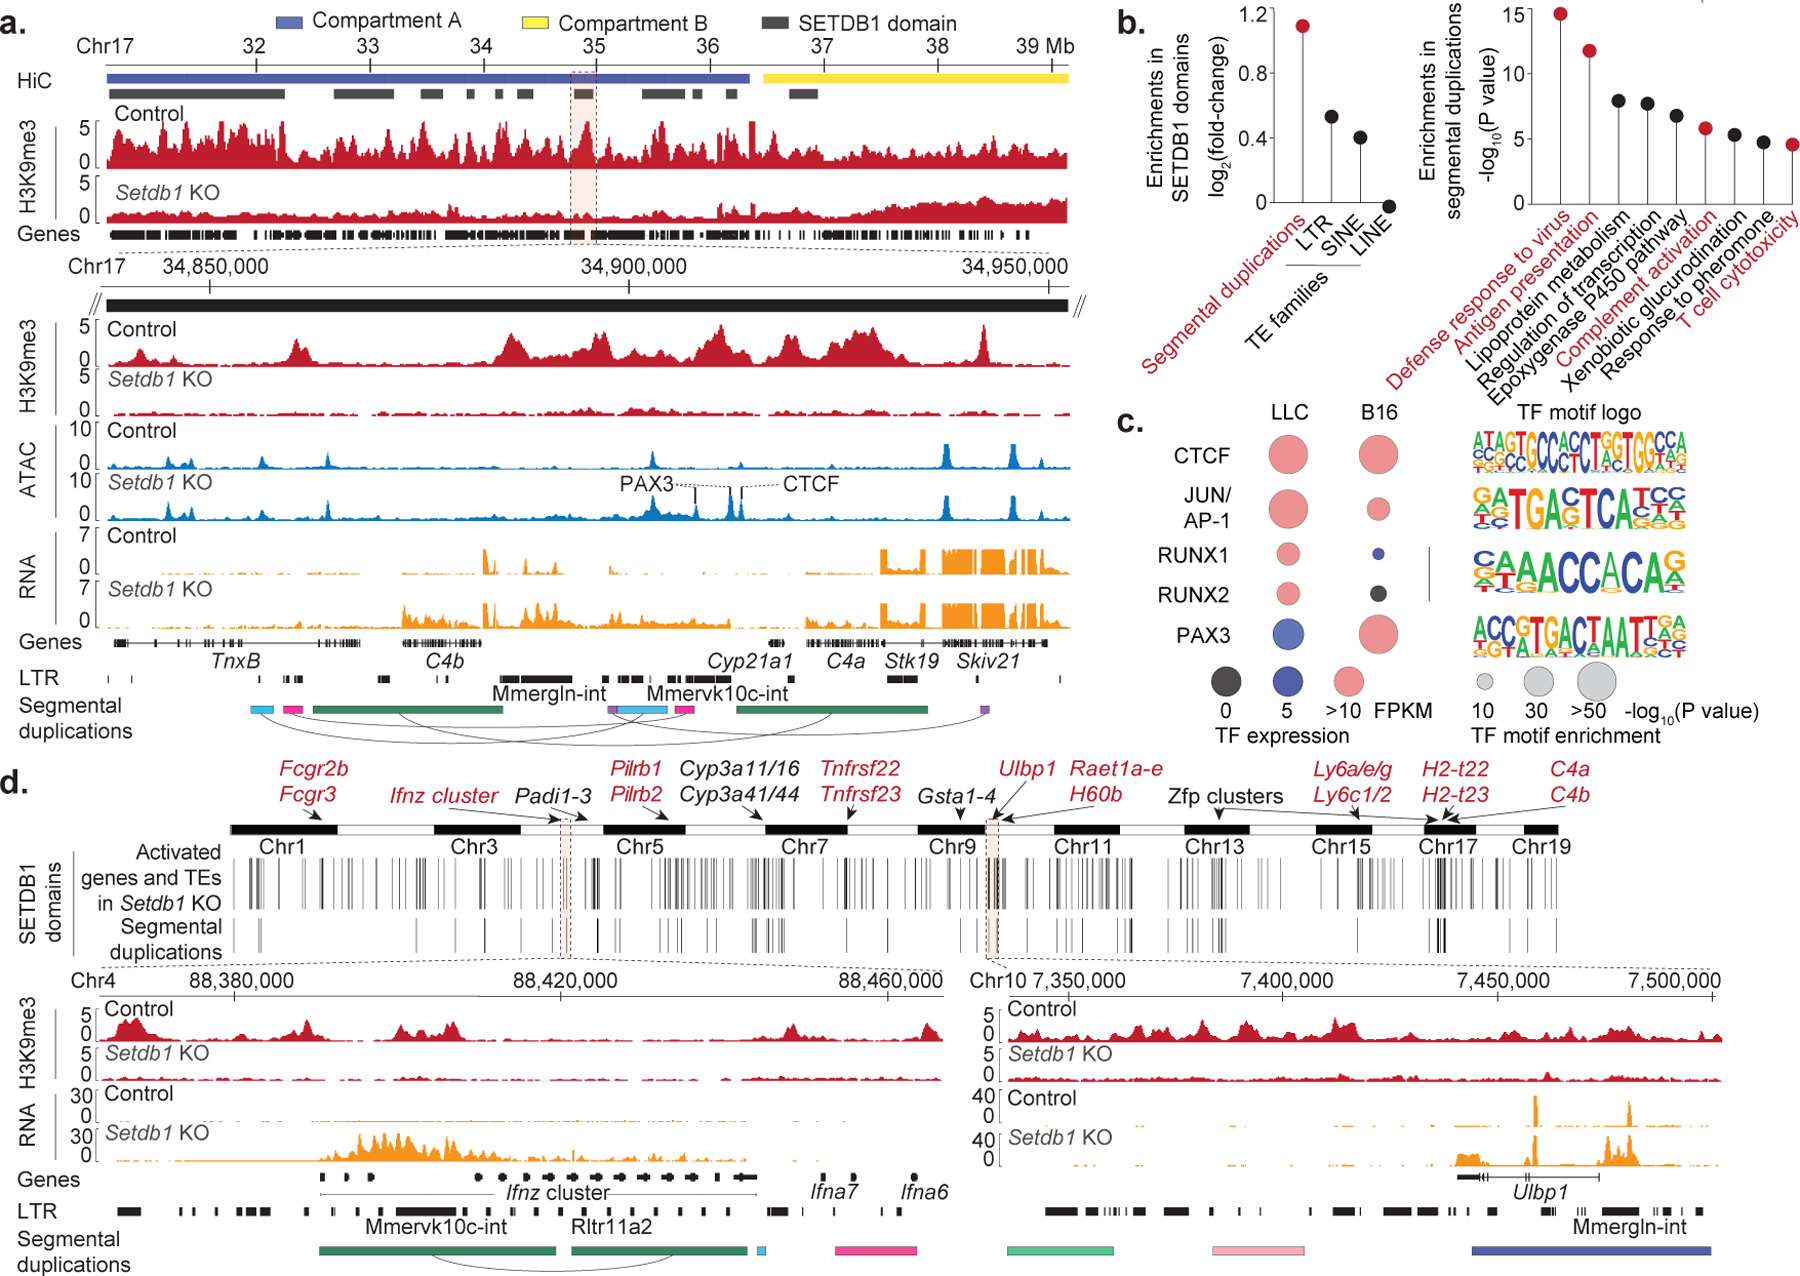
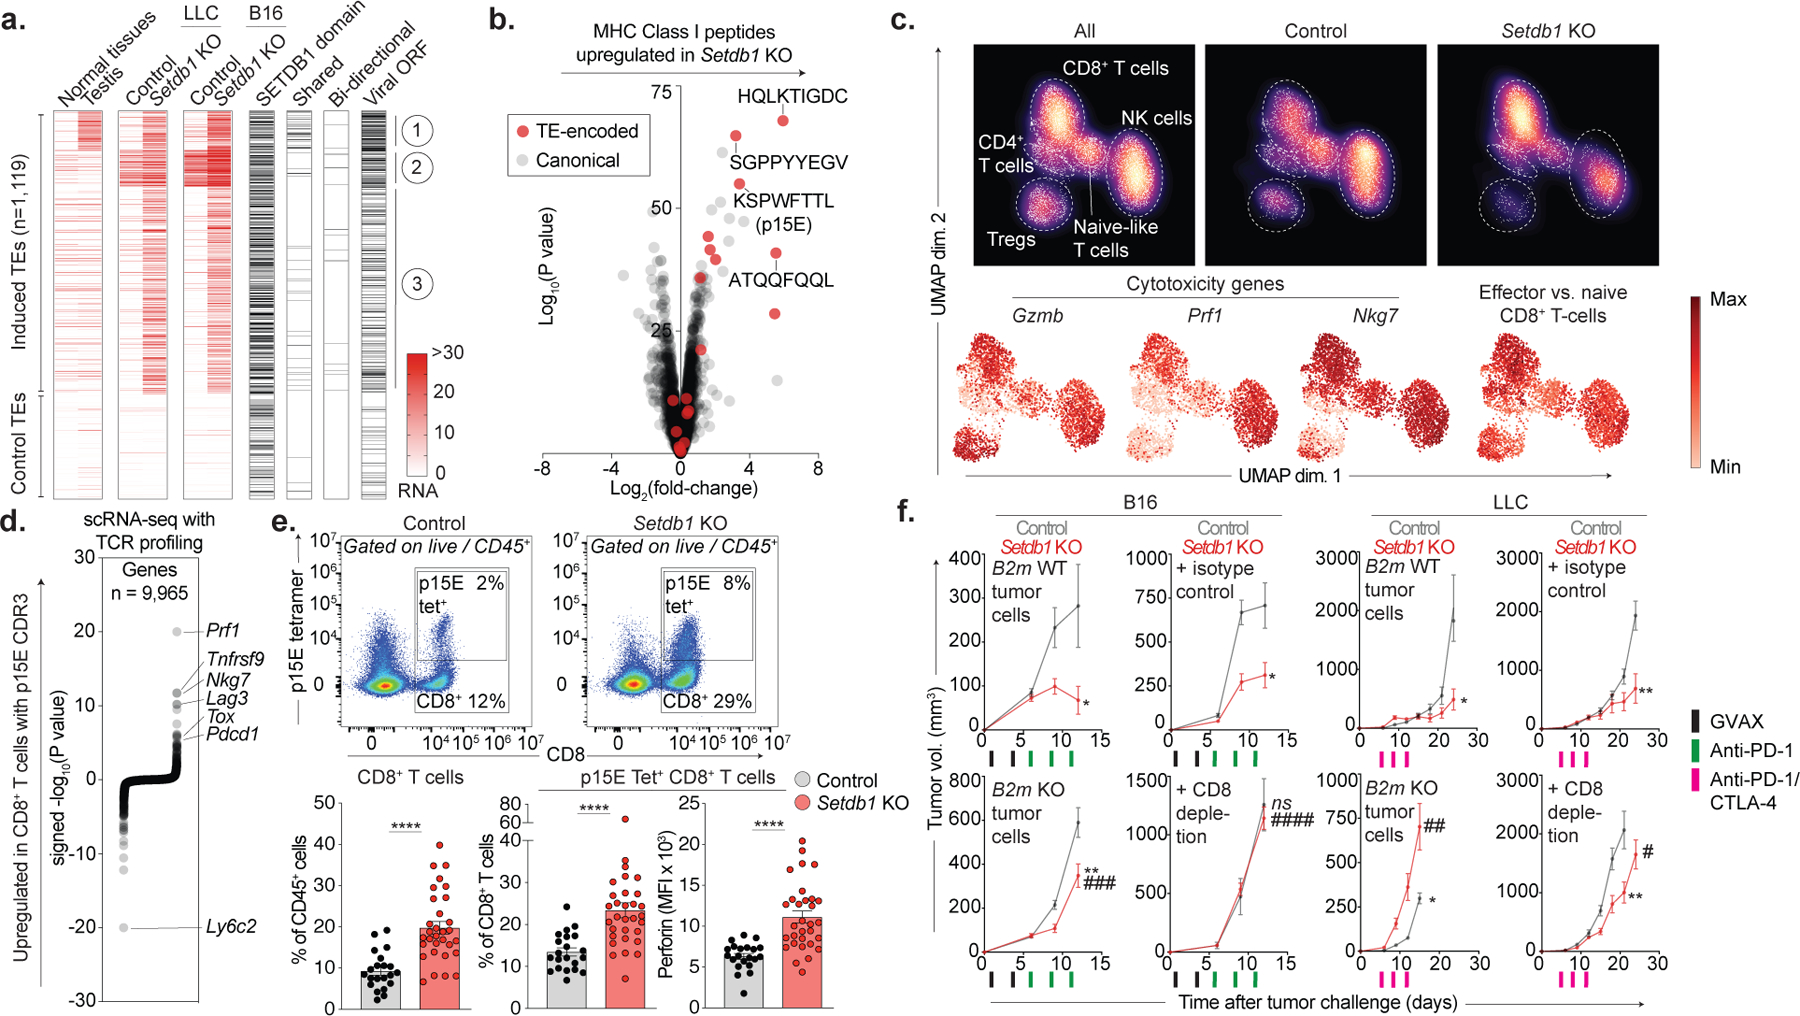
Epigenetic dysregulation is a defining feature of tumorigenesis that is implicated in immune escape1,2. Here, to identify factors that modulate the immune sensitivity of cancer cells, we performed in vivo CRISPR-Cas9 screens targeting 936 chromatin regulators in mouse tumour models treated with immune checkpoint blockade. We identified the H3K9 methyltransferase SETDB1 and other members of the HUSH and KAP1 complexes as mediators of immune escape3-5. We also found that amplification of SETDB1 (1q21.3) in human tumours is associated with immune exclusion and resistance to immune checkpoint blockade. SETDB1 represses broad domains, primarily within the open genome compartment. These domains are enriched for transposable elements (TEs) and immune clusters associated with segmental duplication events, a central mechanism of genome evolution6. SETDB1 loss derepresses latent TE-derived regulatory elements, immunostimulatory genes, and TE-encoded retroviral antigens in these regions, and triggers TE-specific cytotoxic T cell responses in vivo. Our study establishes SETDB1 as an epigenetic checkpoint that suppresses tumour-intrinsic immunogenicity, and thus represents a candidate target for immunotherapy.


Figures

Extended Data Fig. 1.
Extended Data Fig. 1.. Analysis of screening performance.
(a) Tumor volumes (mean +/− s.e.m.) of bilateral tumors (n=25 mice, n=50 individual tumors) in the LLC (top) and B16 (bottom) screens for the indicated treatment conditions on day 12 (LLC) and day 9 (B16) after tumor inoculation. Statistics by ANOVA with Tukey’s test for multiple comparisons. (b) Saturation analysis of animal replicates from the three in vivo screening conditions for LLC (top) and B16 (bottom). Pearson’s correlations are calculated for the log2 guide abundance in one animal versus any other animal, then for two averaged animals versus any other two, and so on. Saturation approaches r=0.95 for both screens. (c) RNA expression (FPKM) in LLC (x-axis) and B16 (y-axis) for the top 30 screening hits by STARS score in each cell line. Colors indicate whether the gene was depleted in LLC only (orange), B16 only (blue), or in both cell lines (red). One outlier value (x=11.7, y=248.7) for the B16-only hit, Cdk2, is excluded for ease of visualization but is included in the calculation of the correlation coefficient. (d) Depletion (negative ratios) or enrichment (positive ratios) of targeted chromatin regulator genes in ICB-treated WT versus NSG mice in the LLC (x-axis) and B16 (y-axis) screens. Circle sizes reflect the significance (−log10(P value)) of depletion in the higher scoring model. Selected genes that scored uniquely in B16 (left) or LLC (right) are highlighted and colored according to their associated chromatin regulator complexes. *P < 0.05; **P < 0.01; ***P < 0.001; ****P < 0.0001.
Extended Data Fig. 2.
Extended Data Fig. 2.. Tumor growth and survival data for Setdb1, Trim28, and HUSH complex KO.
(a) Tumor growth (mean +/− s.e.m.) in untreated WT mice (no ICB) inoculated with Setdb1 (n=10) Tasor (n=5), Mphosph8 (n=5), or Trim28 (n=5) KO LLC cells, or Setdb1 or Trim28 KO B16 cells. Data are representative of 3 (Setdb1), 1 (Tasor), 1 (Mphosph8), 1 (Trim28 in LLC), and 2 (Trim28 in B16) experiments. Statistics by two-sided Student’s t-test at the indicated time-points. (b) Tumor growth (mean +/− s.e.m.) in WT mice treated with ICB inoculated with Mphosph8 (n=20) or Trim28 (n=20) KO LLC cells. Data represent 1 independent experiment. Statistics by two-sided Student’s t-test at the indicated time-points. (c) Overall survival for untreated (top) and ICB-treated (bottom) WT mice inoculated with B16 (left) or LLC (right) tumors and corresponding to Fig. 1d and Extended Data Fig. 2a–b. Statistics by log-rank test. (d) Tumor growth (top, mean +/− s.e.m.) and overall survival (bottom) for untreated NSG mice (no ICB) inoculated with Setdb1 KO B16 (left, n=20) or LLC (right, n=15). Data represent 1 experiment. Statistics for tumor growth by two-sided Student’s t-test at the indicated time-points. Statistics for overall survival by log-rank test. *P < 0.05; ***P < 0.001; ****P < 0.0001.
Extended Data Fig. 3.
Extended Data Fig. 3.. SETDB1 (1q21.3) amplification in human TCGA and ICB-treated cohorts.
(a) Running enrichment scores by GSEA for immune gene sets significantly (FDR <0.001) anti-correlated with SETDB1 expression by Pearson’s correlation across TCGA cohorts. (b) Pearson’s correlation between SETDB1 expression and cytolytic score (geometric mean of PRF1 and GZMA expression) in TCGA cohorts. Circle size indicates statistical significance (−log10(P value)) of the Pearson’s correlation. (c) Bootstrap analysis plotting the rank of the correlation between cytolytic score and SETDB1 expression (red lines) in each TCGA cohort, compared to 408 randomly selected control genes (grey lines). (d) Kaplan-Meier curves for patients with renal cell carcinoma treated with PD-1 blockade (left, nivolumab) or mTOR inhibitor (right, everolimus). Overall survival curves are stratified according to SETDB1 expression (top 50% = high expression, bottom 50% = low expression). Hazard ratios associated with SETDB1 high expression are listed. The number of patients-at-risk are indicated for each timepoint. Statistics by log-rank test. (e) Bootstrap analysis showing the impact of GISTIC2-defined copy-number alterations (CNA) on overall survival in patients treated with mTOR inhibitor (left, everolimus) or PD-1 blockade (right, nivolumab). Positive values indicate a CNA that has a harmful impact on survival with ICB or mTOR inhibitor, and negative values indicate a CNA that has a beneficial effect. 1q21.3 amplification (red) is highlighted alongside chromosomal regions previously reported as predictors of ICB response in RCC, including 10q23.31 deletion (associated with improved response) and 9p21.3 deletion (associated with poor response).
Extended Data Fig. 4.
Extended Data Fig. 4.. Identification of SETDB1 domains.
(a) Heatmap of H3K9me3 peaks (rows, FPKM) in control and Setdb1 KO LLC (left) and B16 (right) cells. Peaks are separated based on whether they were lost (top) or retained (bottom) in Setdb1 KO cells, and annotated by whether they are located in the open compartment A of the genome. Statistics for compartment A enrichment by permutation testing. (b) The number of 100kb windows containing the indicated numbers of SETDB1-dependent H3K9me3 peaks in B16 (left) or LLC (right) cells, compared to random control peaks. Statistics by Chi-square test. (c) Workflow for annotation of SETDB1-domains from H3K9me3 ChIP-seq data in LLC and B16 cells. *P < 0.05; ****P < 0.0001.
Extended Data Fig. 5.
Extended Data Fig. 5.. TE-encoded regulatory elements in Setdb1 KO LLC and B16 cells.
(a) Proportion of chromatin accessible sites (ATAC-seq) gained in Setdb1 KO LLC or B16 cells that are located within (red) or outside (grey) SETDB1 domains. (b) Proportion of ATAC-seq sites gained in Setdb1 KO LLC or B16 cells that coincide with promoters (light grey), distal TEs (red), or other promoter-distal sites (dark grey). Statistics by permutation testing. (c) Proportion of gained ATAC-seq sites at distal TEs in Setdb1 KO B16 cells that also gain H3K27 acetylation and resemble active enhancers. (d) Coordinate gain of chromatin accessibility and H3K27 acetylation at an example TE-site in Setdb1 KO B16 cells. (e) Activation of genes near (<50kb) gained ATAC-seq sites at distal TEs in Setdb1 KO LLC or B16 cells compared to control genes. Statistics by permutation testing. (f-h) Flow cytometry in control and Setdb1 KO cells showing (f) gating strategy, (g) cell-surface expression (y-axis, median fluorescence intensity (MFI)) for ULBP1 and RAET1 ligands in LLC (left), and MHC-I expression in LLC and B16 (right) +/− induction with IFNγ (10ng/mL, 24hr). Data are mean +/− s.e.m. and reflect 2 independent experiments with 4 biological replicates. Statistics by two-sided Student’s t-test. *P < 0.05; **P < 0.01.
Extended Data Fig. 6.
Extended Data Fig. 6.. Gene and TE expression in Setdb1 KO LLC and B16 cells.
(a) Distribution of TE types (top) and LTR subfamilies (bottom) induced in Setdb1 KO LLC or B16 cells by RNA-seq. (b) Heatmap showing RNA expression (row normalized) of canonical interferon-stimulated genes in untreated and poly(I:C) stimulated (500ng/ml, 48hrs) control and Setdb1 KO LLC and B16 cells. (c) Percentage of TEs induced in Setdb1 KO LLC or B16 cells that retain intact viral ORFs, compared to control TEs. Statistics by Fisher’s exact test. (d) Flow cytometry for cell-surface expression of the MuLV envelope protein in Setdb1 KO LLC and B16 cells. Gating strategy (left) and histograms (right) with mode-normalized cell counts are shown. Data are representative of n=3 and n=2 experiments in LLC and B16, respectively. (e) Differential protein expression in B16 cells by whole-cell mass spectrometry. Tryptic protein sequences derived from TEs (red) or canonical proteins (grey) are highlighted. Fold-change (x-axis) and statistical significance (y-axis) for proteins in Setdb1 KO versus control are shown. (f) Venn-diagrams showing the number of predicted, unique TE-encoded H2-Kb/H2-Db binding peptides in LLC and B16 cells by GRCm38 RNA-seq analysis. Diagrams show the total number of predicted, TE-encoded MHC Class I peptides in LLC and B16 cells (left), and subsets showing (i) high expression in control cells and further induction upon Setdb1 KO (middle), and (ii) no detectable expression in control cells and strong induction only upon Setdb1 KO (right). Several MuLV-encoded peptides known to be presented by H2-Kb or H2-Db are highlighted. ***P < 0.001. ****P < 0.0001.
Extended Data Fig. 7.
Extended Data Fig. 7.. TE expression in SETDB1 KO A375 cells.
(a) Distribution of TE types (top) and LTR subfamilies (bottom) induced in SETDB1 KO A375 cells by RNA-seq. (b) Volcano plot of Hallmark IFN-alpha response genes in A375 cells by RNA-seq. Fold-change (x-axis) and statistical significance (y-axis) in SETDB1 KO versus control are shown. (c) Percentage of TEs induced in Setdb1 KO A375 cells that retain intact viral ORFs compared to control TEs. Statistics by Fisher’s exact test. (d) Diagram showing the total number of predicted, unique TE-encoded MHC-I peptides induced in SETDB1 KO A375 cells by RNA-seq. Binding predictions are based on A375-specific HLA types (see Methods). Subsets of predicted TE-encoded MHC-I peptides with (i) high expression in control cells and further induction upon SETDB1 KO, or (ii) no detectable expression in control cells and strong induction only upon SETDB1 KO, are highlighted. ***P < 0.001. ****P < 0.0001.
Extended Data Fig. 8.
Extended Data Fig. 8.. Gene expression and scRNA-seq analysis of immune infiltration in LLC tumors.
(a-c) Transcriptional profiling with RNA-seq performed on bulk tumor tissue from control (n=8 untreated and n=6 ICB-treated) and Setdb1 KO (n=10 untreated and n=6 ICB-treated) LLC tumors. Data represent 1 experiment. (a) Running enrichment scores by GSEA for immune gene sets significantly (FDR <0.01) upregulated in Setdb1 KO LLC tumors treated with ICB relative to controls. (b) Volcano plot depicts expression fold-change (x-axis) and statistical significance (y-axis) of cytotoxicity genes (red) and all other genes (grey) in Setdb1 KO LLC tumors treated with ICB relative to controls. (c) TCR repertoire profiling with targeted sequencing of alpha and beta-chain variable regions from Setdb1 KO LLC tumors (untreated and ICB-treated) relative to controls. Variation in clonotype abundance (skewing) is represented by the Gini index (left, higher number indicates greater skewness) and Shannon entropy (right, lower number indicates greater skewness). Data are mean +/− s.e.m. Statistics by two-sided Student’s t-test. (d-h) scRNA-seq (3’) analysis of immune cells (CD45+-enrichment) from control (n=3 untreated, n=4 ICB-treated) or Setdb1 KO (n=3 untreated, n=4 ICB-treated) LLC tumors. Data are from 1 experiment. (d) UMAP plots highlight 4,497 cells and associated clusters identified in the lymphoid compartment. (e) Representative marker genes used to identify and annotate cell clusters in (d). (f) Changes in lymphoid populations in ICB-treated tumors (n=4 control, n=4 Setdb1 KO) as a proportion of the total lymphoid population. Data are mean +/− s.e.m. Statistics by two-sided Student’s t-test. (g) Ratio of NK-2 to NK-1 cells in ICB-treated samples. Data are mean +/− s.e.m. Statistics by Mann-Whitney U. (h) Differentially expressed genes (log2(fold-change)) in NK-2 vs NK-1 cells. Circle sizes indicate statistical significance (FDR). *P < 0.05. ****P < 0.0001.
Extended Data Fig. 9.
Extended Data Fig. 9.. TCR profiling and scRNA-seq of p15E-specific T cells isolated from control and Setdb1 KO LLC tumors.
(a) Unique CDR3 sequences (x-axis) identified from TCR sequencing of flow-sorted p15E-tetramer-positive CD8+ T-cells isolated from control LLC tumors. High-confidence CDR3 sequences (n = 377) are highlighted by brackets and identified based on strong statistical enrichment (−log10(P value) > 46 cut-off indicated by dotted line, see Methods) within the p15E-tetramer-positive fraction. (b-c) scRNA-seq (5’) of 24,860 lymphoid cells (CD4+/CD8+-enrichment) isolated from control (n=4 untreated, n=4 ICB-treated) and Setdb1 KO (n=3 untreated, n=3 ICB-treated) LLC tumors. (b) UMAP plot highlights cell populations identified among CD4+/CD8+-enriched lymphoid cells. (c) Representative marker genes used to identify and annotate cell clusters in (b). (d) Representative flow cytometry gating strategy for p15E-tetramer studies. Corresponds to Fig. 4e. *P < 0.05.
Extended Data Fig. 10.
Extended Data Fig. 10.. Survival data and functional studies evaluating MHC-I ablation, CD8 depletion, and NK depletion in Setdb1 KO cells.
(a) Overall survival for ICB-treated WT mice inoculated with control and Setdb1 KO B16 (left) or LLC (right) cells with intact (B2m WT) or deficient (B2m KO) MHC-I, as detailed in Fig. 4f and Methods. Statistics by log-rank test. (b) Overall survival for ICB-treated WT mice inoculated with control or Setdb1 KO B16 (left) or LLC (right) cells that received intraperitoneal injections with isotype (left), CD8-depleting (middle), or NK-depleting (right) antibodies starting on day −3 prior to tumor challenge and continuing every 3 days until day 18, as detailed in Fig. 4f and Methods. Statistics by log-rank test. *P < 0.05; ***P < 0.001.
Figure 1.
Figure 1.. In vivo chromatin regulator screens.
(a) Chromatin regulator screens in B16 and LLC. (b) Depletion (blue) or enrichment (red) of targeted genes in ICB-treated WT versus NSG mice grouped by top shared and cell-specific hits. (c) Depletion (negative ratios) or enrichment (positive ratios) of targeted genes (grey) in ICB-treated WT versus NSG mice with Setdb1, Trim28 (KAP1), HUSH complex, and other H3K9-methyltransferases highlighted. (d) Tumor growth (mean volume +/− s.e.m.) for ICB-treated WT mice inoculated with Setdb1 (n=20) or Tasor KO (n=20) LLC (top), and Setdb1 (n=20) or Trim28 KO (n=5) B16 (bottom). Data are representative of 3 (Setdb1), 1 (Tasor), and 2 (Trim28) independent experiments with 2 distinct sgRNA. Statistics by two-sided Student’s t-test at indicated time-points. *P < 0.05; **P < 0.01; ***P < 0.001; ****P < 0.0001.
Figure 2.
Figure 2.. SETDB1 (1q21.3) amplification in human tumors.
(a) Proportion of TCGA cases with SETDB1 high or low-level amplification (left), and Pearson’s correlation with 95% c.i. between SETDB1 copy-number and RNA (right). Dotted lines indicate median values. (b) Normalized enrichment scores of Hallmark gene sets correlated with SETDB1 expression. (c) Kaplan-Meier curves for renal cell carcinoma patients treated with PD-1 blockade or mTOR inhibitor and stratified by SETDB1 amplification. Hazard ratios associated with SETDB1 amplification are listed. Statistics by log-rank test.
Figure 3.
Figure 3.. SETDB1 targets evolving genomic loci.
(a) Tracks show H3K9me3 ChIP-seq, genomic compartments, SETDB1 domains, and genes in control and Setdb1 KO B16 for a 9Mb interval of chr17. Expanded view (below) of the C4a/b locus shows ATAC-seq, RNA-seq, LTRs, and segmental duplications paired by arcs. (b) Enrichment analyses for segmental duplications and TEs within SETDB1 domains (left), and gene-ontology categories within SETDB1 domains overlapping segmental duplications (right). Statistics by permutation and hyper-geometric tests. (c) Basal expression, motif enrichment, and logos for TFs enriched within TE-associated ATAC-seq sites gained in Setdb1 KO cells. Enrichment statistics by binomial test. (d) Genome-wide view (top) shows SETDB1 domains and overlapping segmental duplications (>10kb) exhibiting coordinate activation of genes and TEs upon Setdb1 KO. Expanded views (bottom) show the Ifnz and Ulbp1 loci.
Figure 4.
Figure 4.. SETDB1 loss induces TE-encoded viral antigens.
(a) Heatmap shows RNA expression for TE insertions (rows) activated upon Setdb1 KO (top) versus downsampled controls (bottom). Median expression across 17 normal tissues and testis is indicated. Additional columns identify TEs within SETDB1 domains, and those that are activated in Setdb1 KO LLC and B16 (shared), undergo bidirectional transcription, or retain intact viral ORFs. (b) MHC-I peptidomics of LLC depicts TE-encoded (red) and canonical (grey) peptides in Setdb1 KO versus control. (c) UMAP density plots (top) of scRNA-seq (3’) for 4,497 lymphoid cells identified within CD45+-enriched immune cells from control (n=7) or Setdb1 KO (n=7) LLC tumors. Red heat (bottom) depicts expression of cytotoxicity genes and an effector CD8+ T-cell signature. Data represent one experiment. (d) scRNA-seq (5’) with TCR profiling of 9,526 CD8+ T-cells identified within CD4+/CD8+-enriched cells from control (n=8) or Setdb1 KO (n=6) LLC tumors. Plot shows differential expression of genes in CD8+ T-cells with p15E-specific TCRs versus T-cells with TCRs of no known specificity. Data represent one experiment. (e) Flow cytometry of total and p15E-specific CD8+ T-cells isolated from control (n=20) and Setdb1 KO (n=30) LLC tumors. Data are mean +/− s.e.m and representative of two experiments. Statistics by two-sided Student’s t-test. (f) Tumor growth (mean volume +/−s.e.m) for ICB-treated mice inoculated with control or Setdb1 KO tumor cells with intact (B2m WT) or deficient (B2m KO) MHC-I. Analogous curves shown for mice receiving isotype-control or CD8-depleting antibodies. Data represent 1 experiment in each cell-line (n=10 in LLC and n=15 in B16 per genotype/treatment). Statistics by two-sided Student’s t-test at indicated time-points. Stars and pound-signs indicate significance within or across the indicated genotypes/treatments, respectively. */#P < 0.05; **/##P < 0.01; ***/###P < 0.001; ****/####P < 0.0001.

Comment in

References

    1. Jones PA, Ohtani H, Chakravarthy A & De Carvalho DD Epigenetic therapy in immune-oncology. Nat. Rev. Cancer 19, 151–161 (2019). - PubMed
    1. Topper MJ, Vaz M, Marrone KA, Brahmer JR & Baylin SB The emerging role of epigenetic therapeutics in immuno-oncology. Nat. Rev. Clin. Oncol 17, 75–90 (2020). - PMC - PubMed
    1. Matsui T et al. Proviral silencing in embryonic stem cells requires the histone methyltransferase ESET. Nature 464, 927–931 (2010). - PubMed
    1. Rowe HM et al. KAP1 controls endogenous retroviruses in embryonic stem cells. Nature 463, 237–240 (2010). - PubMed
    1. Tchasovnikarova IA et al. GENE SILENCING. Epigenetic silencing by the HUSH complex mediates position-effect variegation in human cells. Science 348, 1481–1485 (2015). - PMC - PubMed

Publication types

MeSH terms