. 2021 Apr 19:12:597595.
doi: 10.3389/fimmu.2021.597595. eCollection 2021.

Lung Marginated and Splenic Murine Resident Neutrophils Constitute Pioneers in Tissue-Defense During Systemic E. coli Challenge

Affiliations

Lung Marginated and Splenic Murine Resident Neutrophils Constitute Pioneers in Tissue-Defense During Systemic E. coli Challenge

Goda Juzenaite et al. Front Immunol. .

Abstract

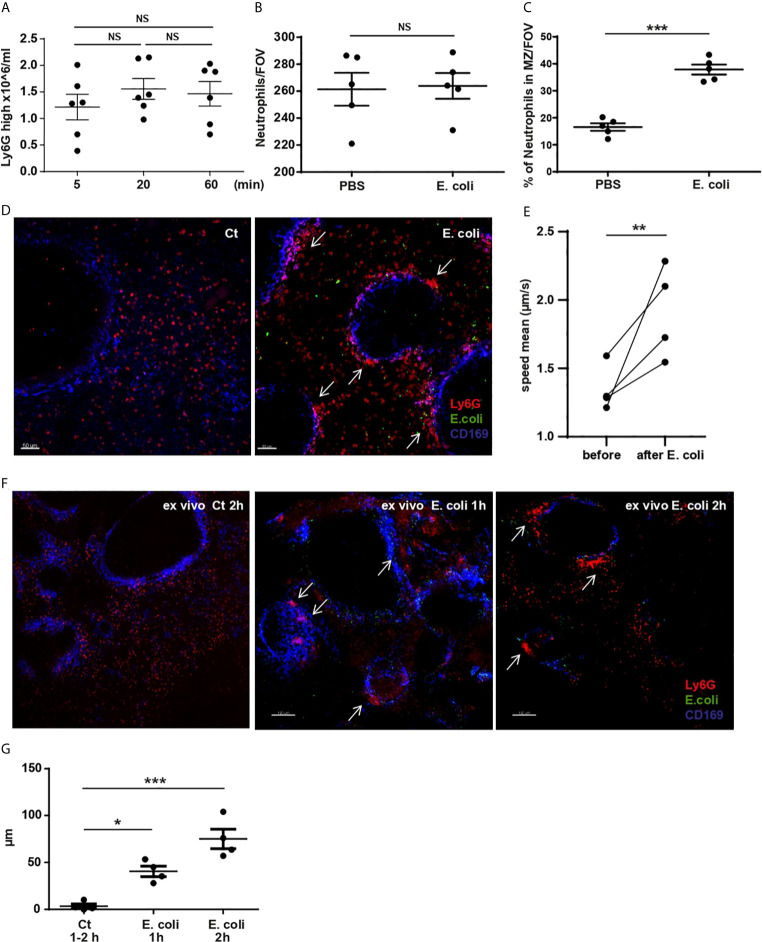
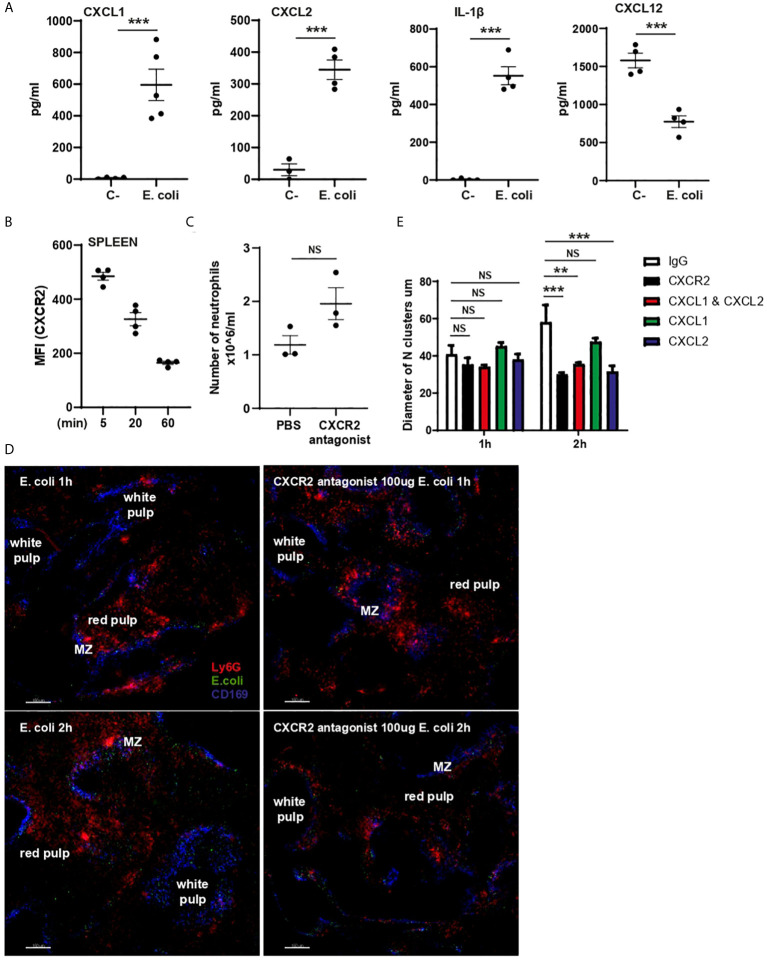
The rapid response of neutrophils throughout the body to a systemic challenge is a critical first step in resolution of bacterial infection such as Escherichia coli (E. coli). Here we delineated the dynamics of this response, revealing novel insights into the molecular mechanisms using lung and spleen intravital microscopy and 3D ex vivo culture of living precision cut splenic slices in combination with fluorescent labelling of endogenous leukocytes. Within seconds after challenge, intravascular marginated neutrophils and lung endothelial cells (ECs) work cooperatively to capture pathogens. Neutrophils retained on lung ECs slow their velocity and aggregate in clusters that enlarge as circulating neutrophils carrying E. coli stop within the microvasculature. The absolute number of splenic neutrophils does not change following challenge; however, neutrophils increase their velocity, migrate to the marginal zone (MZ) and form clusters. Irrespective of their location all neutrophils capturing heat-inactivated E. coli take on an activated phenotype showing increasing surface CD11b. At a molecular level we show that neutralization of ICAM-1 results in splenic neutrophil redistribution to the MZ under homeostasis. Following challenge, splenic levels of CXCL12 and ICAM-1 are reduced allowing neutrophils to migrate to the MZ in a CD29-integrin dependent manner, where the enlargement of splenic neutrophil clusters is CXCR2-CXCL2 dependent. We show directly molecular mechanisms that allow tissue resident neutrophils to provide the first lines of antimicrobial defense by capturing circulating E. coli and forming clusters both in the microvessels of the lung and in the parenchyma of the spleen.

Keywords: E. coli challenge; intravascular neutrophils; intravital microscopy; neutrophil activation; splenic resident neutrophils.


Conflict of interest statement

The authors declare that the research was conducted in the absence of any commercial or financial relationships that could be construed as a potential conflict of interest.

Figures

Figure 1
Figure 1
Lung marginated and circulating neutrophils activation and contribution to E. coli capture. (A) Total number of neutrophils by flow cytometry 5, 20 and 60 min after i.v. injection of E. coli (N=5-6 mice/timepoint), one-way ANOVA, Tukey’s multiple comparison test, three independent experiments. (B) FACS analysis of circulating neutrophils 5, 20 and 60 min after i.v. injection of E. coli, representative of two independent experiments. (C) % of Ly6Ghigh CD11b+ and Ly6Ghigh CD11bhigh neutrophils was calculated 5, 20 and 60 min post i.v. injection of heat-inactivated E. coli, (N=4 mice/timepoint). (D) Flow cytometry analysis of E. coli-positive circulating cells 5, 20 and 60 min after i.v. injection of E. coli, representative of two independent experiments. (E) E. coli-positive Ly6Ghigh CD11b+ and Ly6Ghigh CD11bhigh neutrophils as % of CD45+ cells was calculated 5, 20 and 60 min post i.v. injection of heat-inactivated E. coli, (N=4 mice/timepoint). (F) Sequential frames from video 1, white asterisk shows neutrophil (red) migration toward heat-inactivated E. coli captured by ECs (cyan); blue asterisk shows a neutrophil that captured heat-killed E. coli (yellow) directly from the circulation. Timing represents time from start of imaging. Scale bar 20μm. (G) Quantification of EC and neutrophil (Ns) contribution in capturing E. coli from the circulation (N=3 mice). (H) Sequential frames from video 2, showing ECs inability to retain E. coli particles. Timing represents time from start of imaging. Scale bar 20μm. (I) Proportion of E. coli particles bound to ECs over number of frames in the presence or depletion of neutrophils (N=3 mice/group), one-way ANOVA, Sidak’s multiple comparison test, three independent experiments. P < 0.01 **.
Figure 2
Figure 2
Lung marginated neutrophils are CD11b-positive and form clusters enriched in E. coli. (A) PCLS after E. coli challenge 5, 20 and 60 min. Scale bar 20μm. (B) Total number of neutrophils/FOV counted in PCLS after PBS (Ct) for 60 min or E. coli challenge for 5, 20 and 60 min (N=4-5 mice/timepoint), (10 FOV/mouse), one-way ANOVA, Tukey’s multiple comparison test, two independent experiments. (C) L-IVM analyzed for neutrophil speed mean comparing before and 60 min after E. coli challenge (N=3 mice), paired t-test. (D) Sequential frames from video 3, E. coli-positive neutrophils (yellow Ns) are stationary, while E. coli-negative neutrophils (red Ns) are highly motile (white and magenta asterisks). Scale bar 20μm. P < 0.05 *, P < 0.01 **, P < 0.001 ***, NS, not significant. (E) L-IVM analyzed for neutrophil speed mean comparing E. coli-positive neutrophils (yellow) and E. coli-negative neutrophils (red) 60 min after E. coli challenge (N=3 mice), t-test.
Figure 3
Figure 3
Splenic resident neutrophil activation and redistributing within the spleen after systemic E. coli challenge. (A) Total number of splenic neutrophils 5, 20 and 60 min after i.v. injection of E. coli, evaluated by flow cytometry, one-way ANOVA, Tukey’s multiple comparison test, three independent experiments, (N=6 mice/timepoint). (B) Total number of neutrophils/FOV counted in PCSS after PBS or challenge with E. coli for 60 min, unpaired t-test (N=4 mice/group), (10 FOV/mouse). (C) % of splenic neutrophils located in the MZ/FOV counted in PCSS after PBS or E. coli challenge for 60 min, unpaired t-test, (N=4 mice/group), (10 FOV/mouse). (D) PCSS image after PBS or challenged with E. coli for 60 min. Scale bar 50μm. Arrows point to neutrophil clusters in the MZ. (E) S-IVM analyzed for neutrophil mean speed comparing before and 60 min after E. coli challenge, paired t-test, (N=4 mice). (F) 3D ex-vivo culture system of living PCSS for 1h and 2h, pre-challenged with systemic E. coli for 5min or PBS (Ct). Scale bar 150μm. P < 0.05 *, P < 0.01 **, P < 0.001 ***, NS=not significant. Arrows point to neutrophil clusters in the MZ. (G) Diameter of neutrophil clusters in 3D ex vivo culture system of living PCSS cultured for 1h or 2h, pre-challenged with systemic E. coli for 5 min or PBS, one-way ANOVA, Tukey’s multiple comparison test, four independent experiments, (N=4 mice/timepoint).
Figure 4
Figure 4
Splenic neutrophils activation and Ly6Gint and Ly6Ghigh contribution to systemic E. coli recognition. (A) Flow cytometry analysis of splenic neutrophils 5, 20 and 60 min after i.v. injection of E. coli, representative of two independent experiments. (B) % of Ly6Ghigh CD11b+ and Ly6Ghigh CD11bhigh neutrophils was calculated 5, 20 and 60 min post i.v. injection of heat-inactivated E. coli, (N=4 mice/timepoint). (C) Flow cytometry analysis of E. coli-positive splenic cells 5, 20 and 60 min after i.v. injection of E. coli, representative of two independent experiments. (D) E. coli-positive neutrophils as % of CD45+ cells were calculated 5, 20 and 60 min post i.v. injection of heat-killed E. coli, (N=4 mice/timepoint). (E) % of Ly6Gint and Ly6Ghigh of total E. coli-positive splenic neutrophils at 5, 20 and 60 min post challenge, (N=4 mice/timepoint). (F) % of Ly6Gint and Ly6Ghigh of total E. coli-positive circulating neutrophils at 5, 20 and 60 min post challenge, (N=4 mice/timepoint). (G) Median fluorescent intensity (MFI) (anti-CD11b fluorophore) on splenic Ly6Gint, Ly6Ghigh CD11b+ and Ly6Ghigh CD11bhigh, one-way ANOVA, Tukey’s multiple comparison test, two independent experiments, (N=4 mice/group). (H) Median fluorescent intensity (MFI) (anti-CD11b fluorophore) expression on circulating Ly6Gint, Ly6Ghigh CD11b+ and Ly6Ghigh CD11bhigh, one-way ANOVA, Tukey’s multiple comparison test, two independent experiments, (N=4 mice/group). P < 0.01 **, P < 0.001 ***, P < 0.0001 ****, NS, non significant.
Figure 5
Figure 5
MZ macrophages and splenic neutrophil functions during E. Coli challenge. (A) PCSS image of liposome-control (Ct) and liposome-clodronate (Clo) pre-treated mice challenged for 60 min with systemic E. coli. Scale bar 50μm. Arrows point to some neutrophils that co-localize with E. coli. (B) Total number of neutrophils/FOV counted in PCSS of liposome-control and liposome-clodronate pre-treated mice challenged for 60 min with systemic E. coli, unpaired t-test (N=3 mice/treatment), (10 FOV/mouse). (C) Flow cytometry analysis of splenic neutrophils 5 min after i.v. injection of E. coli, representative of two independent experiments. (D) % of Ly6Ghigh CD11bhigh neutrophils of liposome-control (Ct) and liposome-clodronate (Clo) pre-treated mice challenged for 5, 20, and 60 min with systemic E. coli, (N=4 mice/timepoint). (E) Flow cytometry analysis of E. coli-positive splenic cells 5 min after i.v. injection of E. coli, representative of two independent experiments. (F) E. coli-positive Ly6Ghigh CD11bhigh neutrophils as % of CD45+ cells were calculated 5, 20 and 60 min post i.v. injection of heat-inactivated E. coli, (N=4 mice/timepoint). (G) PCSS image of 2A3 mAb and 1A8 mAb pre-treated mice challenged for 60 min with systemic E. coli. Scale bar 50μm. (H) Total number of neutrophils/FOV counted in PCSS of 100 µg of 2A3 mAb and 100 µg of 1A8 mAb pre-treated mice challenged for 60 min with systemic PBS or E. coli. (N=4 mice/group), (10 FOV/mouse). P < 0.0001 ****, NS, non significant.
Figure 6
Figure 6
CXCL1, CXCL2, IL-1β and CXCL12 expression in splenic supernatant and CXCR2 role in cluster enlargement. (A) CXCL1, CXCL2, IL-1β and CXCL12 ELISAs of splenic supernatant of PBS (C-) or E. coli treated mice (N=4-5). (B) MFI (anti-CXCR2 fluorophore) expression on splenic neutrophils 5, 20 and 60 min after i.v. injection of E. coli, (N=4 mice/treatment). (C) Total number of splenic neutrophils of mice treated for 60 min with PBS or CXCR2 antagonist, unpaired t-test (N=3 mice/treatment). (D) 3D ex-vivo culture system of living PCSS over time pre-treated with PBS or CXCR2 antagonist and challenged with systemic E. coli for 5min. Scale bar 150µm. (E) Quantification of the diameter of neutrophil clusters in 3D ex-vivo culture of living PCSS over time pre-treated with IgG, CXCR2 antagonist, CXCL1 mAb, CXCL2mAb, and CXCL1 and CXCL2 mAb over time, one-way ANOVA, Tukey’s multiple comparison test, two independent experiments, (N=3 time/treatment). P < 0.01 **, P < 0.001 ***, NS, non significant.
Figure 7
Figure 7
CD11b-, CD29-integrin and ICAM-1 role in splenic neutrophil retention, relocation, and clustering. (A) PCSS image of IgG and anti-CD29 mAb pre-treated mice challenged for 60 min with systemic E. coli. Scale bar 50μm. Arrows point to some neutrophils that co-localize with E. coli after anti-CD29 mAb treatment (B) % of splenic neutrophils in the MZ/FOV counted in PCSS of IgG and anti-CD29 mAb pre-treated mice challenged for 60 min with systemic E. coli, unpaired t-test, (N=3 mice/group). (C) Flow cytometry analysis of E coli-positive splenic neutrophils pre-treatment with CD29 mAb. (D) Quantification of splenic neutrophils 60 min after i.v. injection of E. coli pre-treated with anti-CD29 mAb, two independent experiments (N=3 mice/treatment). (E) PCSS image of IgG or anti-ICAM-1 mAb treated mice. Scale bar 50μm. (F) % of splenic neutrophils located in the MZ/FOV counted in PCSS after IgG or ICAM-1 mAb for 60 min, unpaired t-test, (N=3 mice/group). (G) Quantification of splenic neutrophils from mice treated for 60 min with i.v. IgG or ICAM-1 mAb, two independent experiments (N=5 mice/treatment). (H) MFI of anti-CD11b and anti-CD62L mAb of splenic neutrophils after anti-ICAM-1 mAb or IgG treatment expressed as fold change. (I) % of ICAM-1 expressed by CD45- splenocytes 60 min after i.v. injection of PBS or E. coli, representative of three experiments, unpaired t-test, (N=4 mice/treatment). P < 0.01 **, NS, non significant.

References

    1. Casanova-Acebes M, Nicolas-Avila JA, Li JL, Garcia-Silva S, Balachander A, Rubio-Ponce A, et al. . Neutrophils instruct homeostatic and pathological states in naive tissues. J Exp Med (2018) 215(11):2778–95. 10.1084/jem.20181468 - DOI - PMC - PubMed
    1. Kubes P. The enigmatic neutrophil: what we do not know. Cell Tissue Res (2018) 371(3):399–406. 10.1007/s00441-018-2790-5 - DOI - PubMed
    1. Looney MR, Thornton EE, Sen D, Lamm WJ, Glenny RW, Krummel MF. Stabilized imaging of immune surveillance in the mouse lung. Nat Methods (2011) 8(1):91–6. 10.1038/nmeth.1543 - DOI - PMC - PubMed
    1. Yipp BG, Kim JH, Lima R, Zbytnuik LD, Petri B, Swanlund N, et al. . The Lung is a Host Defense Niche for Immediate Neutrophil-Mediated Vascular Protection. Sci Immunol (2017) 2(10). 10.1126/sciimmunol.aam8929 - DOI - PMC - PubMed
    1. Deniset JF, Surewaard BG, Lee WY, Kubes P. Splenic Ly6G(high) mature and Ly6G(int) immature neutrophils contribute to eradication of S. pneumoniae. J Exp Med (2017) 214(5):1333–50. 10.1084/jem.20161621 - DOI - PMC - PubMed

Publication types