. 2021 May;15(5):361-366.
doi: 10.1038/s41566-021-00774-2. Epub 2021 Mar 15.

MINSTED fluorescence localization and nanoscopy

Affiliations

MINSTED fluorescence localization and nanoscopy

Michael Weber et al. Nat Photonics. 2021 May.

Abstract

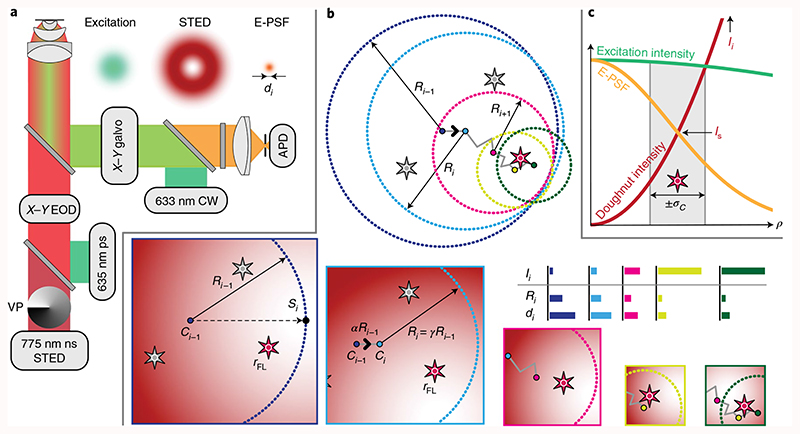
We introduce MINSTED, a fluorophore localization and super-resolution microscopy concept based on stimulated emission depletion (STED) that provides spatial precision and resolution down to the molecular scale. In MINSTED, the intensity minimum of the STED doughnut, and hence the point of minimal STED, serves as a movable reference coordinate for fluorophore localization. As the STED rate, the background and the required number of fluorescence detections are low compared with most other STED microscopy and localization methods, MINSTED entails substantially less fluorophore bleaching. In our implementation, 200-1,000 detections per fluorophore provide a localization precision of 1-3nm in standard deviation, which in conjunction with independent single fluorophore switching translates to a -100-fold improvement in far-field microscopy resolution over the diffraction limit. The performance of MINSTED nanoscopy is demonstrated by imaging the distribution of Mic60 proteins in the mitochondrial inner membrane of human cells.


Conflict of interest statement

Competing interests S.W.H. benefits from intellectual property on the described localization and nanoscopy owned by the Max Planck Society.

Figures

Fig. 1
Fig. 1. Principles of MINSTED localization.
a, STED setup with co-aligned pulsed lasers for excitation and STED at 635 and 775 nm, respectively, and a vortex phase plate (VP) for helical phase modulation converting the STED beam into a doughnut; the inserts sketch the excitation and STED probability in the lens focal plane, along with that of the fluorescence (E-PSF). The 633 nm CW laser was used for fluorophore pre-identification in the focal plane, while the X-Y galvo unit also maintained the optical conjugation of the confocal avalanche photodiode (APD) detector to the centre of the circular scan performed by the electro-optical lateral deflector (X-Y EOD). b, The active fluorophore (red among grey stars), located at unknown position r FL, was localized by circular X-Y scans. For each photon detection i, the centre Ci was shifted by a fraction α of the radius Ri toward the doughnut minimum Si. Simultaneously, Ri and the FWHM di of the E-PSF were scaled by γ<1. The centre Ci thus converges to the fluorophore position (grey line) as indicated in the lower panels that also sketch relevant parts of the doughnut for some detections during the homing-in process. Once a minimum radius R min (yellow) is reached, only Ci is updated and the localization terminated after the fluorophore becomes inactive (N detections). The column diagrams illustrate the decrease of Ri and of di with increasing doughnut intensity Ii. c, Normalized probability of excitation (green) and fluorescence detection (E-PSF, yellow) as a function of radial distance ρ from the focal point, along with a non-normalized intensity profile of the STED beam doughnut (red). Although Ii, is constantly increased during the localization to sharpen the E-PSF, the intensity experienced by the fluorophore remains about I s within the ±σC position range of the centre positions Ci highlighted in grey.
Fig. 2
Fig. 2. Simulation of MINSTED localization with N = 100 detected photons.
a, Localization precision σ with different ratios of scan radius R to FWHM d of the STED microscope’s Gaussian E-PSF with the SBR as the parameter. While the hypothetical infinite SBR case calls for R maximization (black line), the presence of the background enforces O.5dRd. For large R the information provided by the detection of a single photon is masked by the background, whereas for a small R it is masked by the many other photon detections connected with an E-PSF maximum of finite d. In the localization process, the values of R and d are updated for every photon count i to the specific values Ri and di, respectively. b, Detections N c necessary until the distribution of scan centre positions Ci converges to a final distribution (with static d); percentage of simulations with centre positions Ci further than d away from the fluorophore and hence classified as lost. c, Localization precision σ as a function of total number of detections N with d min as the parameter.
Fig. 3
Fig. 3. MINSTED localization of single fluorophores.
a, Localization trace from the first i = 1 (blue) to the last detection i = 300 (yellow) with the final scan circle (dashed line) around the estimated (x,y) position. b, Scan radius Ri (dashed line), distance (Δxy) from the final estimated position to the scan centre Ci (points) from i = 1 (blue) to i = 300 (yellow) detections. c, Histogram of precision σ of grouped localization traces and their median σ showing good agreement with simulation. d, Measured precision σM (derived from segments of M detections measured after d min had been reached) showing how the increase in STED doughnut power improves the precision in linear proportion to d min, which is also confirmed by the overlap of data points when all points are scaled to d min = 200 nm for comparison. Solid lines show simulation results for SBR = ∞, the dashed line for SBR = 20 as indicated. Note the logarithmic display in c and d.
Fig. 4
Fig. 4. MINSTED nanoscopy of mitochondrial protein Mic60.
a,b Confocal (a) and STED (b) images with d ≈ 60nm of the same mitochondrion taken after simultaneous activation of all fluorophores. c, MINSTED nanoscopy image of similar mitochondria resolving the Mic60 clusters (3,607 localizations acquired in 33min, 1,766 localizations with NNc 200 detections and d min = 54nm). d, Excerpts of data as indicated in c. e, Schematic of the presumed localization of Mic60 in the mitochondrial inner membrane. IM, inner membrane; OM, outer membrane; CM, crista membrane; CJ, crista junction. Scale bars: a-c, 200 nm; d, 100 nm.

References

    1. Hell SW, Wichmann J. Breaking the diffraction resolution limit by stimulated emission: stimulated-emission-depletion fluorescence microscopy. Opt Lett. 1994;19:780–782. - PubMed
    1. Klar TA, Jakobs S, Dyba M, Egner A, Hell SW. Fluorescence microscopy with diffraction resolution barrier broken by stimulated emission. Proc Natl Acad Sci USA. 2000;97:8206–8210. - PMC - PubMed
    1. Westphal V, Hell SW. Nanoscale resolution in the focal plane of an optical microscope. Phys Rev Lett. 2005;94:143903. - PubMed
    1. Hell SW. Far-field optical nanoscopy. Science. 2007;316:1153–1158. - PubMed
    1. Danzl JG, et al. Coordinate-targeted fluorescence nanoscopy with multiple off states. Nat Photonics. 2016;10:122–128.