. 2021 May 5;10(5):giab029.
doi: 10.1093/gigascience/giab029.

The germline mutational process in rhesus macaque and its implications for phylogenetic dating

Affiliations

The germline mutational process in rhesus macaque and its implications for phylogenetic dating

Lucie A Bergeron et al. Gigascience. .

Abstract

Background: Understanding the rate and pattern of germline mutations is of fundamental importance for understanding evolutionary processes.

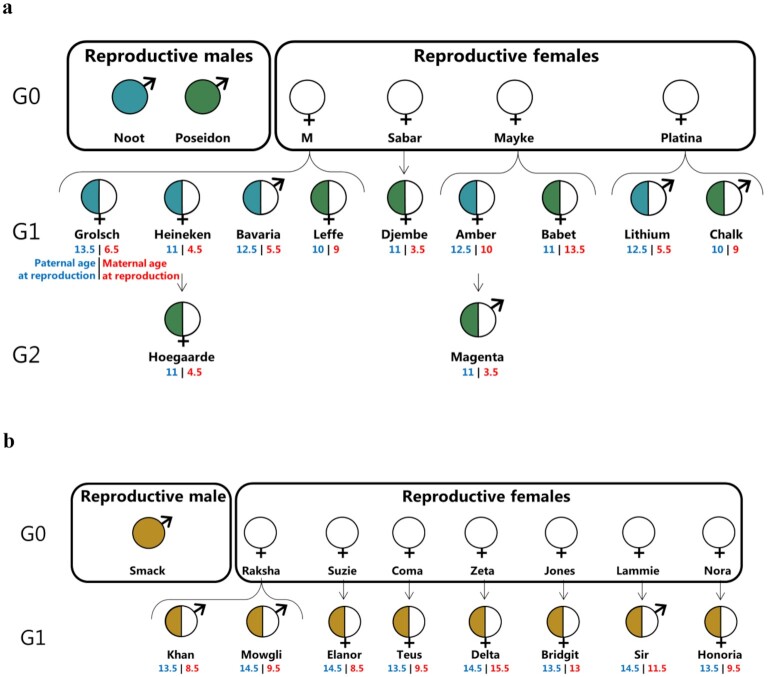
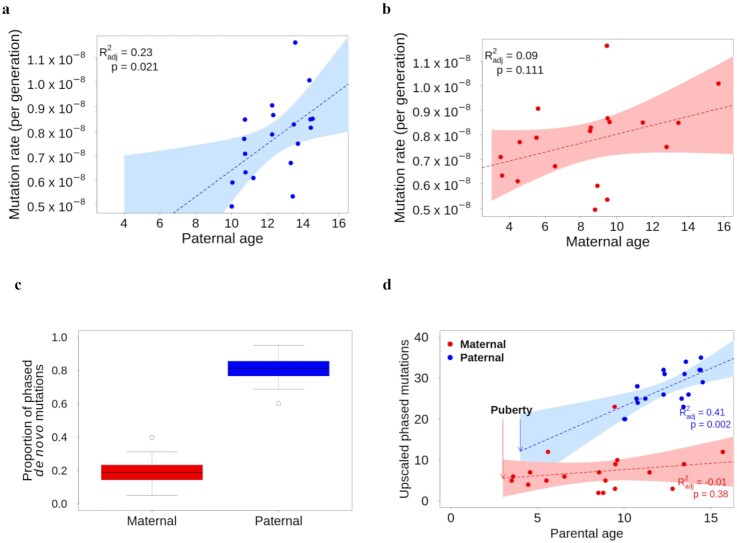
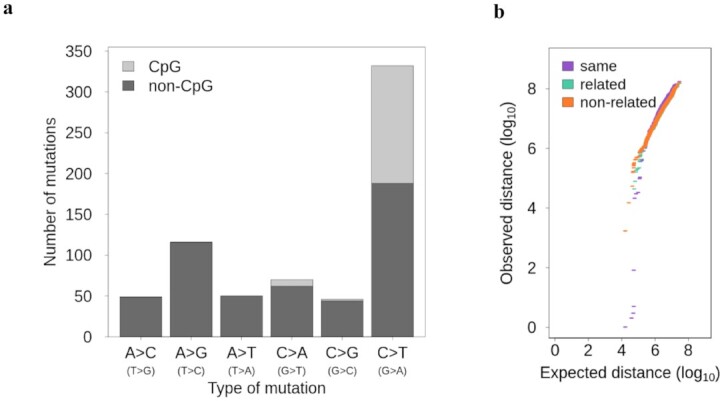
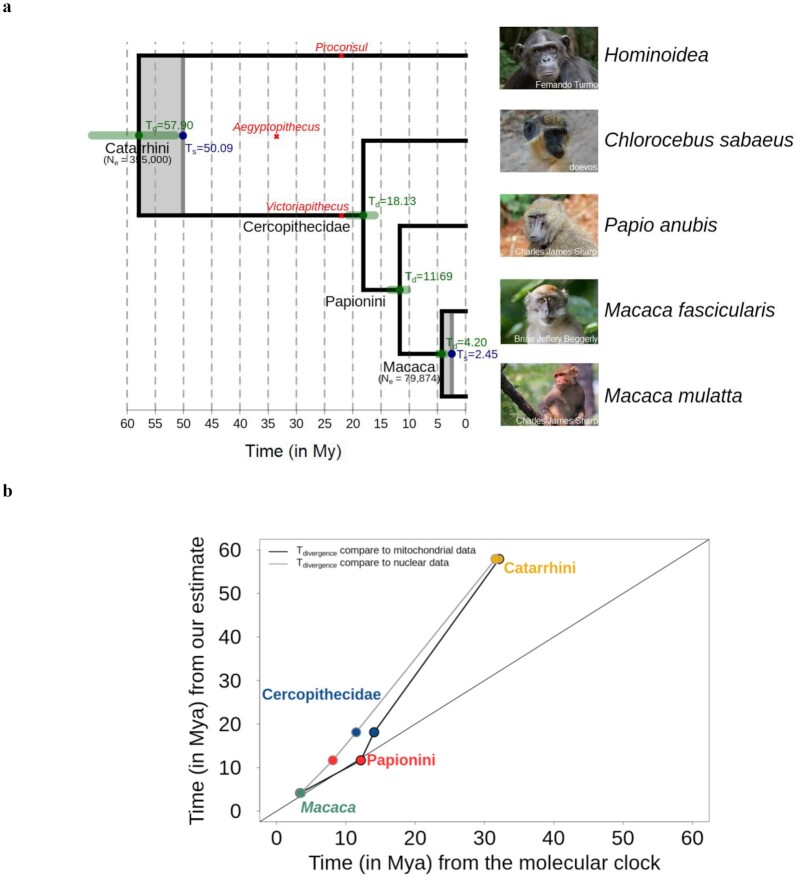
Results: Here we analyzed 19 parent-offspring trios of rhesus macaques (Macaca mulatta) at high sequencing coverage of ∼76× per individual and estimated a mean rate of 0.77 × 10⁻⁸de novo mutations per site per generation (95% CI: 0.69 × 10⁻⁸ to 0.85 × 10⁻⁸). By phasing 50% of the mutations to parental origins, we found that the mutation rate is positively correlated with the paternal age. The paternal lineage contributed a mean of 81% of the de novo mutations, with a trend of an increasing male contribution for older fathers. Approximately 3.5% of de novo mutations were shared between siblings, with no parental bias, suggesting that they arose from early development (postzygotic) stages. Finally, the divergence times between closely related primates calculated on the basis of the yearly mutation rate of rhesus macaque generally reconcile with divergence estimated with molecular clock methods, except for the Cercopithecoidea/Hominoidea molecular divergence dated at 58 Mya using our new estimate of the yearly mutation rate.

Conclusions: When compared to the traditional molecular clock methods, new estimated rates from pedigree samples can provide insights into the evolution of well-studied groups such as primates.

Keywords: Evolution; mutation rate; phylogeny; primates.


Conflict of interest statement

The authors declare that they have no competing interests.

Figures

Figure 1:
Figure 1:
Pedigree of the 19 trios used for the direct estimation of mutation rate. (a) The first group is composed of 2 reproductive males and 4 reproductive females. (b) The second group contained 1 reproductive male and 7 reproductive females. In each offspring, the color on the left corresponds to the paternal lineage and under the name are the age of the father (in blue) and mother (in red) at the time of reproduction. The reproductive ranges are 4.5 years for males and 12.2 years for females.
Figure 2:
Figure 2:
Parental contribution and age effect on the de novo mutation rate. (a) There is a positive correlation between the mutation rate and the paternal age shown by the linear regression (dotted lines) and 95% CI (shading). (b) The correlation between maternal age and mutation rate is not significant. (c) Boxplot of the maternal and paternal contribution in de novo mutations, with minimum, maximum and outlier values (error bars and dots), values within the first and third quartiles (colored block) and median (horizontal lines). (d) Upscaled number of de novo mutations given by each parent shows a similar contribution at the age of sexual maturation and a substantial increase with male age.
Figure 3:
Figure 3:
Characterizations of the de novo mutations. (a) The type of de novo mutations in CpG and non-CpG sites. (b) QQ-plot of the distance between de novo mutations compared to a uniform distribution within individuals (purple), between related individuals (green), and between non-related individuals (orange).
Figure 4:
Figure 4:
Molecular dating with pedigree-based mutation rate. (a) Primate phylogeny based on the yearly mutation rate (0.62 × 10⁹ per site per year). In green are the confidence intervals of our divergence time estimates (Td), and grey shades represent the time of speciation (Ts). The effective population sizes are indicated under the nodes (Ne Macaca ancestor is our estimate of Ne  Macaca mulatta and Ne Catarrhini from the literature [48]). (b) Comparison of our divergence time and speciation time with the previous estimation using the molecular clock from mitochondrial [43] and nuclear data [44] calibrated with fossil records.

References

    1. Acuna-Hidalgo R, Veltman JA, Hoischen A. New insights into the generation and role of de novo mutations in health and disease. Genome Biol. 2016;17(1):241. - PMC - PubMed
    1. Oliveira S, Cooper DN, Azevedo L. De novo mutations in human inherited disease. eLS. 2018, doi:10.1002/9780470015902.a0027866. - DOI
    1. Lapierre M, Lambert A, Achaz G. Accuracy of demographic inferences from the site frequency spectrum: The case of the Yoruba population. Genetics. 2017;206(1):439–49. - PMC - PubMed
    1. Zeng K, Jackson BC, Barton HJ. Methods for estimating demography and detecting between-locus differences in the effective population size and mutation rate. Mol Biol Evol. 2018, doi:10.1093/molbev/msy212. - DOI - PMC - PubMed
    1. Teeling EC, Springer MS, Madsen O, et al. A molecular phylogeny for bats illuminates biogeography and the fossil record. Science. 2005;307(5709):580–4. - PubMed

Publication types

LinkOut - more resources