

Population pharmacodynamic modeling of intramuscular and oral dexamethasone and betamethasone effects on six biomarkers with circadian complexities in Indian women
- PMID: 33954911
- PMCID: PMC8099395
- DOI: 10.1007/s10928-021-09755-y
Population pharmacodynamic modeling of intramuscular and oral dexamethasone and betamethasone effects on six biomarkers with circadian complexities in Indian women
Abstract
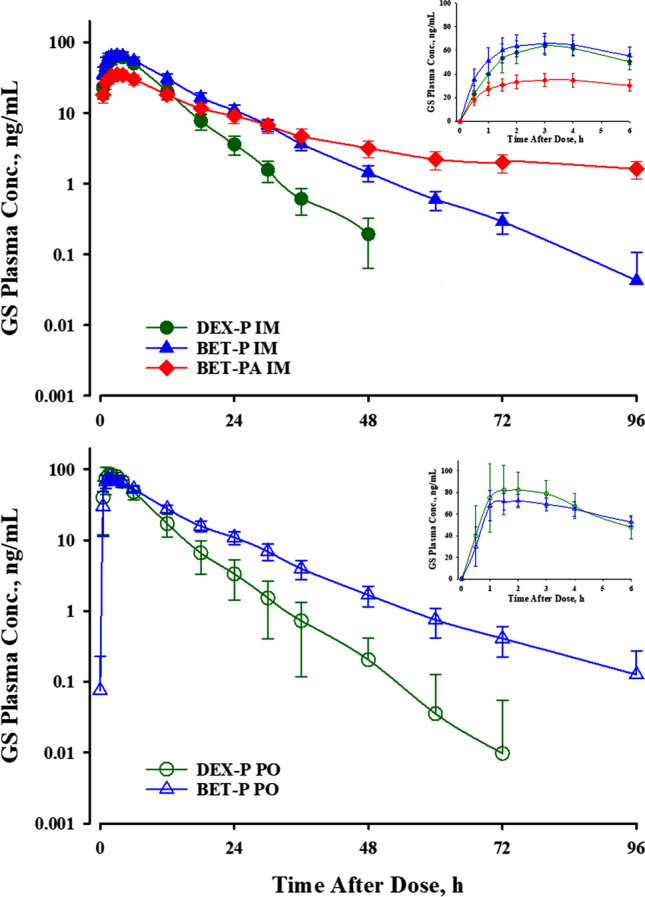
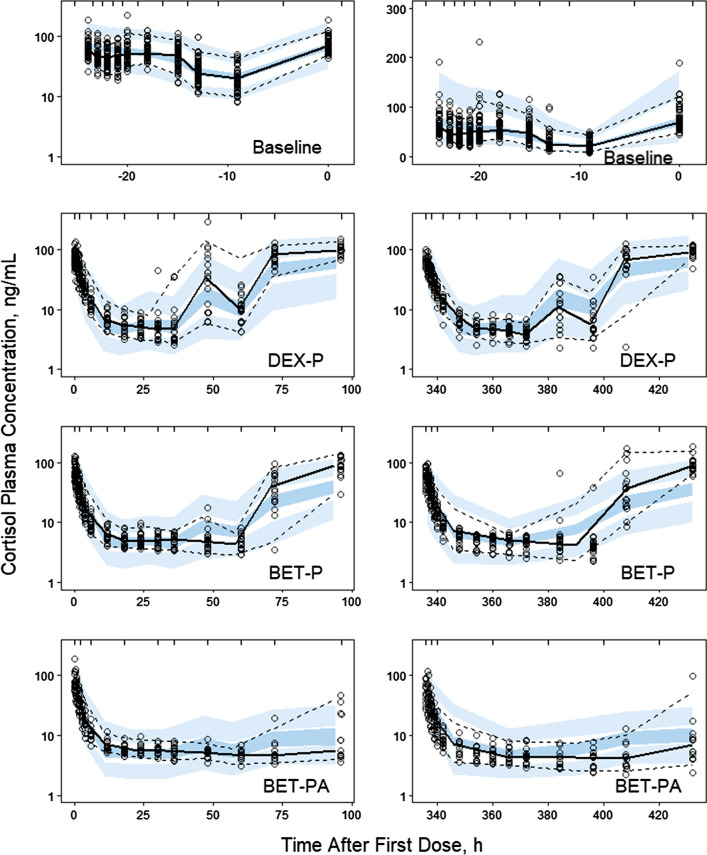
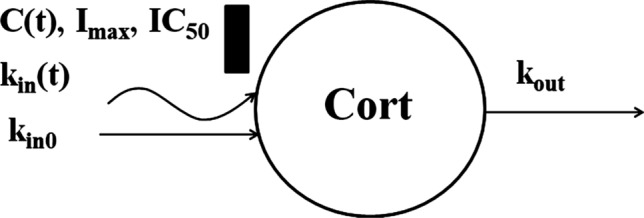
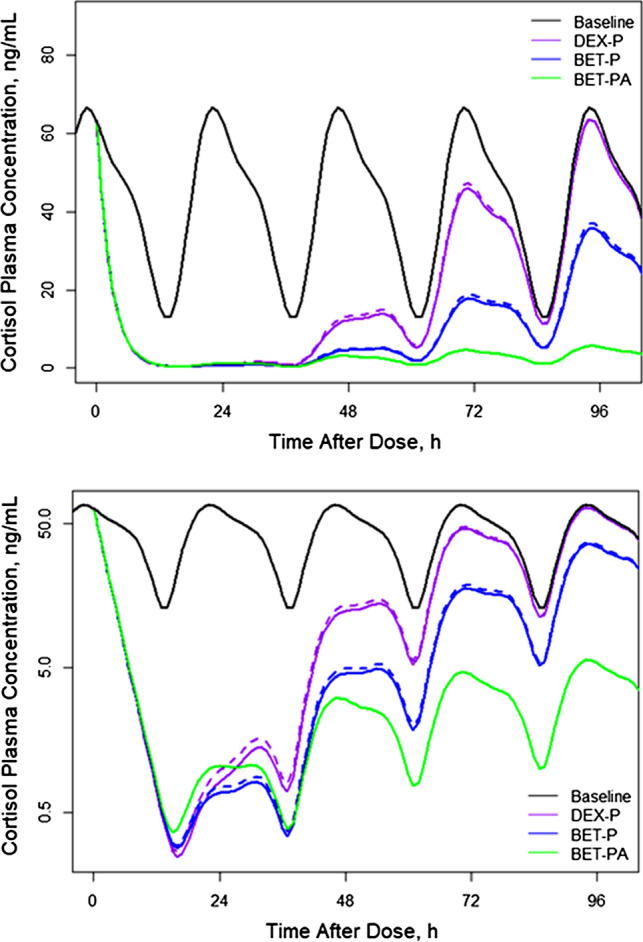
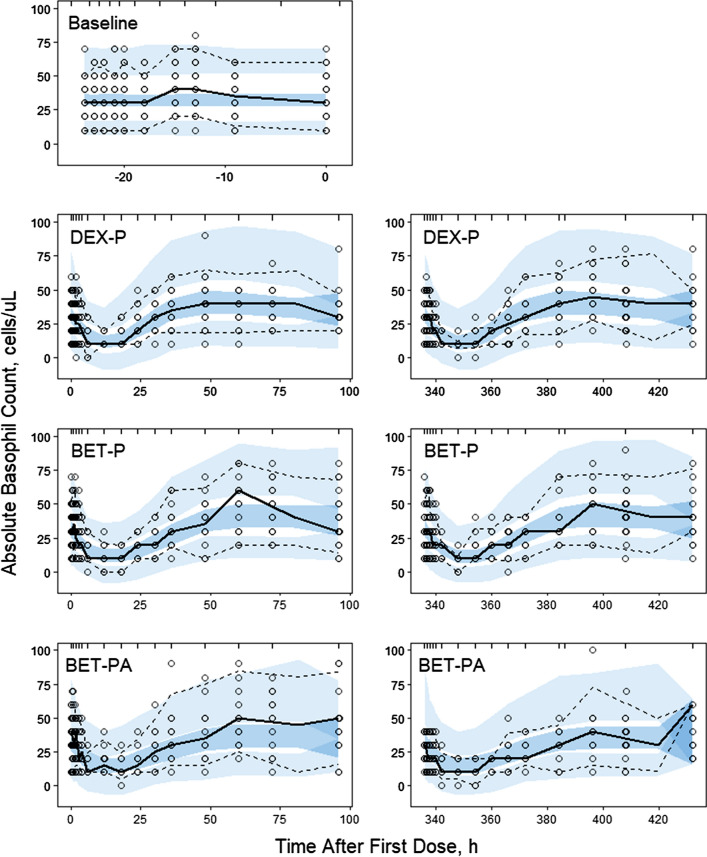
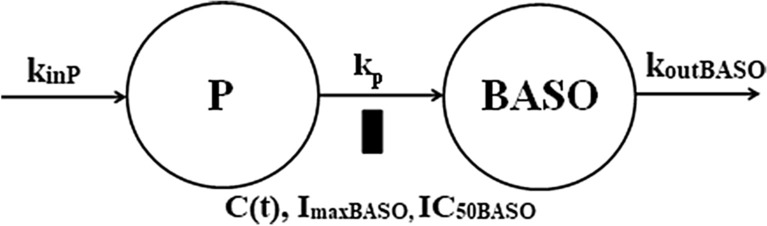
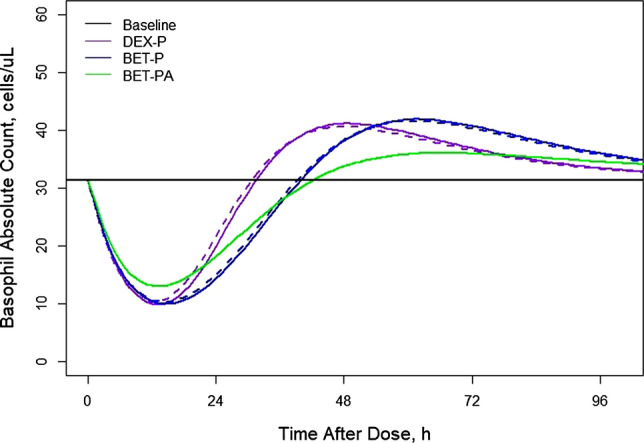
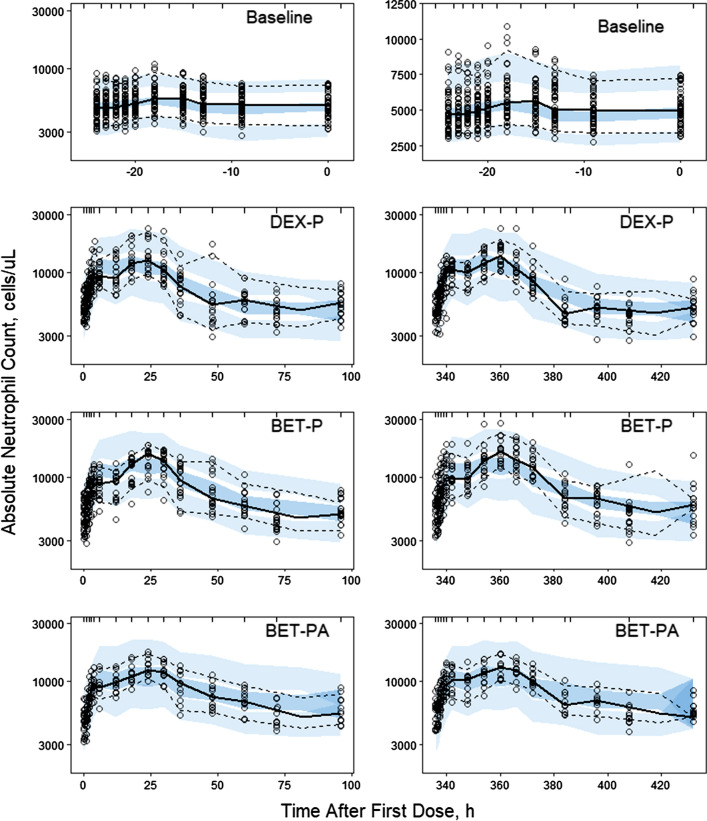
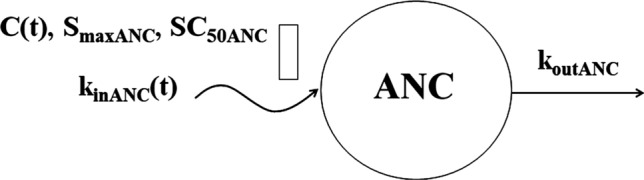
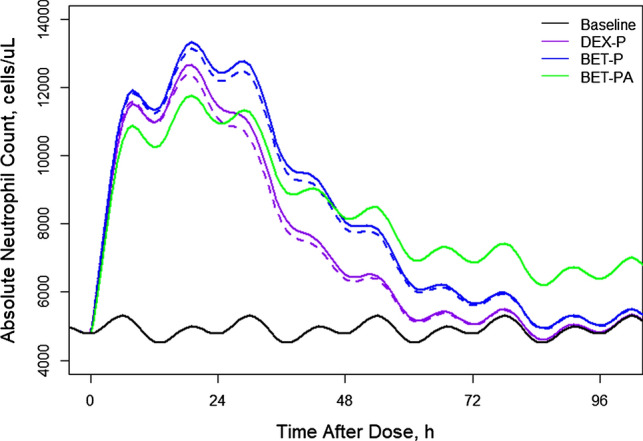
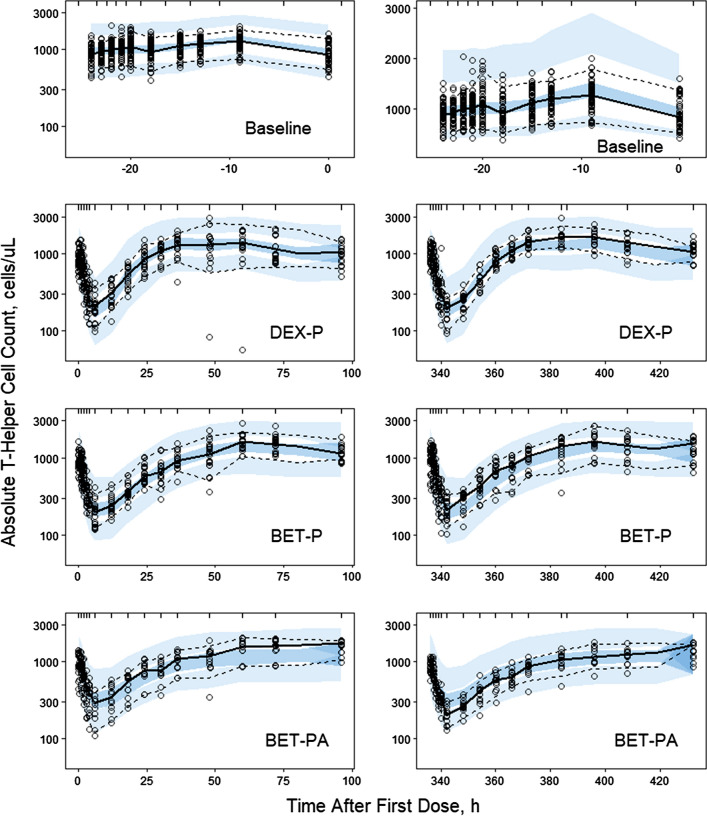
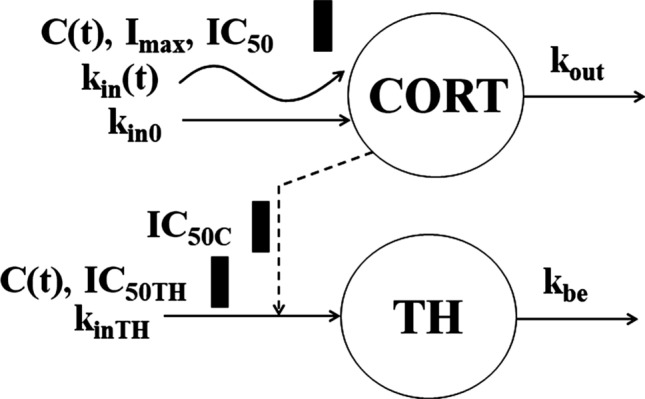
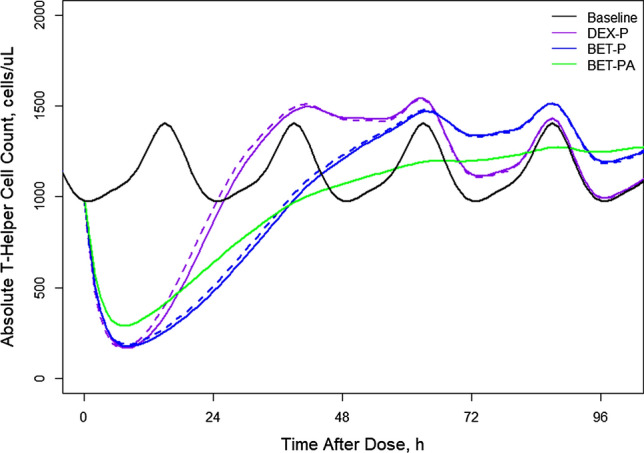
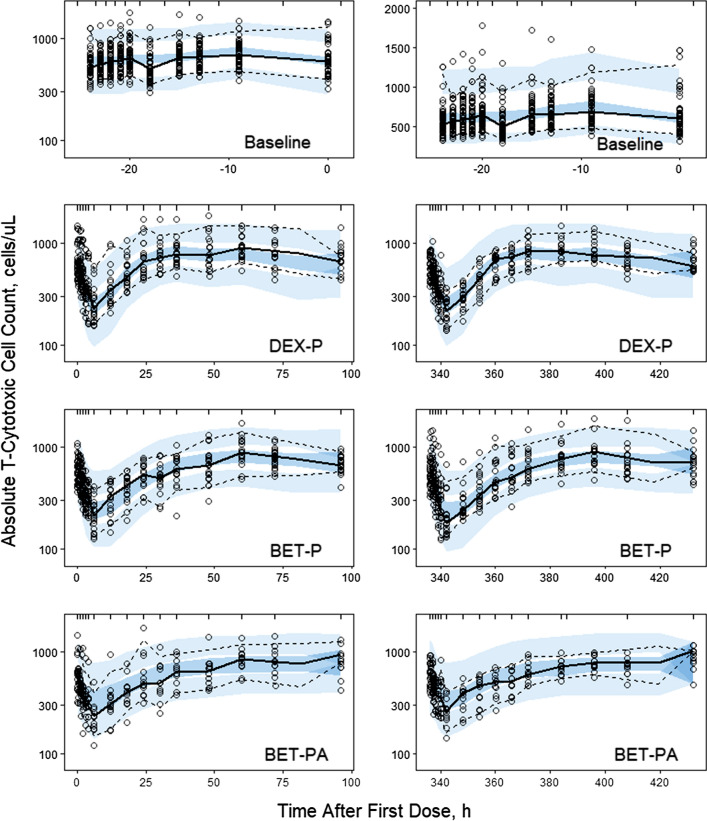
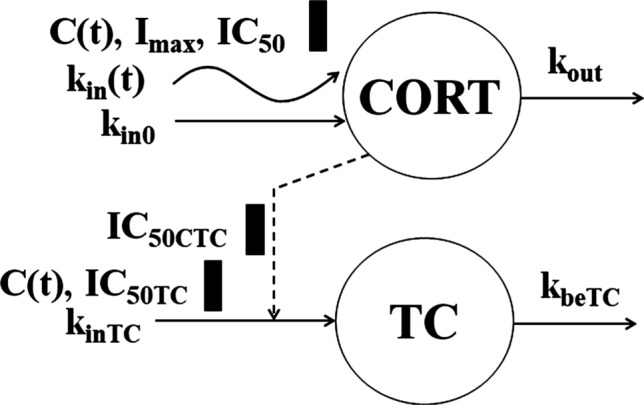
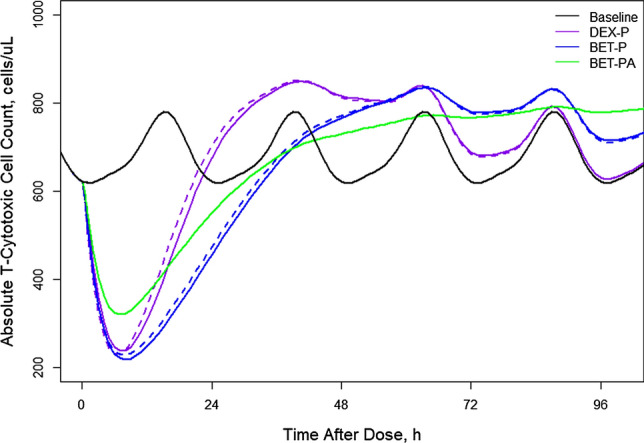
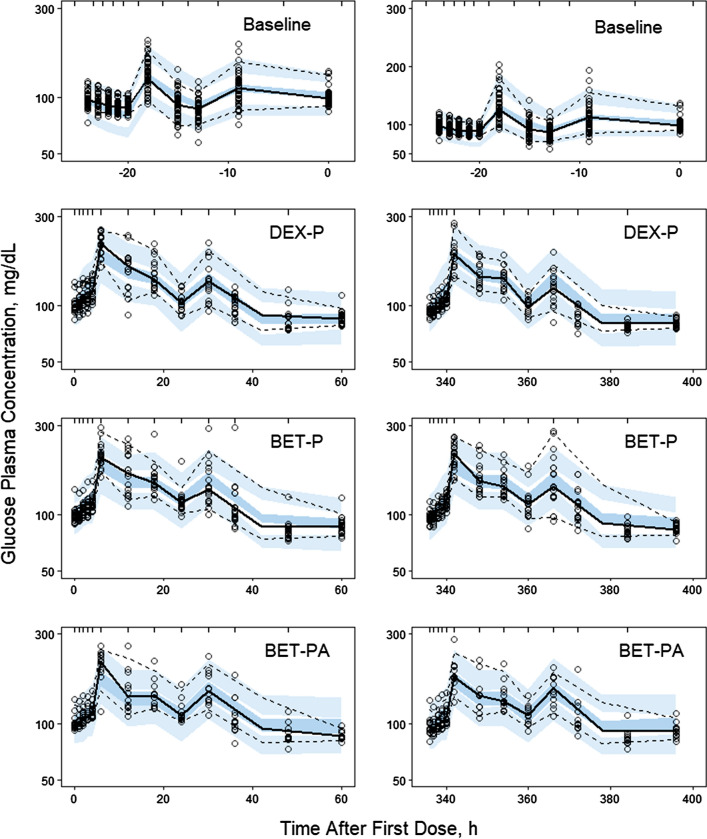
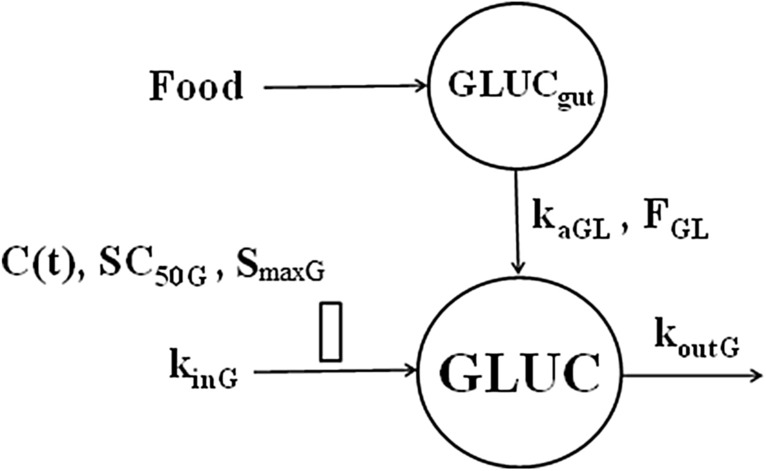
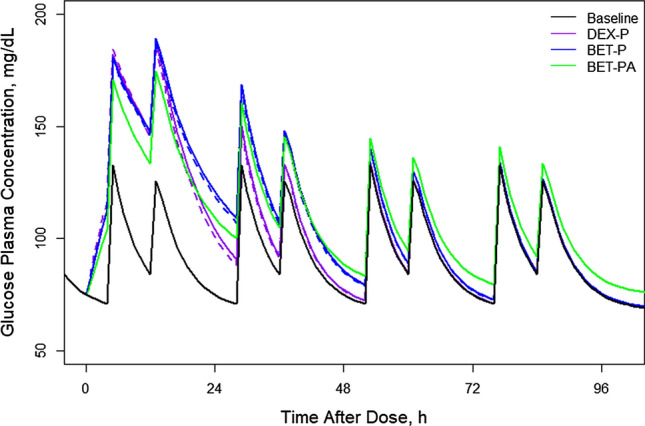
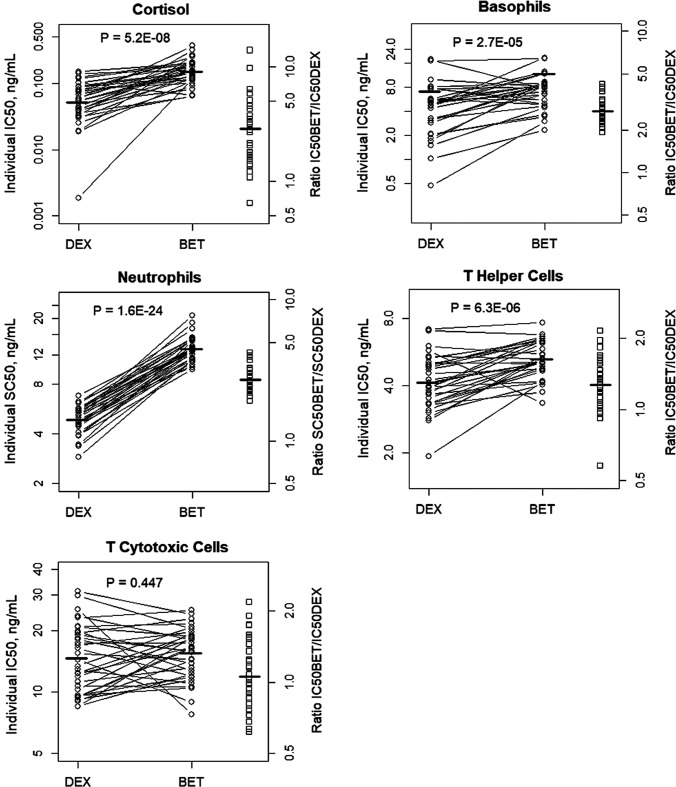
Population pharmacokinetic/pharmacodynamic (PK/PD) analysis was performed for extensive data for differing dosage forms and routes for dexamethasone (DEX) and betamethasone (BET) in 48 healthy nonpregnant Indian women in a partial and complex cross-over design. Single doses of 6 mg dexamethasone phosphate (DEX-P), betamethasone phosphate (BET-P), or 1:1 mixture of betamethasone phosphate and acetate (BET-PA) were administered orally (PO) or intramuscularly (IM) where each woman enrolled in a two-period cross-over study. Plasma concentrations collected over 96 h were described with a two-compartment model with differing PO and IM first-order absorption inputs. Overall, BET exhibited slower clearance, similar volume of distribution, faster absorption, and longer persistence than DEX with BET acetate producing extremely slow absorption but full bioavailability of BET. Six biomarkers were assessed over a 24-h baseline period with four showing circadian rhythms with complex baselines. These baselines and the strong responses seen after drug dosing were fitted with various indirect response models using the Laplace estimation methods in NONMEM 7.4. Both the PK and six biomarker responses were well-described with modest variability likely due to the homogeneous ages, weights, and ethnicities of the women. The drugs either inhibited or stimulated the influx processes with some models requiring joint inclusion of drug effects on circadian cortisol suppression. The biomarkers and order of sensitivity (lowest IC50/SC50 to highest) were: cortisol, T-helper cells, basophils, glucose, neutrophils, and T-cytotoxic cells. DEX sensitivities were generally greater than BET with corresponding mean ratios for these biomarkers of 2.86, 1.27, 1.72, 1.27, 2.69, and 1.06. Overall, the longer PK (e.g. half-life) of BET, but lesser PD activity (e.g. higher IC50), produces single-dose response profiles that appear quite similar, except for the extended effects from BET-PA. This comprehensive population modeling effort provides the first detailed comparison of the PK profiles and six biomarker responses of five commonly used dosage forms of DEX and BET in healthy women.
Keywords: Adrenal suppression; Betamethasone; Cell trafficking; Dexamethasone; Pharmacodynamics; Pharmacokinetics; Population modeling.
Conflict of interest statement
The authors received financial support from the Bill & Melinda Gates Foundation.
Figures
Similar articles
-
Population pharmacokinetic modeling of intramuscular and oral dexamethasone and betamethasone in Indian women.J Pharmacokinet Pharmacodyn. 2021 Apr;48(2):261-272. doi: 10.1007/s10928-020-09730-z. Epub 2021 Jan 3. J Pharmacokinet Pharmacodyn. 2021. PMID: 33389521 Free PMC article. Clinical Trial.
-
Pharmacokinetics and Pharmacodynamics of Intramuscular and Oral Betamethasone and Dexamethasone in Reproductive Age Women in India.Clin Transl Sci. 2020 Mar;13(2):391-399. doi: 10.1111/cts.12724. Epub 2019 Dec 13. Clin Transl Sci. 2020. PMID: 31808984 Free PMC article. Clinical Trial.
-
Oral dosing for antenatal corticosteroids in the Rhesus macaque.PLoS One. 2019 Sep 19;14(9):e0222817. doi: 10.1371/journal.pone.0222817. eCollection 2019. PLoS One. 2019. PMID: 31536601 Free PMC article.
-
Across-species meta-analysis of dexamethasone pharmacokinetics utilizing allometric and scaling modeling approaches.Biopharm Drug Dispos. 2021 May;42(5):191-203. doi: 10.1002/bdd.2266. Epub 2021 Mar 17. Biopharm Drug Dispos. 2021. PMID: 33638217 Free PMC article.
-
Pharmacodynamic model of slow reversible binding and its applications in pharmacokinetic/pharmacodynamic modeling: review and tutorial.J Pharmacokinet Pharmacodyn. 2022 Oct;49(5):493-510. doi: 10.1007/s10928-022-09822-y. Epub 2022 Aug 30. J Pharmacokinet Pharmacodyn. 2022. PMID: 36040645 Free PMC article. Review.
Cited by
-
Systematic review: differences in complete blood count component rhythms.Sleep Adv. 2024 Dec 9;5(1):zpae086. doi: 10.1093/sleepadvances/zpae086. eCollection 2024. Sleep Adv. 2024. PMID: 39735739 Free PMC article.
-
Mechanism-Based Pharmacokinetic/Pharmacodynamic Modeling of Erythroferrone in Anemic Rats with Chronic Kidney Disease and Chemotherapy-Induced Anemia: An Early Biomarker for Hemoglobin Response and rHuEPO Hyporesponsiveness.ACS Pharmacol Transl Sci. 2024 Dec 11;8(1):189-202. doi: 10.1021/acsptsci.4c00575. eCollection 2025 Jan 10. ACS Pharmacol Transl Sci. 2024. PMID: 39816799
-
Pharmacokinetic/Pharmacodynamic Modeling of Dexamethasone Anti-Inflammatory and Immunomodulatory Effects in LPS-Challenged Rats: A Model for Cytokine Release Syndrome.J Pharmacol Exp Ther. 2023 Mar;384(3):455-472. doi: 10.1124/jpet.122.001477. Epub 2023 Jan 11. J Pharmacol Exp Ther. 2023. PMID: 36631280 Free PMC article.
-
Pharmacokinetic Assessment of Drug Efflux from Erythrocytes Loaded with Corticosteroid Esters.Pharm Res. 2025 Aug 15. doi: 10.1007/s11095-025-03913-4. Online ahead of print. Pharm Res. 2025. PMID: 40813931
-
Population pharmacokinetics and pharmacodynamics of two dosing regimens of antenatal corticosteroids: protocol for a prospective nested study in a randomised controlled trial.BMJ Open. 2025 Jun 8;15(6):e096523. doi: 10.1136/bmjopen-2024-096523. BMJ Open. 2025. PMID: 40484425 Free PMC article.
References
Publication types
MeSH terms
Substances
Grants and funding
LinkOut - more resources
Full Text Sources
Other Literature Sources
