. 2021 Sep;26(5):e13049.
doi: 10.1111/adb.13049. Epub 2021 May 5.

Calcium-permeable AMPA receptor activity and GluA1 trafficking in the basolateral amygdala regulate operant alcohol self-administration

Affiliations

Calcium-permeable AMPA receptor activity and GluA1 trafficking in the basolateral amygdala regulate operant alcohol self-administration

Sara Faccidomo et al. Addict Biol. 2021 Sep.

Abstract

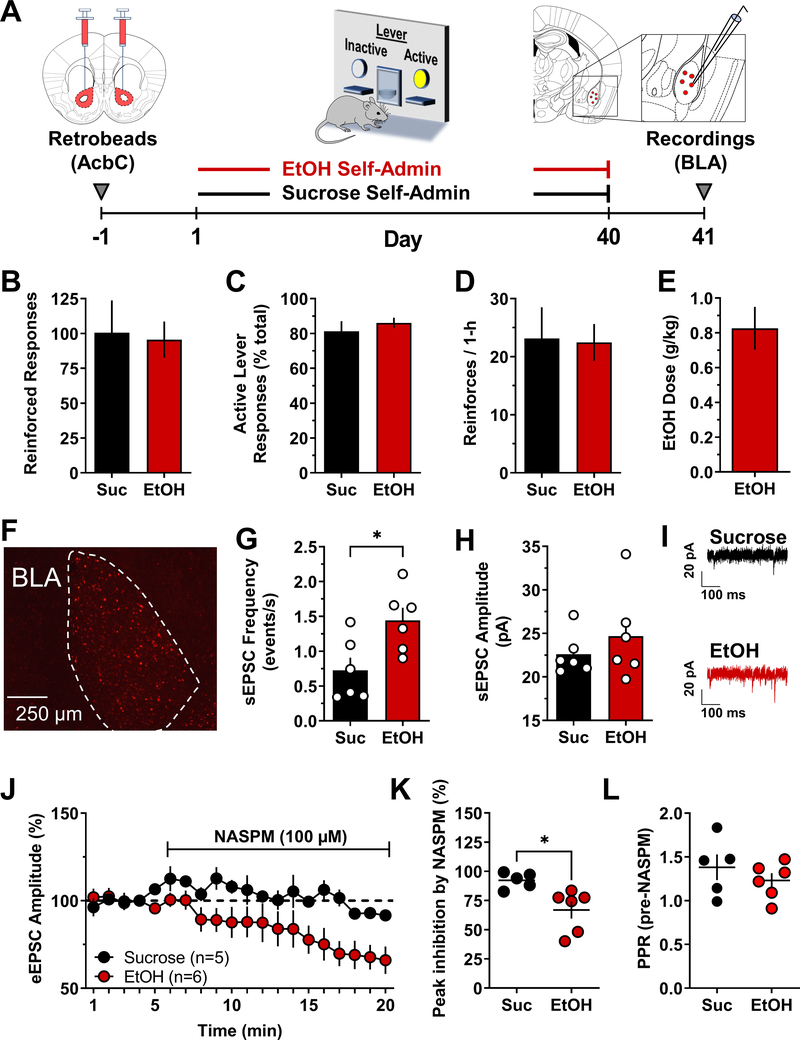
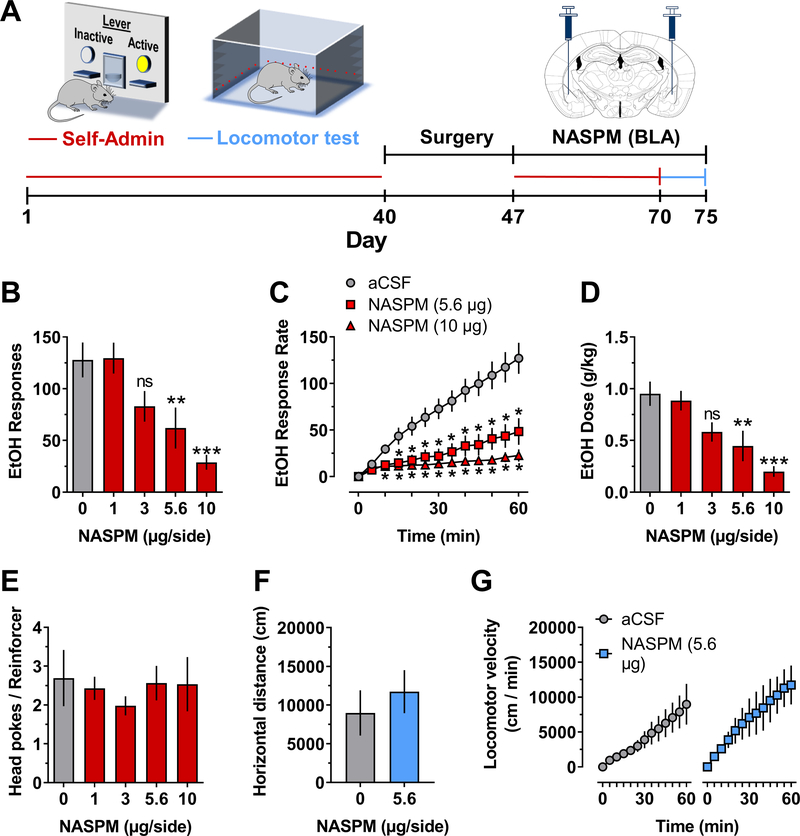
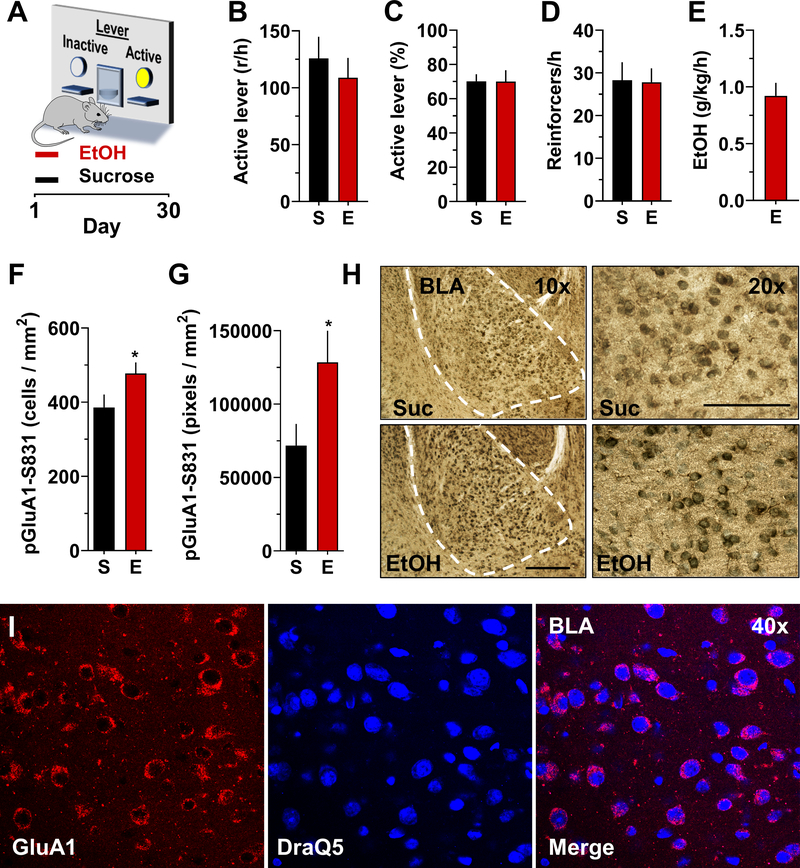
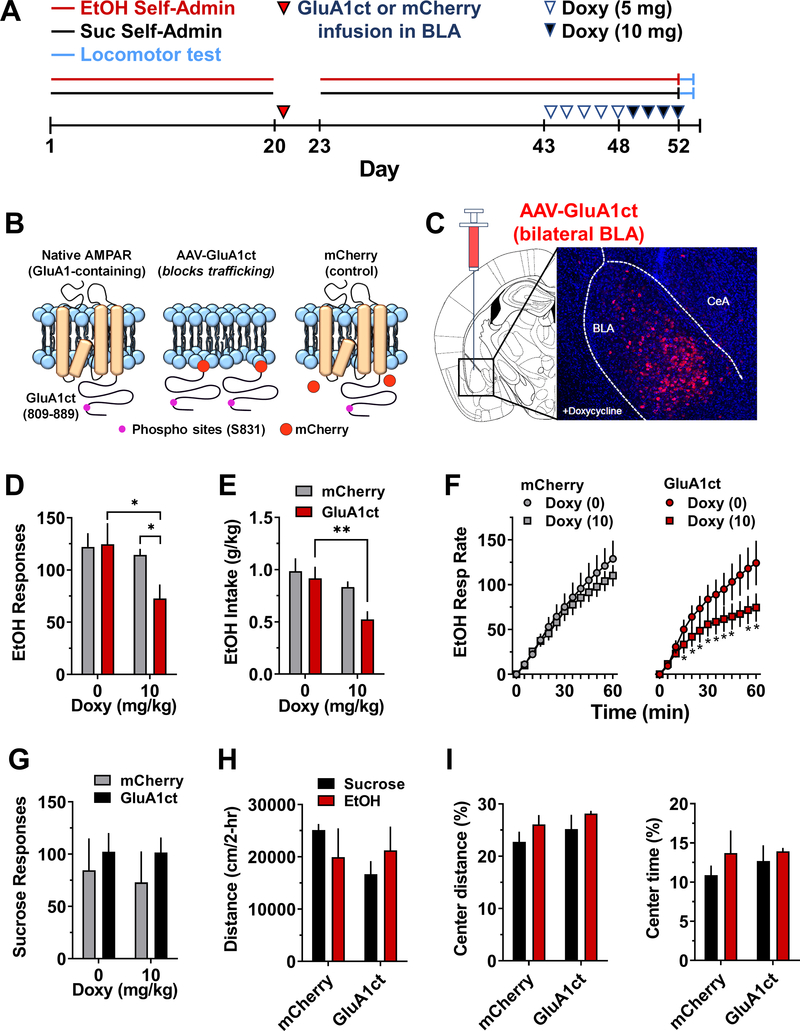
Addiction is viewed as maladaptive glutamate-mediated neuroplasticity that is regulated, in part, by calcium-permeable AMPA receptor (CP-AMPAR) activity. However, the contribution of CP-AMPARs to alcohol-seeking behavior remains to be elucidated. We evaluated CP-AMPAR activity in the basolateral amygdala (BLA) as a potential target of alcohol that also regulates alcohol self-administration in C57BL/6J mice. Operant self-administration of sweetened alcohol increased spontaneous EPSC frequency in BLA neurons that project to the nucleus accumbens as compared with behavior-matched sucrose controls indicating an alcohol-specific upregulation of synaptic activity. Bath application of the CP-AMPAR antagonist NASPM decreased evoked EPSC amplitude only in alcohol self-administering mice indicating alcohol-induced synaptic insertion of CP-AMPARs in BLA projection neurons. Moreover, NASPM infusion in the BLA dose-dependently decreased the rate of operant alcohol self-administration providing direct evidence for CP-AMPAR regulation of alcohol reinforcement. As most CP-AMPARs are GluA1-containing, we asked if alcohol alters the activation state of GluA1-containing AMPARs. Immunocytochemistry results showed elevated GluA1-S831 phosphorylation in the BLA of alcohol as compared with sucrose mice. To investigate mechanistic regulation of alcohol self-administration by GluA1-containing AMPARs, we evaluated the necessity of GluA1 trafficking using a TET-ON AAV encoding a dominant-negative GluA1 c-terminus (GluA1ct) that blocks activity-dependent synaptic delivery of native GluA1-containing AMPARs. GluA1ct expression in the BLA reduced alcohol self-administration with no effect on sucrose controls. These results show that CP-AMPAR activity and GluA1 trafficking in the BLA mechanistically regulate the reinforcing effects of sweetened alcohol. Pharmacotherapeutic targeting these mechanisms of maladaptive neuroplasticity may aid medical management of alcohol use disorder.

Keywords: GluA1; alcohol drinking; basolateral amygdala.


Conflict of interest statement

DISCLOSURE/CONFLICT OF INTEREST

The authors declare no conflicts of interest.

Figures

Figure 1.
Figure 1.. Enhanced CP-AMPAR activity in BLA neurons that project to the NAcb after alcohol self-administration as compared to sucrose.
(A) Experimental timeline and schematic showing retrobead infusion in NAcbC followed by 40 days of ethanol (EtOH) or sucrose (Suc) self-administration. BLA recordings were conducted 24-h after the last self-administration session. (B – E) Parameters of EtOH (red bars) and sucrose (black bars) self-administration show behavior-matched performance between the sweetened alcohol and sucrose-only conditions with no differences in total responses (B), active lever responses (C), or reinforcers earned per hour (D), n=7/group. (E) Ethanol self-administration behavior resulted in average consumption of 0.83 g/kg per session. (F) Photomicrograph showing retrobead expression in the BLA following infusion in NAcbC. (G) Average plot showing a significant increase in sEPSC frequency in BLA neurons projecting to the NAcbC from alcohol exposed mice as compared to sucrose control; * - t(10) = 2.8, P = 0.02, alcohol n=6 cells from 6 mice, sucrose n=6 cells from 4 mice. (H) sEPSC amplitude was not changed by ethanol self-administration as compared to sucrose control. (I) Representative traces illustrating EtOH-induced increase in sEPSC frequency but not amplitude. (J) Time course of eEPSC amplitude (MEAN±SEM) during baseline (min 1 – 4) and bath application of NASPM (100 μM; min 5 – 20) from sucrose vs. ethanol self-administering mice. Data are normalized to minute 4 of the baseline. Alcohol n=6 cells from 6 mice, sucrose n=6 cells from 4 mice. (K) Peak inhibition of eEPSC amplitude by NASPM (MEAN±SEM from last 2 minutes of NASPM application) showing heightened sensitivity in EtOH self-administering as compared to sucrose control mice; * - t(9) = 2.5, P = 0.03. (L) MEAN±SEM paired-pulse ratio of eSPSC amplitude calculated during pre-NASPM baseline.
Figure 2.
Figure 2.. Blocking CP-AMPAR activity in the BLA reduced operant alcohol self-administration.
(A) Timeline of procedures with schematic showing self-administration and locomotor test apparatus, duration of ethanol access, and anatomical location of NASPM infusions in the BLA. B – E, Self-administration: (B) NASPM (0 – 10 μg/side) infusion in the BLA significantly reduced total ethanol (EtOH) reinforced responses F(4,20) = 9.87, P < 0.0001, asterisks indicate significantly different from vehicle: ** - P = 0.006, *** - P < 0.0001; RM-ANOVA followed by Dunnett’s multiple comparison test. There was no individual (between subjects) difference in total responding F (5, 20) = 2.144, P = 0.1. (C) EtOH-reinforced response rate increased as a function of time F(12,60) = 32.3, P < 0.0001. NASPM (0, 5.6, and 10.0 μg/side) produced a significant dose-dependent reduction in EtOH-reinforced response rate: drug factor F(2,10) = 24.1, P = 0.0001, drug x time interaction F(24,120) = 26.5, P < 0.001, asterisks indicate significantly different from aCSF vehicle at corresponding time point: * − 0.002 ≤ P ≤ 0.04; RM-ANOVA followed by Dunnett’s multiple comparisons test. Response rate data were found to be normally distributed (D’Agostino-Pearson test, α=0.05) (D) EtOH dose (g/kg) consumed was reduced as a function of NASPM (0 – 10 μg/side) F(4,20) = 9.2, P = 0.0002, asterisks indicate significantly different from vehicle: ** - P = 0.01, *** - P < 0.001 Dunnett’s multiple comparison test. There were no between subject difference in EtOH dose F (5, 20) = 1.292, P=0.3064. (E) NASPM had no effect on number of head-pokes per reinforcer. F – G, Locomotor activity: NASPM (0 or 5.6 μg/side) infusion in the BLA had no effect on motor function as shown by total horizontal distance (cm/1-h) traveled (F) or velocity (cm/5-min) of locomotor activity (G). All data represent MEAN±SEM, n=6.
Figure 3.
Figure 3.. Operant alcohol self-administration increases pGluA1-S831 immunoreactivity in the BLA as compared to behavior-matched sucrose controls.
(A) Schematic of operant conditioning chamber with active and inactive levers, and timeline of experimental procedure. (B) Number of responses per hour (r/h) on the active lever; (C) percentage of responses on the active lever showing preference; and (D) number of reinforcers earned per hour showed no difference between sucrose (S) and ethanol (E) self-administering mice. (E) Measurement of ethanol dosage (g/kg) showed that mice consumed pharmacologically meaningful levels of the drug during 1-h sessions as previously shown in Faccidomo et al., 2009. (F-G) Ethanol (E) self-administration was associated with a significant increase in pGluA1-S831 immunoreactivity (IR) as measured by cells/mm2 [t(14) = 2.0, P = 0.03] and pixels/mm2 [t(14) = 2.1, P = 0.026]. Data represent MEAN±SEM, n=8 / group; * - P<0.05 relative to sucrose (S) controls. (H) Photomicrographs showing pGluA1-S831 IR in the BLA after sucrose or ethanol self-administration at 10X (left) and 20X (right) magnification. Dashed line indicates the BLA boundary used for analysis of pGluA1-S831 immunoreactivity. (I) Photomicrographs showing illustrating the membrane-like nonoverlapping expression pattern of GluA1 compared to DraQ5 nuclear immunoreactivity in the BLA. All data represent MEAN±SEM, n=8.
Figure 4.
Figure 4.. Inhibition of AMPAR GluA1 trafficking in the BLA selectively attenuated operant ethanol self-administration.
(A) Timeline of experimental procedures. (B) Schematic showing native membrane bound GluA1-containing AMPAR with the c-terminus showing the CaMKII substrate S831, membrane block by the AAV-GluA1ct with mCherry tag, and mCherry control with normal AMPAR membrane trafficking. (C) Schematic showing region of the BLA with image of AAV-GluA1ct expression in the presence of doxycycline (Doxy). (D) Total ethanol-reinforced responses plotted as a function of oral Doxy dosage. Two-way RM-ANOVA – main effect of Doxy treatment: F(1,12) = 10.52; Doxy X GluA1ct interaction: F(1, 12) = 5.84; *P < 0.05 GluA1ct (n=6) versus mCherry control (n=8) after Doxy (10 mg/kg) and Doxy (0 mg/kg) versus Doxy (10 mg/kg) within GluA1ct; Šídák’s test. (E) Ethanol intake (g/kg) plotted as a function of Doxy. Two-way RM-ANOVA – main effect of Doxy: F(1, 12) = 13.6; P=0.003, ** - P < 0.01. Significant effect of Doxy (0 vs. 10 mg/kg) within GluA1ct, Šídák’s post-hoc test. (F) EtOH-reinforced response rate (cumulative resp / 5-min) plotted as a function of time (min). Separate two-way RM-ANOVAs – mCherry control group showed main effect of time: F (12, 168) = 83.5, P < .0001 but no effect of Doxy and no interaction. GluA1ct group showed main effect of time: F (12, 60) = 25.86, P<0.0001; main effect of Doxy: F (1, 5) = 8.139, P=0.0357; Doxy X time interaction: F (12, 60) = 5.68, P=0.044. Post hoc comparison: Doxy (10) versus Doxy (0) at corresponding time: *P<0.001 – 0.05. (G) Total sucrose-reinforced responses plotted as a function of Doxy dosage. RM-ANOVA found no effect of Doxy. (H) Distance traveled (cm/2-hr) in an open field by sucrose and ethanol self-administering mice plotted as a function of AAV condition (mCherry versus GluA1ct). (I) Thigmotaxis expressed as distance traveled in the center zone (% of total) and time spent in center (% of total) as a function of AAV condition. All data are presented as group Mean ± SEM.

References

    1. Grant BF, Goldstein RB, Saha TD, et al. Epidemiology of DSM-5 Alcohol Use Disorder: Results From the National Epidemiologic Survey on Alcohol and Related Conditions III. JAMA Psychiatry. 2015;72(8):757–766. - PMC - PubMed
    1. Thorndike EL. The elements of psychology. New York:A. G. Seiler; 1905.
    1. Skinner BF. The behavior of organisms: An experimental analysis. New York: Appleton-Century-Crofts; 1938.
    1. Koob GF, Volkow ND. Neurocircuitry of addiction. Neuropsychopharmacology : official publication of the American College of Neuropsychopharmacology. 2010;35(1):217–238. - PMC - PubMed
    1. Wise RA, Koob GF. The Development and Maintenance of Drug Addiction. Neuropsychopharmacology : official publication of the American College of Neuropsychopharmacology. 2013;39(2):254–262. - PMC - PubMed

Publication types