. 2021 May 5;33(3):548-565.
doi: 10.1093/plcell/koaa041.

MYB transcription factors drive evolutionary innovations in Arabidopsis fruit trichome patterning

Affiliations

MYB transcription factors drive evolutionary innovations in Arabidopsis fruit trichome patterning

Noelia Arteaga et al. Plant Cell. .

Abstract

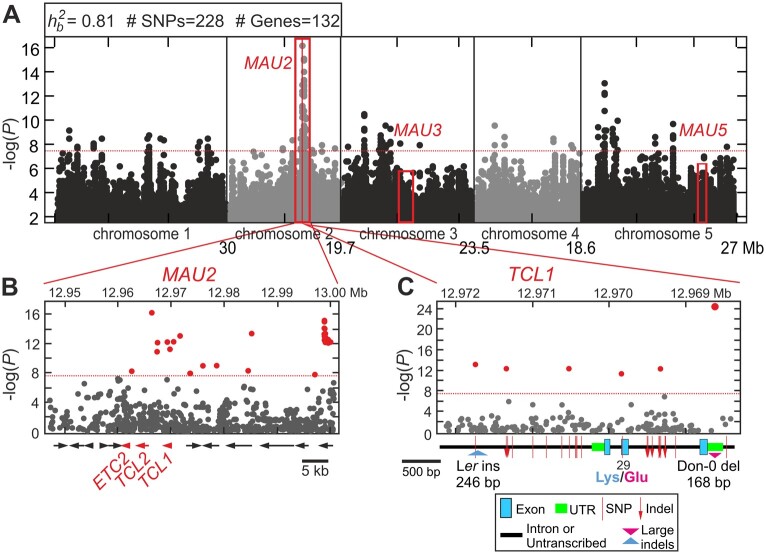
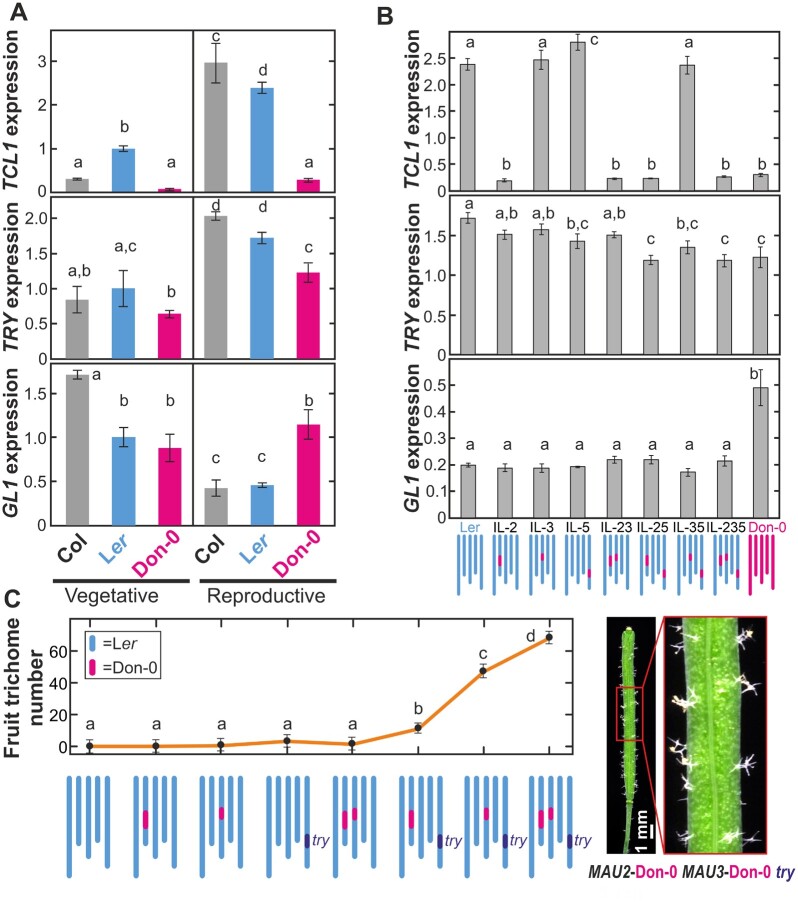
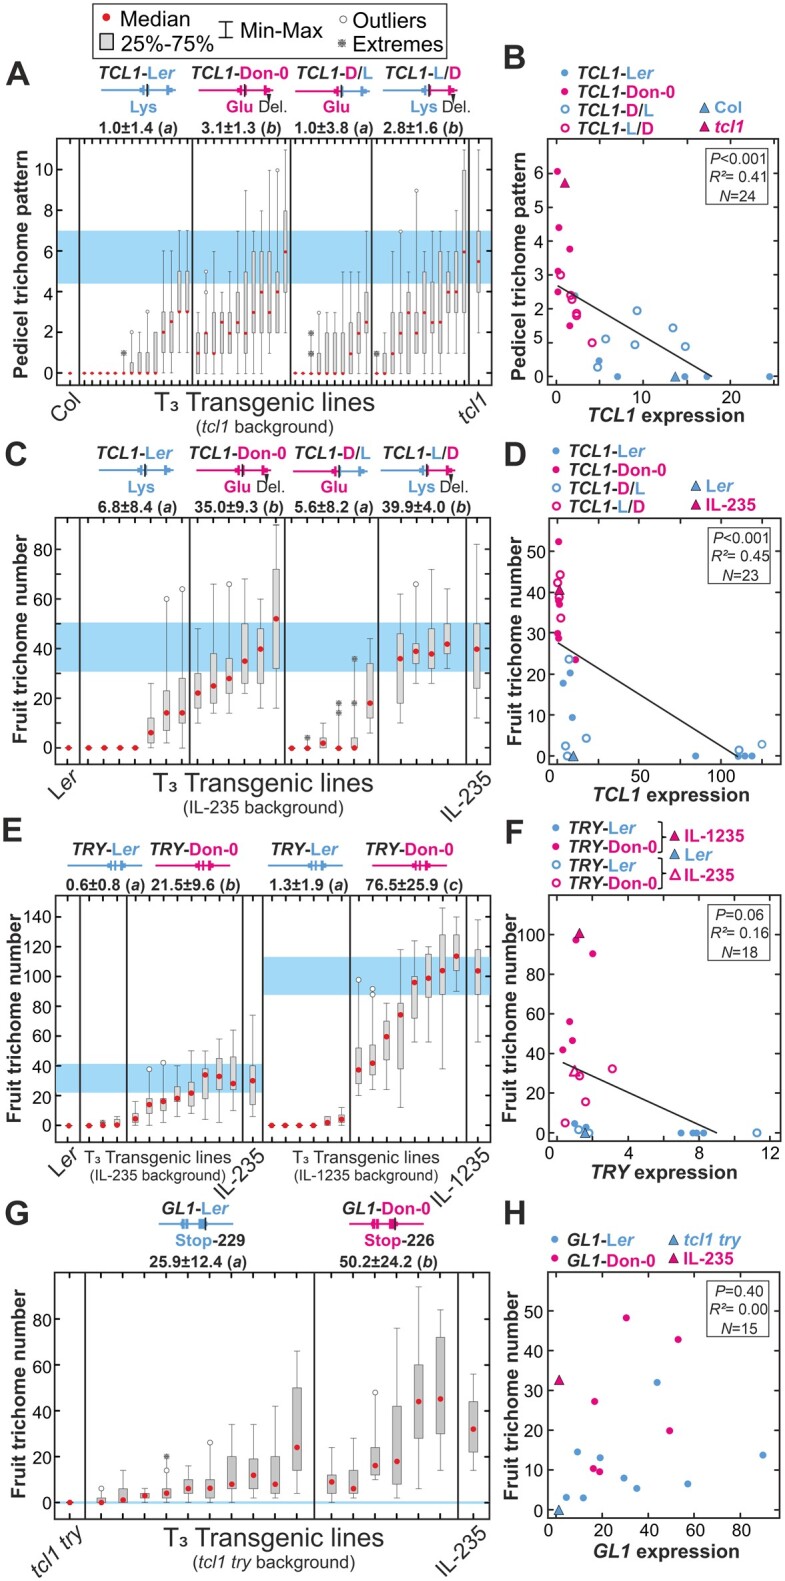
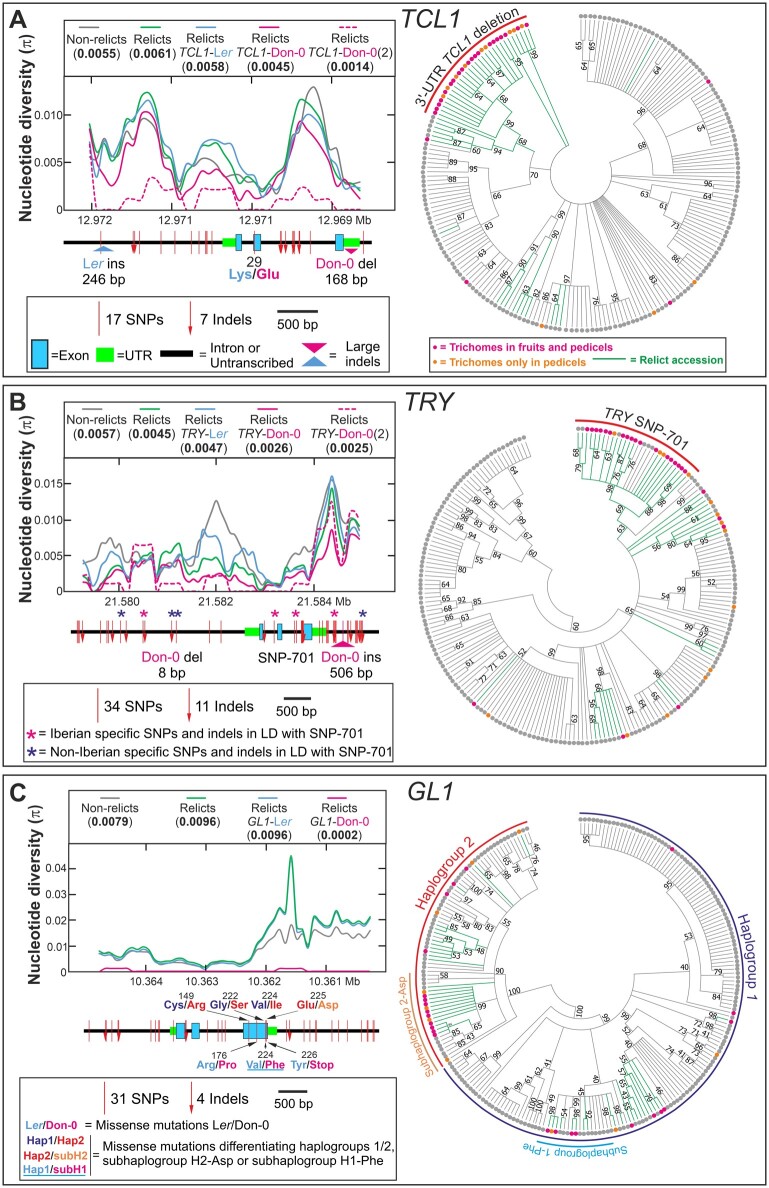
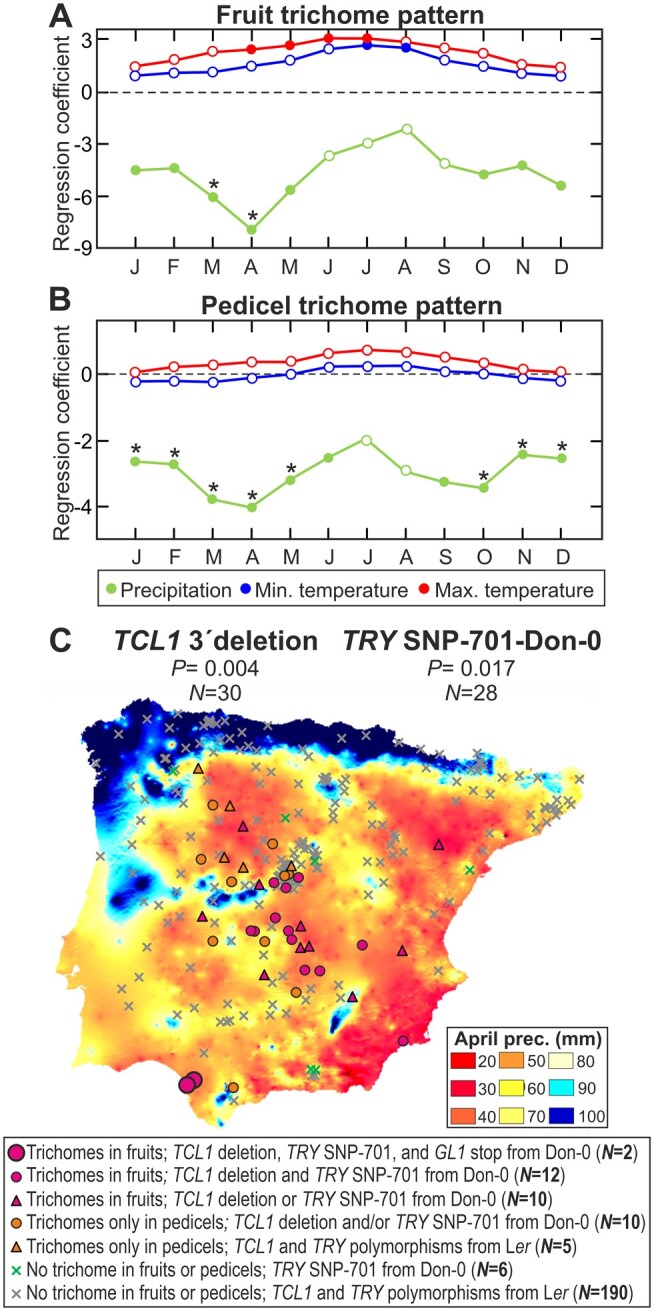
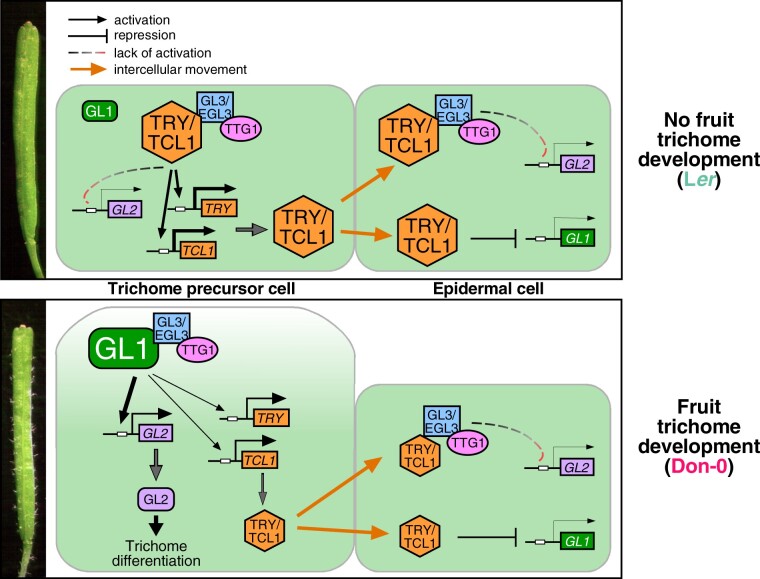
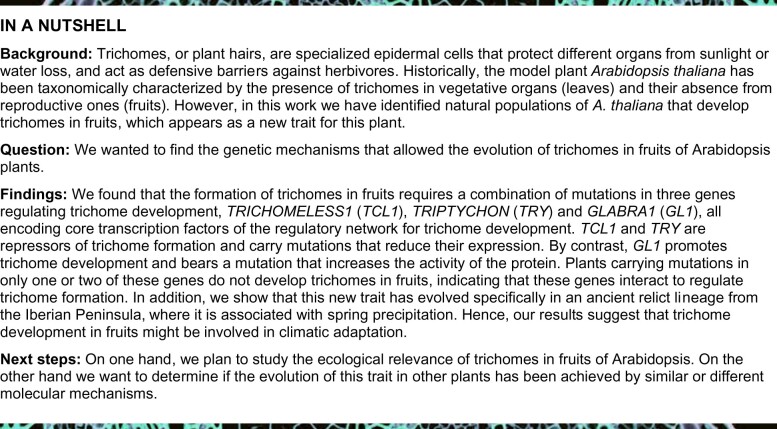
Both inter- and intra-specific diversity has been described for trichome patterning in fruits, which is presumably involved in plant adaptation. However, the mechanisms underlying this developmental trait have been hardly addressed. Here we examined natural populations of Arabidopsis (Arabidopsis thaliana) that develop trichomes in fruits and pedicels, phenotypes previously not reported in the Arabidopsis genus. Genetic analyses identified five loci, MALAMBRUNO 1-5 (MAU1-5), with MAU2, MAU3, and MAU5 showing strong epistatic interactions that are necessary and sufficient to display these traits. Functional characterization of these three loci revealed cis-regulatory mutations in TRICHOMELESS1 and TRIPTYCHON, as well as a structural mutation in GLABRA1. Therefore, the multiple mechanisms controlled by three MYB transcription factors of the core regulatory network for trichome patterning have jointly been modulated to trigger trichome development in fruits. Furthermore, analyses of worldwide accessions showed that these traits and mutations only occur in a highly differentiated relict lineage from the Iberian Peninsula. In addition, these traits and alleles were associated with low spring precipitation, which suggests that trichome development in fruits and pedicels might be involved in climatic adaptation. Thus, we show that the combination of synergistic mutations in a gene regulatory circuit has driven evolutionary innovations in fruit trichome patterning in Arabidopsis.


Figures

Figure 1
Figure 1
Genetic bases and geographic distribution of trichome pattern variation in fruits and pedicels of Arabidopsis. A–D, Photographs of carpels (A, B), fruits (C), and pedicels (D) of Don-0 and Ler accessions taken under stereomicroscope (A, C, D) or by scanning electron microscopy (B). In (D), Moj-0 accession is also included to illustrate the development of trichomes in pedicels but not in fruits. E, QTL mapping of fruit trichome pattern in the Don-0/Ler RIL population. Genetic maps of Arabidopsis linkage groups are shown in the abscissa and LOD scores in the ordinate. The LOD threshold used for QTL detection is shown as a hatched horizontal line, and the 2-LOD support intervals of the detected QTL are depicted as gray horizontal lines on the genetic maps. For each QTL, its name and the percentage of explained phenotypic variance is included. F, Geographic distribution of Iberian populations classified according to their genetic group (relicts and nonrelicts) and the development of trichomes in fruits and pedicels. The number of accessions in each class is indicated in the legend. G, Trichome number in the first fruit (FTN; upper panel), and pedicel trichome pattern measured as the number of hairy pedicels in the first 30 fruits (PTP; lower panel), of ILs differing in MAU2, MAU3, and MAU5 Don-0/Ler alleles. Dots and bars correspond to means ± 0.95 confidence intervals of three lines per genotype (10–24 plants per line). Graphical genotypes of ILs are depicted in the lower part of the panel. Differences among genotypes were tested by mixed linear models, and the same or different letters indicate nonsignificant and significant differences as tested by Tukey’s test (P <0.05).
Figure 2
Figure 2
GWA analyses of pedicel trichome pattern. A, Manhattan plots from a GWA study carried out with 235 Iberian accessions phenotyped qualitatively for the absence/presence of trichomes in pedicels. The heritability of the trait, as well as the number of associated SNPs and genes, are indicated in the upper part of the panel. Mapping intervals of MAU2, MAU3, and MAU5 are shown as red boxes. B and C, Zooms of Manhattan plots in MAU2 genomic region (B) and along TCL1 gene (C). In (B), genes across the ∼50-kb MAU2 region displaying the most significant associations are depicted in the lower part of the panel, including the gene cluster of ETC2, TCL2, and TCL1. In the lower part of (C), TCL1 structure in introns, exons, and UTRs is presented, depicting the SNPs, indels, and missense mutations found between Don-0 and Ler. The effect of the 3′-UTR deletion of TCL1 (Don-0 del 168 bp) is included in (C) but not in (A) and (B), which were based on segregating SNPs. The red dotted line of each panel indicates the significance threshold of –log(P)=7.64 (corresponding to 5% with Bonferroni correction for multiple testing); SNPs above this threshold are red colored in (B) and (C).
Figure 3
Figure 3
Expression and fruit trichome pattern of candidate genes in parental and introgression lines. A, TCL1, TRY, and GL1 expression in vegetative and reproductive organs of parental accessions. B, TCL1, TRY, and GL1 expression in reproductive organs of ILs bearing Don-0 alleles in MAU2, MAU3, and/or MAU5. In (A) and (B), each bar depicts the mean ± se of three biological replicates, and values of all lines are relative to Ler vegetative expression. C, Effect of try mutant allele on fruit trichome number (number of trichomes in the first fruit) when combined with Don-0 alleles in MAU2 and/or MAU3. Dots and bars represent means ± 0.95 confidence intervals of two to three lines per genotype (7–10 plants per line) homozygous for Don-0 or Ler alleles in MAU2 and MAU3, as well as for TRY wild-type or try mutant alleles. A fruit of a homozygous try plant carrying Don-0 alleles at MAU2 and MAU3 is shown in the right side of the panel to illustrate the highly branched and aggregated trichomes of this genotype. In (B) and (C), graphical genotypes of ILs are depicted in the lower part of panels. Gene expression or phenotypic differences among genotypes were statistically tested by mixed linear models, the same or different letters indicating nonsignificant or significant differences, as tested by Tukey’s test (P <0.05).
Figure 4
Figure 4
Trichome pattern and gene expression of transgenic lines for TCL1, TRY, and GL1. A, C, Pedicel (A) and fruit (C) trichome phenotypes of independent homozygous transgenic lines carrying parental (left side) or chimeric (right side) genomic constructs of TCL1, in tcl1 mutant (A) or IL-235 (C) genetic backgrounds. B, D, Linear regressions between pedicel or fruit trichome patterns and TCL1 expression in flower buds, for TCL1 transgenic lines in tcl1 (B) or IL-235 (D) backgrounds. E, G, Fruit trichome number of independent homozygous transgenic lines carrying Ler or Don-0 parental genomic constructs of TRY (E) or GL1 (G) in IL-235 (left side of E), IL-1235 (right side of E), or tcl1 try (G) genetic backgrounds. F, H, Relationship between fruit trichome number and TRY (F) or GL1 (H) expression in flower buds, for TRY (F) or GL1 (H) transgenic lines. Gene expressions of transgenic lines are relative to the expression of untransformed controls. Pedicel trichome pattern was measured as the number of hairy pedicels in the first 30 fruits (A, B), whereas fruit trichome number (FTN) is the number of trichomes in the first fruit (C–H). In (A, C, E, and G), transgenic lines are arranged from low to high mean FTN, and 95% confidence intervals for untransformed controls are shown as blue-shaded areas. Phenotypic differences among genotypes were statistically tested by mixed linear models; the same or different letters on top of each panel indicate nonsignificant or significant differences, as tested by Tukey’s test (P <0.05).
Figure 5
Figure 5
Genetic diversity of TCL1, TRY, and GL1. A–C, Nucleotide diversity in Iberian accessions (left panels), and neighbor-joining (NJ) trees displaying the genetic relationships among accessions (right panels), for TCL1 (A), TRY (B), and GL1 (C). Left panels show sliding window plots of the nucleotide diversity in nonrelict accessions, and relicts classified according to their Don-0/Ler alleles. The average nucleotide diversity (π) of each group of accessions is shown in round brackets on top of each graph. To enable comparisons of relict accessions with Don-0 alleles among the three genes, Don-0(2) shows the diversity in Don-0 and Bon-61 accessions, the only genotypes with such alleles in GL1. The genomic structure of each gene, as well as the location and the total number of Ler/Don-0 SNPs and indels, are shown below the abscissa axes of left panels. In (B), TRY polymorphisms found in strong LD with the SNP in position 701 (SNP-701) are marked with asterisks, colors indicating their regional Iberian specificity or not. In (C), Ler/Don-0 missense and nonsense mutations are shown below GL1 genomic structure, whereas missense polymorphisms differentiating the major GL1 haplogroups 1 and 2, or subhaplogroups found within major haplogroups, are displayed above the gene. Note that the underlined Val/Phe-224 amino acid substitution differentiating subhaplogroup 1-Phe is polymorphic between Ler and Don-0 accessions. In NJ trees, branches corresponding to partitions reproduced in <50% (A, B) or <40% (C) bootstrap replicates are collapsed, and branches corresponding to relict accessions are colored in green. A lower cut-off value was used for GL1 tree condensation due to its larger nucleotide diversity. Accessions developing trichomes in fruits, pedicels, or none of these organs, are depicted as magenta, orange, or gray colored dots, respectively. Clusters of accessions differentiated by TCL1 or TRY mutations associated with fruit trichome patterning (A, B), or major GL1 haplogroups differentiated by missense mutations (C), are highlighted with colored lines.
Figure 6
Figure 6
Relationship between fruit or pedicel trichome pattern and climate in Arabidopsis. A, B, Logistic regression coefficients between fruit (A) or pedicel (B) trichome pattern, and monthly precipitation (green line), minimum temperature (blue line), or maximum temperature (red line), along the year. Months in the abscissa are indicated with the first letter of the month. Filled circles and asterisks depict significant regressions (P <0.05 or 0.01, respectively), while white circles are nonsignificant coefficients. C, Geographic and climatic distribution of TCL1 and TRY polymorphisms associated with fruit trichome pattern and April precipitation. Map shows the distribution of populations classified according to trichome development in fruits and/or pedicels, and their alleles in TCL1 3′-UTR deletion and TRY SNP-701 (see legend below the map). Number of accessions with Don-0 allele, and statistical significances of the logistic regressions between polymorphisms and spring precipitation, are shown over the map.
Figure 7
Figure 7
Molecular model for the natural variation in the regulation of fruit trichome patterning in Arabidopsis. Panels depict the main regulators of trichome differentiation in epidermal precursor and neighboring cells (reviewed in Pattanaik et al., 2014; Wang and Chen, 2014) of wild accessions without (upper panel), or with (lower panel) trichomes in fruits. The molecular mechanisms underlying natural alleles of TCL1, TRY, and GL1 are represented by the size of protein symbols and transcriptional arrows, larger sizes depicting increased amount (TCL1 and TRY) or protein activity (GL1).
None

References

    1. Alexander DH, Novembre J, Lange K (2009) Fast model-based estimation of ancestry in unrelated individuals. Genome Res 19: 1655–1664 - PMC - PubMed
    1. Al-Shehbaz I, O’Kane SL (2002) Taxonomy and phylogeny of Arabidopsis (Brassicaceae). Arabidopsis Book, doi: 10.1199/tab.0001. Published September 30, 2002 - PMC - PubMed
    1. Ascaso C, Souza-Egipsy V, Sancho LG (2003) Locating water in the dehydrated thallus of lichens from extreme microhabitats (Antarctica). Lichenologica 86: 213–223
    1. Atwell S, Huang YS, Vilhjalmsson BJ, Willems G, Horton M, Li Y, Meng D, Platt A, Tarone AM, Hu TT, et al. (2010) Genome-wide association study of 107 phenotypes in Arabidopsis thaliana inbred lines. Nature 465: 627–631 - PMC - PubMed
    1. Balkunde R, Pesch M, Hulskamp M (2010). Trichome patterning in Arabidopsis thaliana from genetic to molecular models. Curr Top Dev Biol 91: 299–321 - PubMed

Publication types

MeSH terms

Substances

LinkOut - more resources