

Nowcasting COVID-19 incidence indicators during the Italian first outbreak
- PMID: 33955571
- PMCID: PMC8242495
- DOI: 10.1002/sim.9004
Nowcasting COVID-19 incidence indicators during the Italian first outbreak
Abstract
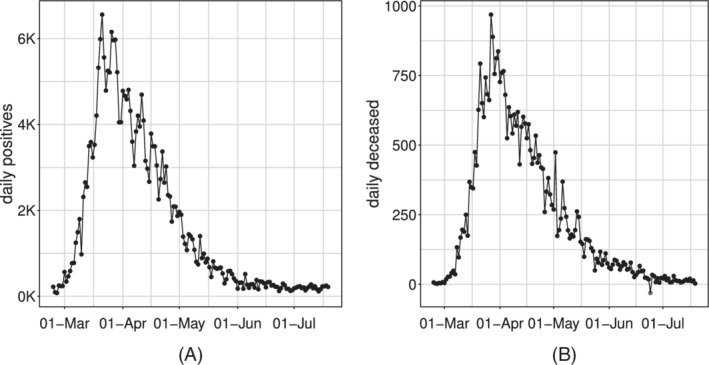
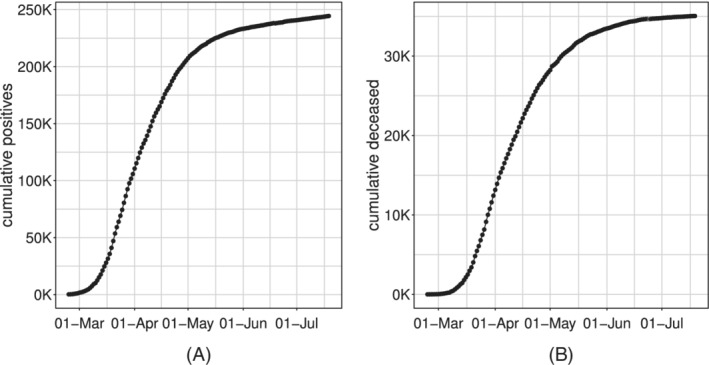
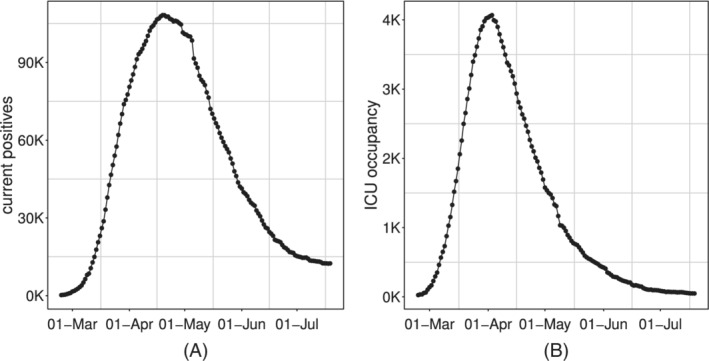
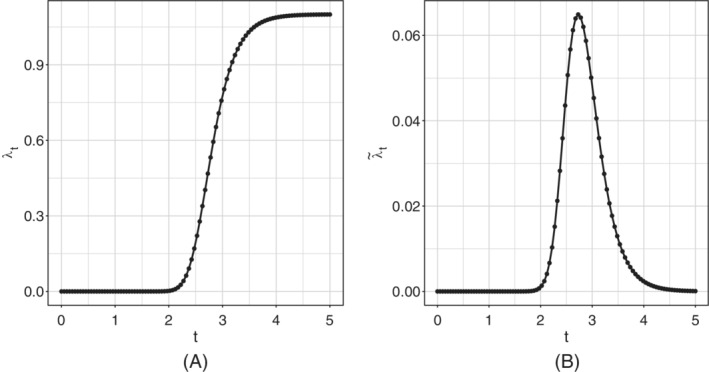
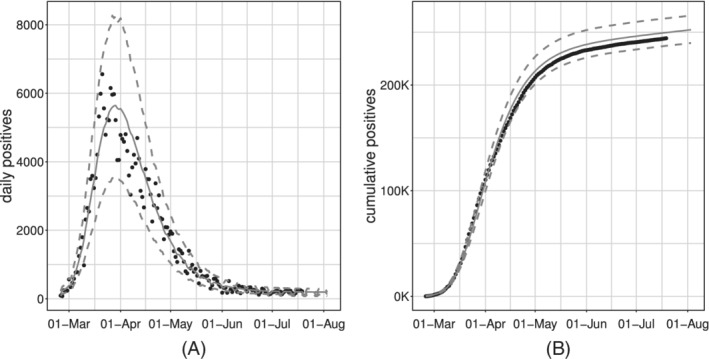
A novel parametric regression model is proposed to fit incidence data typically collected during epidemics. The proposal is motivated by real-time monitoring and short-term forecasting of the main epidemiological indicators within the first outbreak of COVID-19 in Italy. Accurate short-term predictions, including the potential effect of exogenous or external variables are provided. This ensures to accurately predict important characteristics of the epidemic (e.g., peak time and height), allowing for a better allocation of health resources over time. Parameter estimation is carried out in a maximum likelihood framework. All computational details required to reproduce the approach and replicate the results are provided.
Keywords: COVID-19; Richards' equation; SARS-CoV-2; growth curves.
© 2021 The Authors. Statistics in Medicine published by John Wiley & Sons Ltd.
Figures
References
-
- Flaxman S, Mishra S, Gandy A, et al. Estimating the number of infections and the impact of non‐pharmaceutical interventions on COVID‐19 in European countries: technical description update; 2020. arXiv:200411342.
-
- Liang K. Mathematical model of infection kinetics and its analysis for COVID‐19, SARS and MERS. Infect Genet Evolut. 2020;82:104306. http://www.sciencedirect.com/science/article/pii/S15671348203%01374. - PMC - PubMed
-
- Diekmann O, Heesterbeek H, Britton T. Mathematical Tools for Understanding Infectious Disease Dynamics. Princeton University Press: Princeton, NJ; 2013.
MeSH terms
LinkOut - more resources
Full Text Sources
Other Literature Sources
Medical
Miscellaneous