

Economic Burden of Multiple Sclerosis in Low- and Middle-Income Countries: A Systematic Review
- PMID: 33956330
- PMCID: PMC8200340
- DOI: 10.1007/s40273-021-01032-7
Economic Burden of Multiple Sclerosis in Low- and Middle-Income Countries: A Systematic Review
Abstract
Background: Although the economic burden of multiple sclerosis (MS) in high-income countries (HICs) has been extensively studied, information on the costs of MS in low- and middle-income countries (LMICs) remains scarce. Moreover, no review synthesizing and assessing the costs of MS in LMICs has yet been undertaken.
Objective: Our objective was to systematically identify and review the cost of illness (COI) of MS in LMICs to critically appraise the methodologies used, compare cost estimates across countries and by level of disease severity, and examine cost drivers.
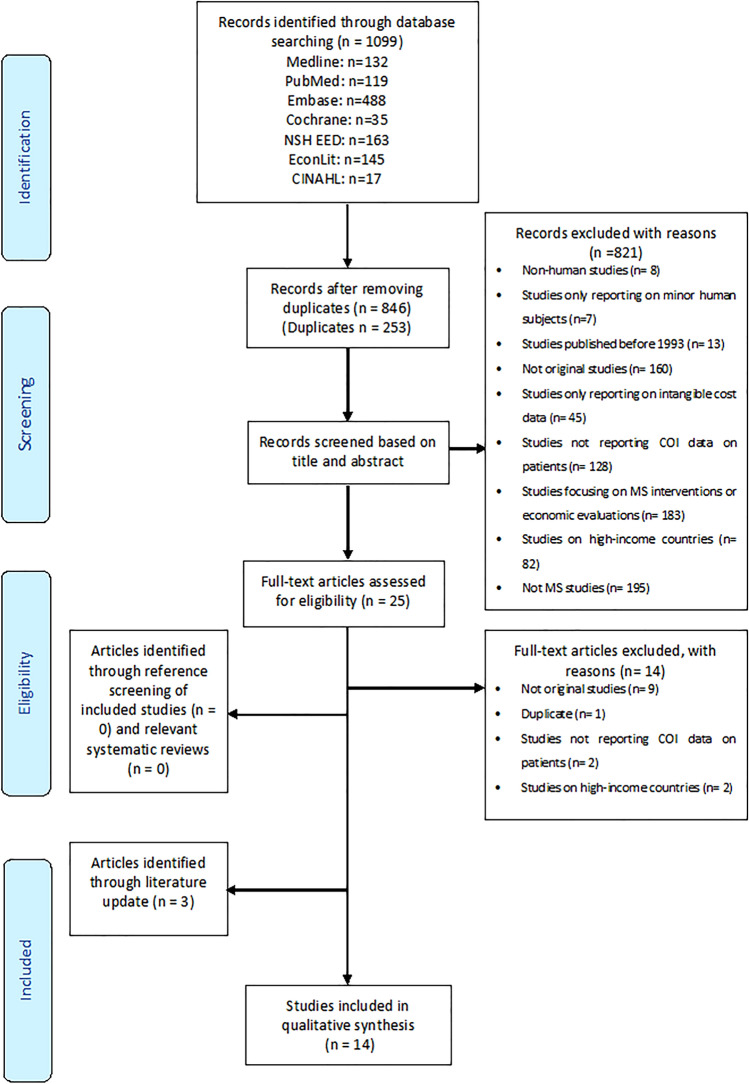
Methods: We conducted a systematic literature search for original studies in English, French, and Dutch containing prevalence or incidence-based cost data of MS in LMICs. The search was conducted in MEDLINE (Ovid), PubMed, Embase (Ovid), Cochrane Library, National Health Service Economic Evaluation Database (NHS EED), Econlit, and CINAHL (EBSCO) on July 2020 without restrictions on publication date. Recommended and validated methods were used for data extraction and analysis to make the results of the COI studies comparable. Costs were adjusted to $US, year 2019 values, using the World Bank purchasing power parity and inflated using the consumer price index.
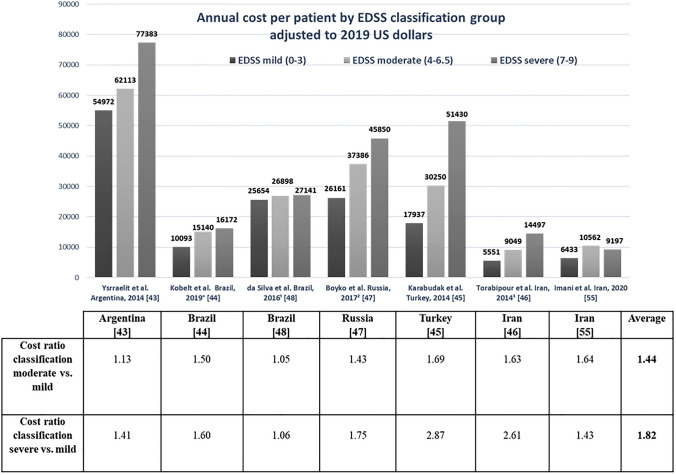
Results: A total of 14 studies were identified, all of which were conducted in upper-middle-income economies. Eight studies used a bottom-up approach for costing, and six used a top-down approach. Four studies used a societal perspective. The total annual cost per patient ranged between $US463 and 58,616. Costs varied across studies and countries, mainly because of differences regarding the inclusion of costs of disease-modifying therapies (DMTs), the range of cost items included, the methodological choices such as approaches used to estimate healthcare resource consumption, and the inclusion of informal care and productivity losses. Characteristics and methodologies of the included studies varied considerably, especially regarding the perspective adopted, cost data specification, and reporting of costs per severity levels. The total costs increased with greater disease severity. The cost ratios between different levels of MS severity within studies were relatively stable; costs were around 1-1.5 times higher for moderate versus mild MS and about two times higher for severe versus mild MS. MS drug costs were the main cost driver for less severe MS, whereas the proportion of direct non-medical costs and indirect costs increased with greater disease severity.
Conclusion: MS places a huge economic burden on healthcare systems and societies in LMICs. Methodological differences and substantial variations in terms of absolute costs were found between studies, which made comparison of studies challenging. However, the cost ratios across different levels of MS severity were similar, making comparisons between studies by disease severity feasible. Cost drivers were mainly DMTs and relapse treatments, and this was consistent across studies. Yet, the distribution of cost components varied with disease severity.
Conflict of interest statement
Jalal Dahham, Rana Rizk, Ingrid Kremer, Silvia M.A.A. Evers, and Mickaël Hiligsmann have no conflicts of interest that are directly relevant to the content of this article.
Figures
References
-
- The Multiple Sclerosis International Federation, Atlas of MS, 3rd Edition (September 2020).
-
- Dua T, Rompani P, World Health Organization, Multiple Sclerosis International Federation, editors. Atlas: multiple sclerosis resources in the world, 2008. Geneva, Switzerland: World Health Organization; 2008.
-
- Eskandarieh S, Heydarpour P, Minagar A, Pourmand S, Sahraian MA. Multiple sclerosis epidemiology in East Asia, South East Asia and South Asia: a systematic review. Neuroepidemiology. 2016;46:209–221. - PubMed
-
- Compston A, Coles A. Multiple sclerosis. Lancet. 2008;372:16. - PubMed
-
- Karussis D. The diagnosis of multiple sclerosis and the various related demyelinating syndromes: a critical review. J Autoimmun. 2014;48–49:134–142. - PubMed
Publication types
MeSH terms
LinkOut - more resources
Full Text Sources
Other Literature Sources
Medical
