. 2021 May;129(5):57003.
doi: 10.1289/EHP7612. Epub 2021 May 6.

The Kidney-Related Effects of Polystyrene Microplastics on Human Kidney Proximal Tubular Epithelial Cells HK-2 and Male C57BL/6 Mice

Affiliations

The Kidney-Related Effects of Polystyrene Microplastics on Human Kidney Proximal Tubular Epithelial Cells HK-2 and Male C57BL/6 Mice

Yung-Li Wang et al. Environ Health Perspect. 2021 May.

Abstract

Background: Understanding the epidemic of chronic kidney disease of uncertain etiology may be critical for health policies and public health responses. Recent studies have shown that microplastics (MPs) contaminate our food chain and accumulate in the gut, liver, kidney, muscle, and so on. Humans manufacture many plastics-related products. Previous studies have indicated that particles of these products have several effects on the gut and liver. Polystyrene (PS)-MPs (PS-MPs) induce several responses, such as oxidative stress, and affect living organisms.

Objectives: The aim of this study was to investigate the effects of PS-MPs in kidney cells in vitro and in vivo.

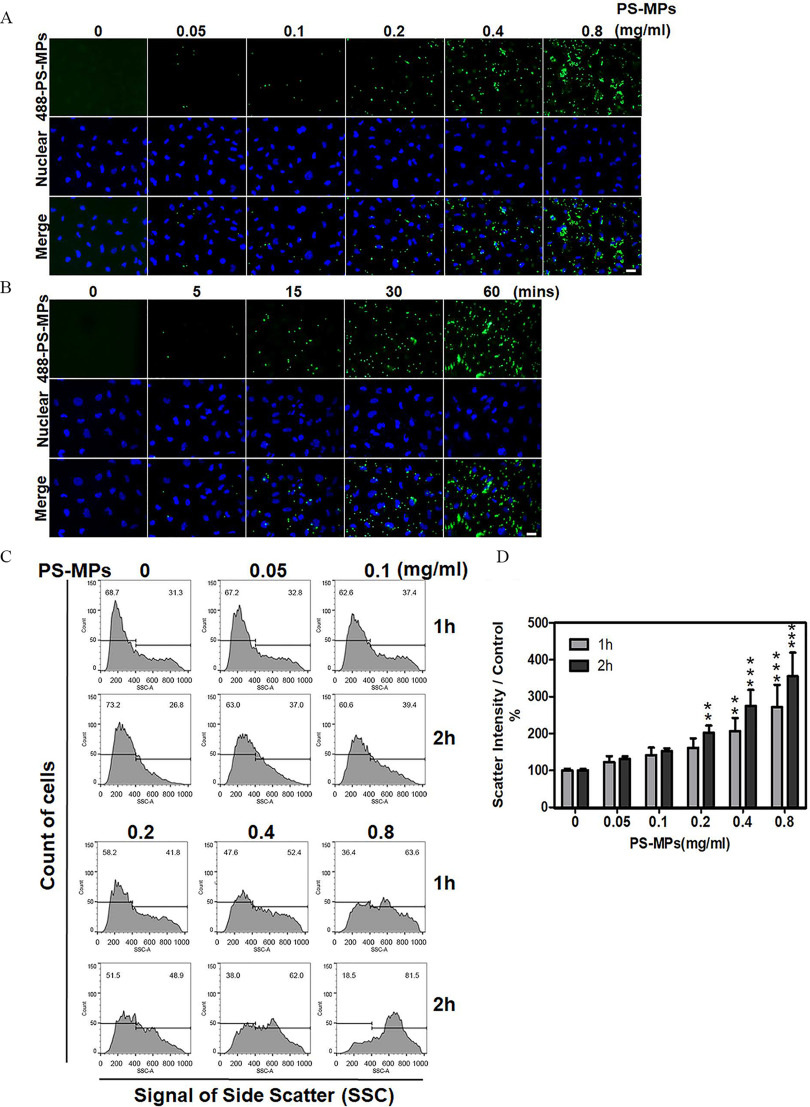
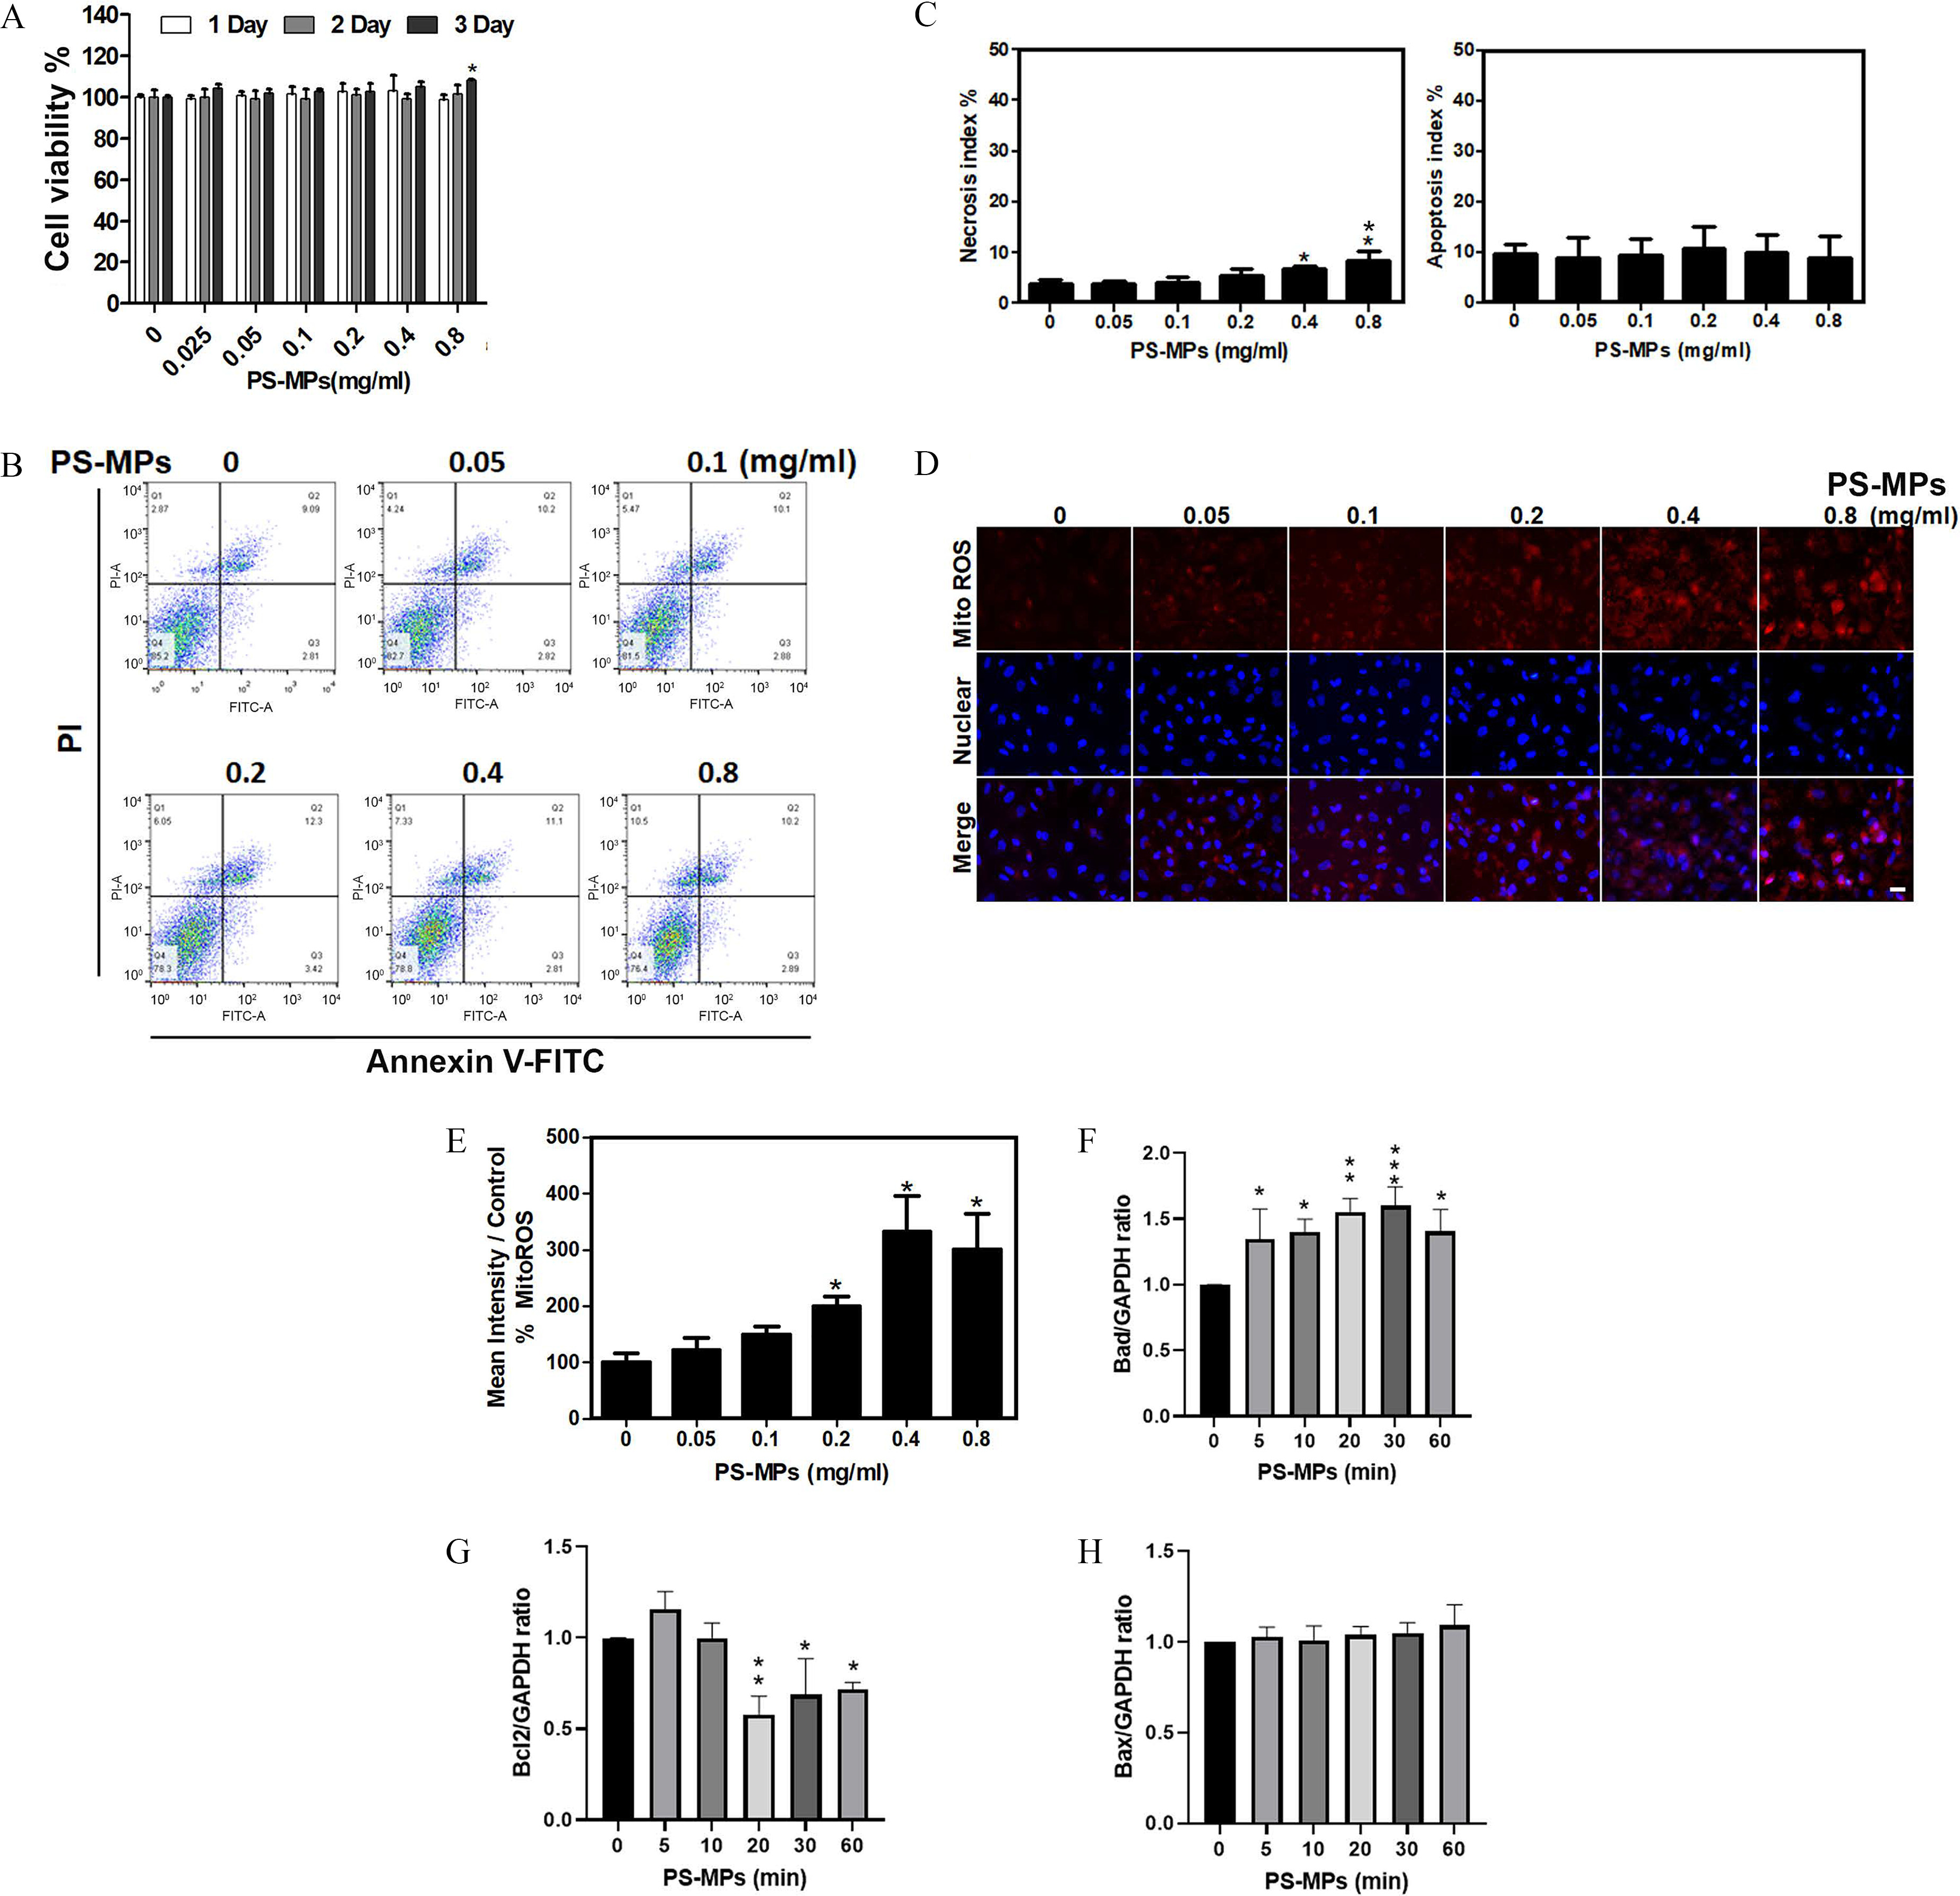
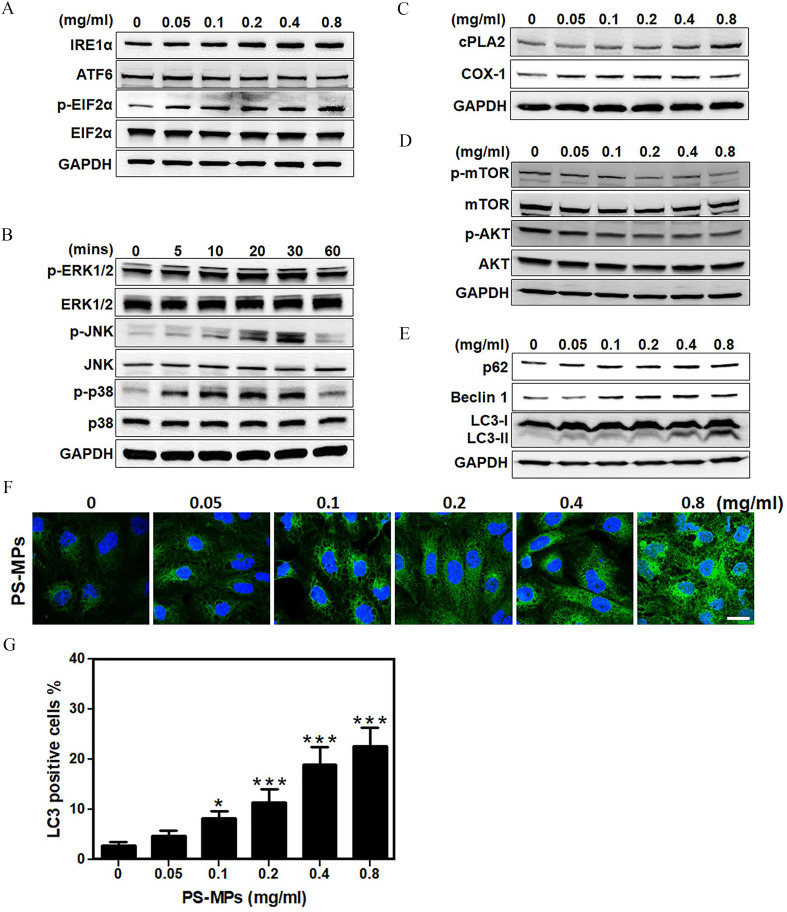
Methods: PS-MPs were evaluated in human kidney proximal tubular epithelial cells (HK-2 cells) and male C57BL/6 mice. Mitochondrial reactive oxygen species (ROS), endoplasmic reticulum (ER) stress, inflammation, and autophagy were analyzed in kidney cells. In vivo, we evaluated biomarkers of kidney function, kidney ultrastructure, muscle mass, and grip strength, and urine protein levels, as well as the accumulation of PS-MPs in the kidney tissue.

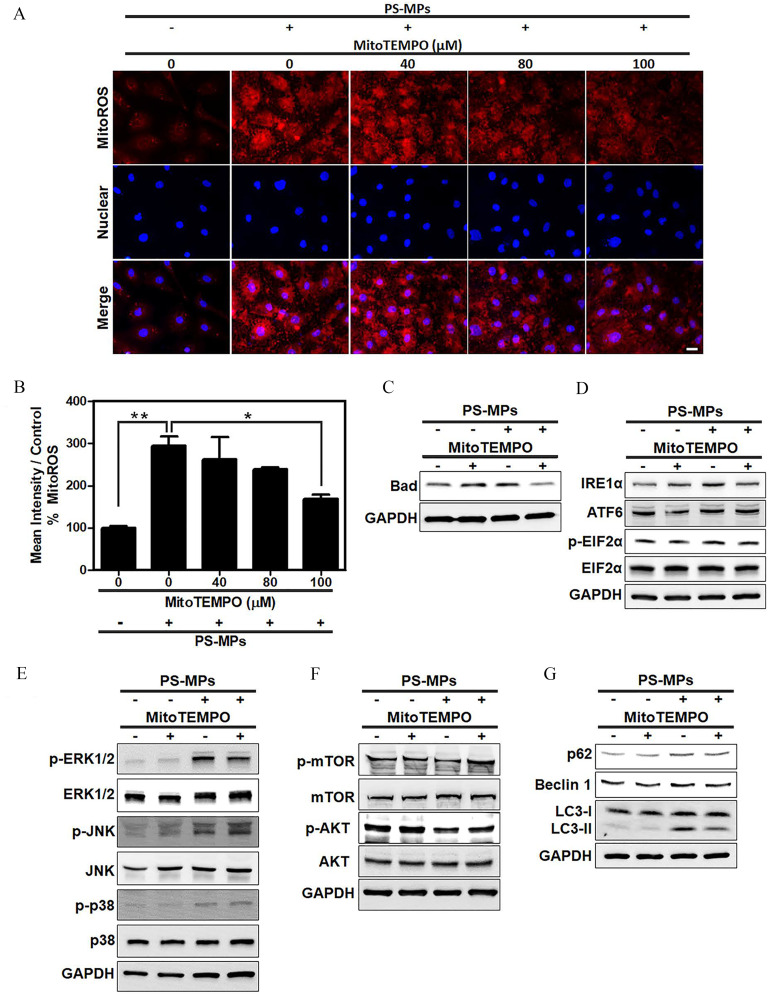
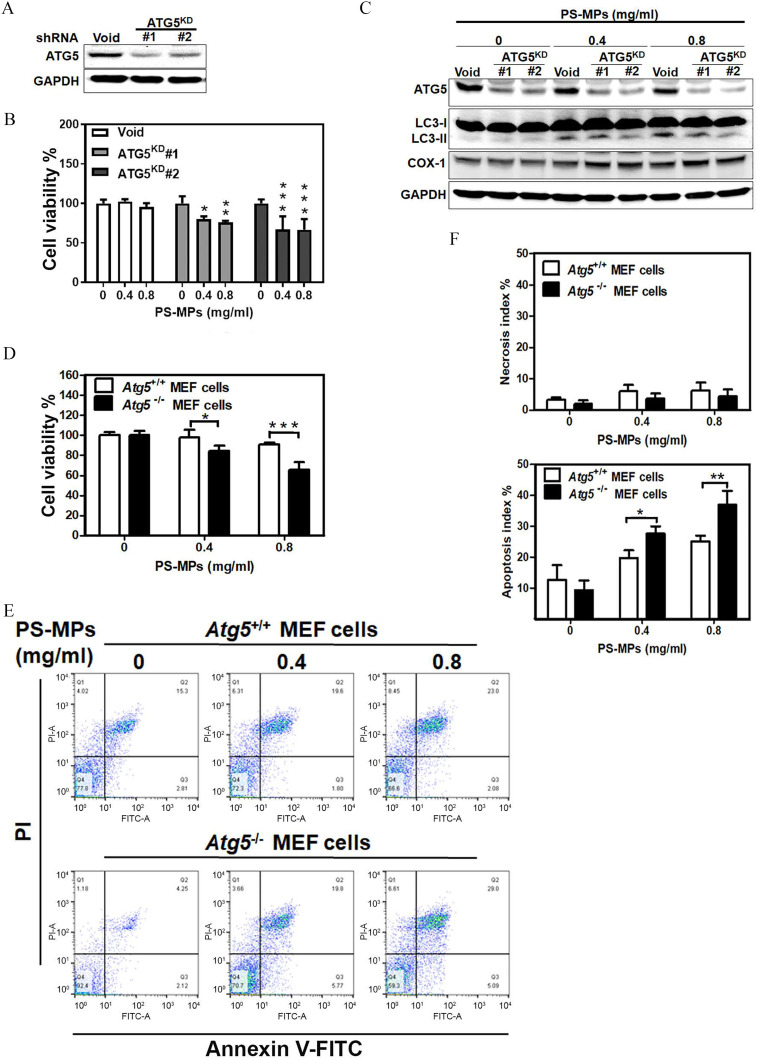
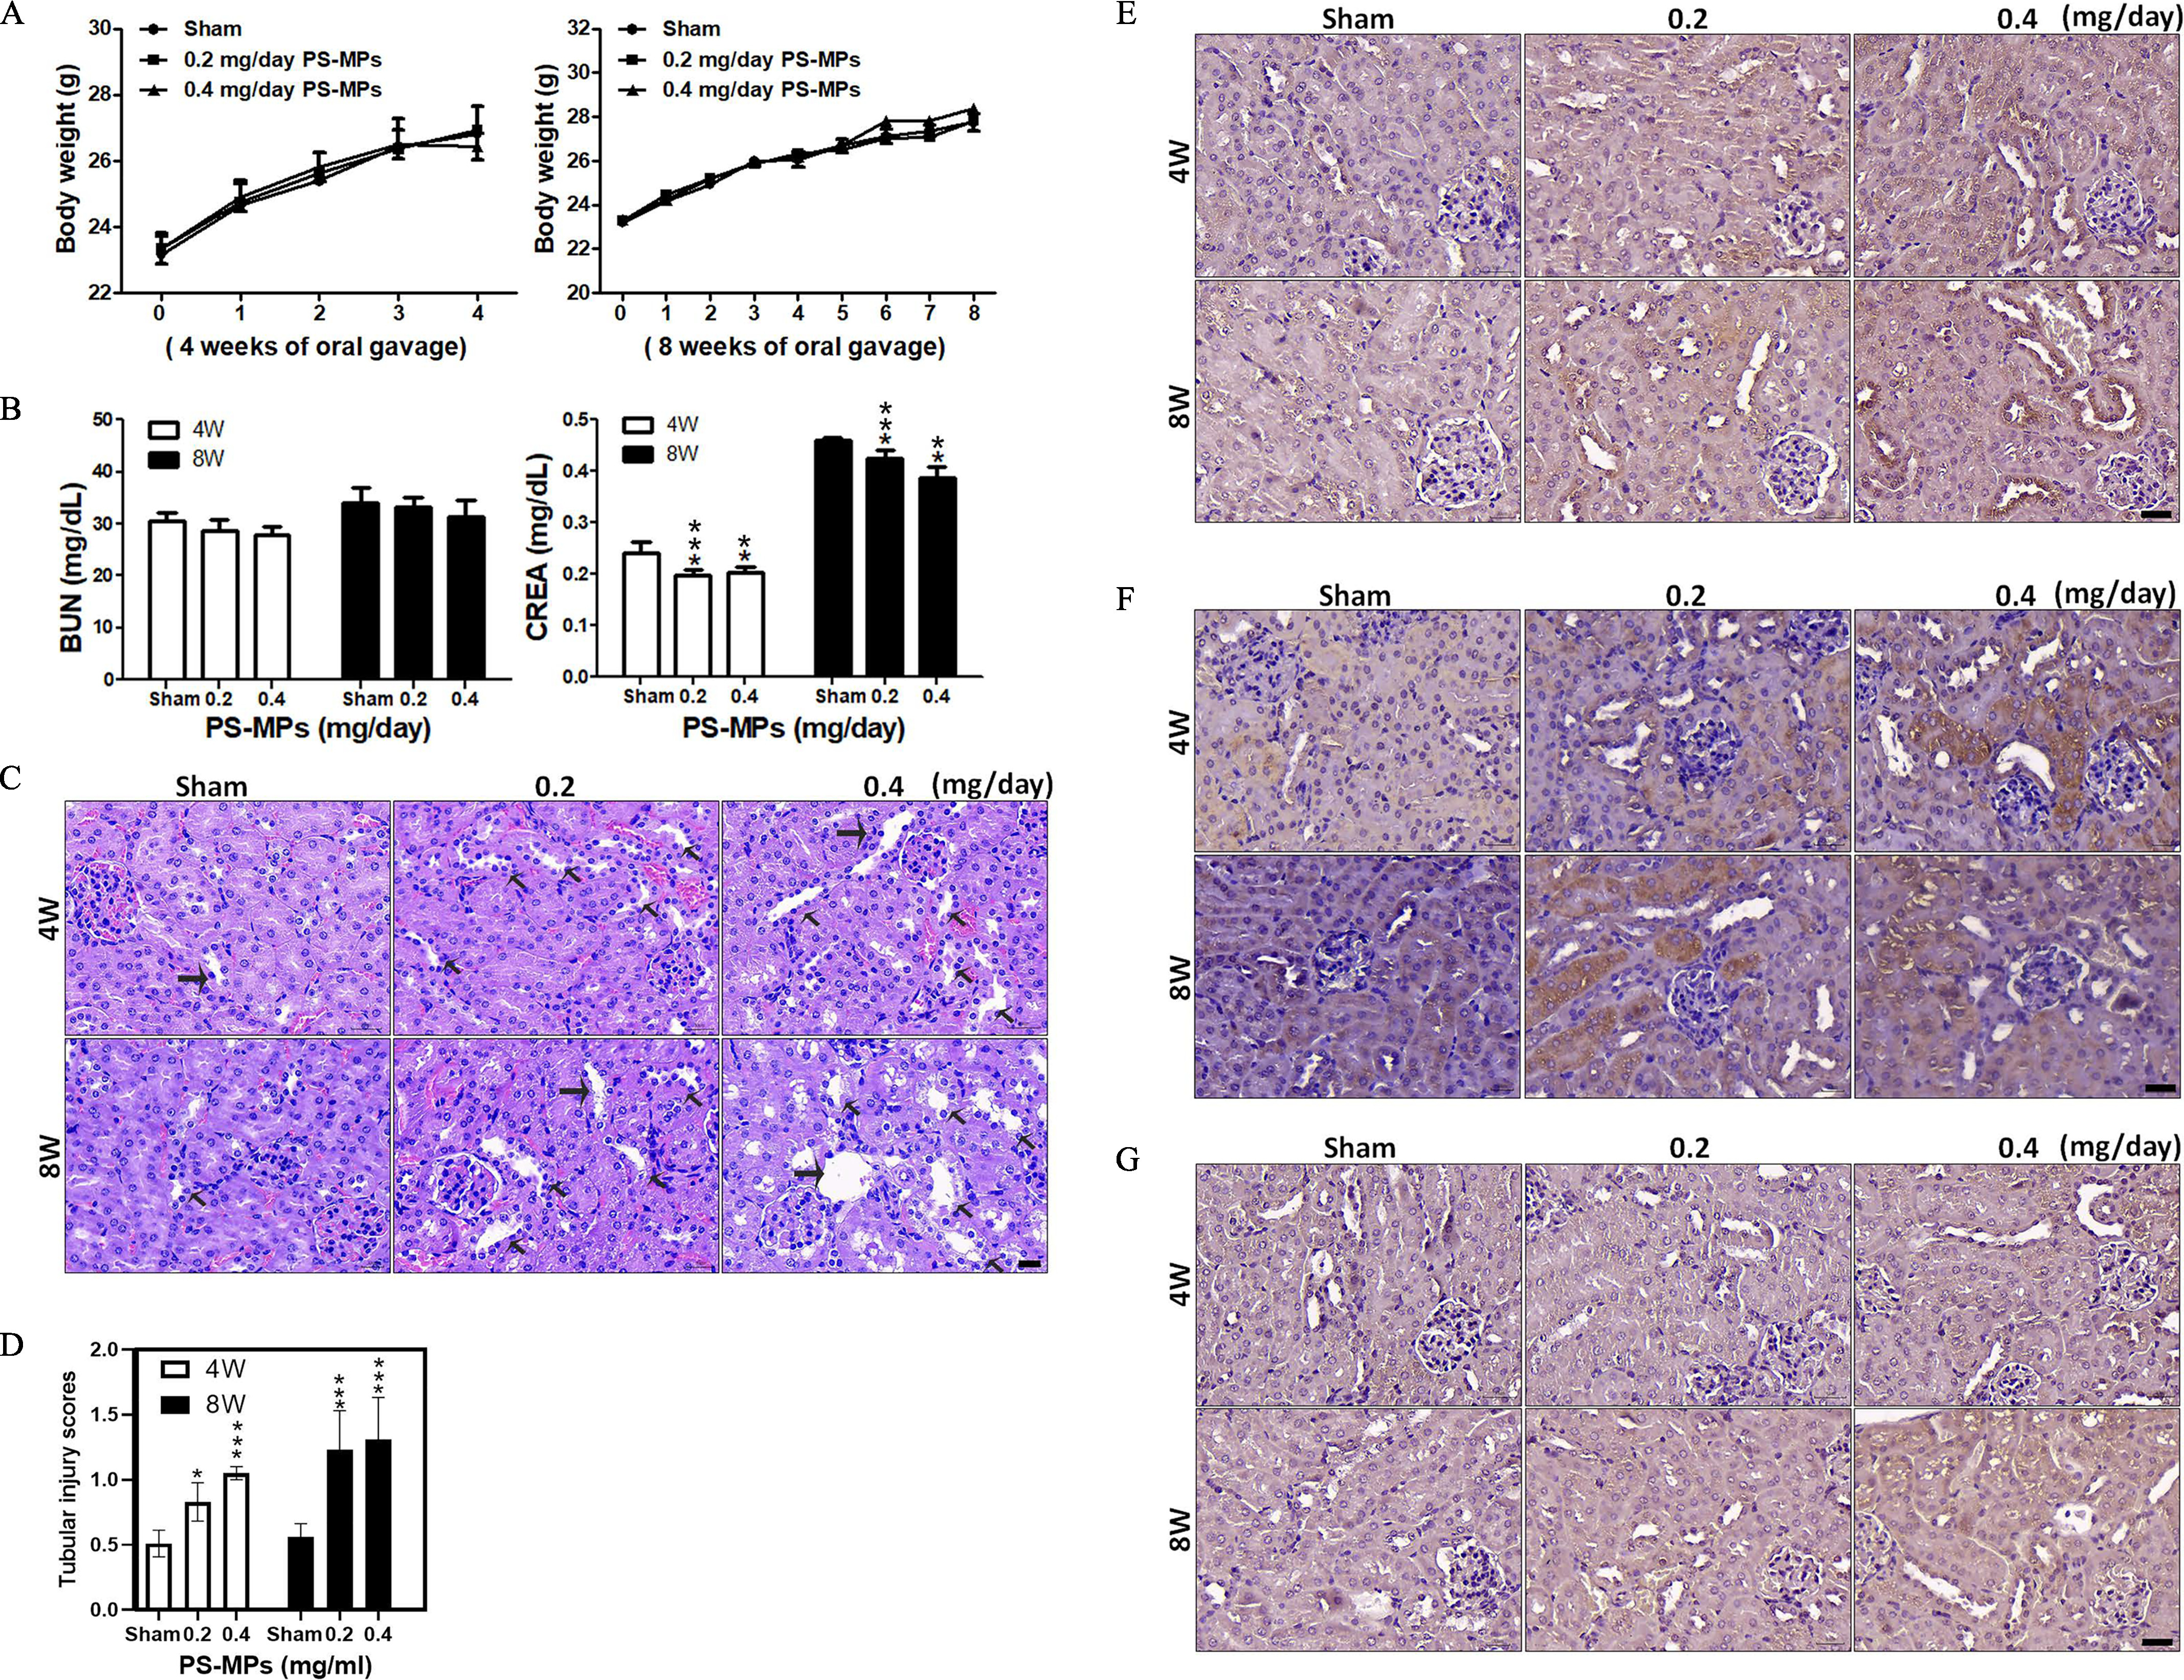
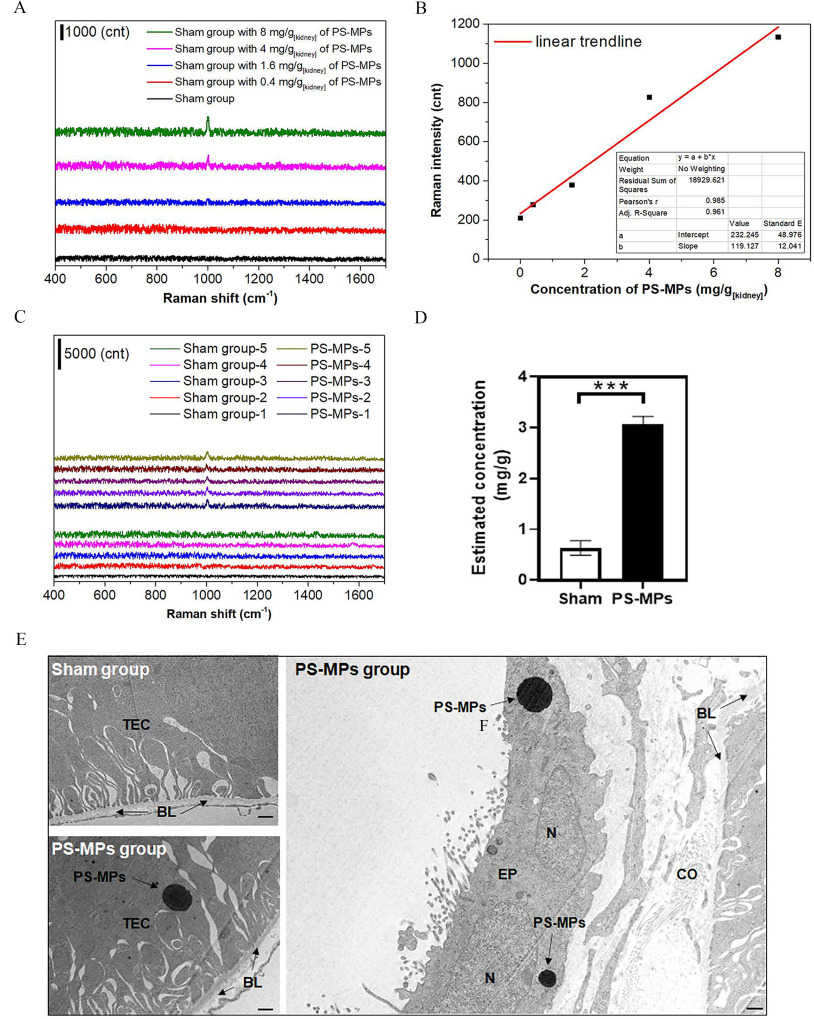
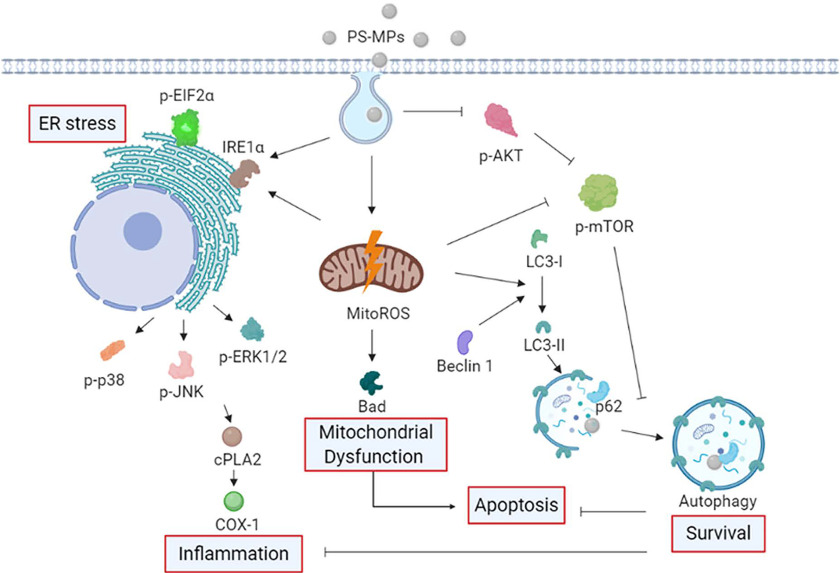
Results: Uptake of PS-MPs at different concentrations by HK-2 cells resulted in higher levels of mitochondrial ROS and the mitochondrial protein Bad. Cells exposed to PS-MPs had higher ER stress and markers of inflammation. MitoTEMPO, which is a mitochondrial ROS antioxidant, mitigated the higher levels of mitochondrial ROS, Bad, ER stress, and specific autophagy-related proteins seen with PS-MP exposure. Furthermore, cells exposed to PS-MPs had higher protein levels of LC3 and Beclin 1. PS-MPs also had changes in phosphorylation of mitogen-activated protein kinase (MAPK) and protein kinase B (AKT)/mitogen-activated protein kinase (mTOR) signaling pathways. In an in vivo study, PS-MPs accumulated and the treated mice had more histopathological lesions in the kidneys and higher levels of ER stress, inflammatory markers, and autophagy-related proteins in the kidneys after PS-MPs treatment by oral gavage.

Conclusions: The results suggest that PS-MPs caused mitochondrial dysfunction, ER stress, inflammation, and autophagy in kidney cells and accumulated in HK-2 cells and in the kidneys of mice. These results suggest that long-term PS-MPs exposure may be a risk factor for kidney health. https://doi.org/10.1289/EHP7612.


Figures

Figure 1A is a display of six columns, titled Polystyrene microplastics, concentration of 0, 0.05, 0.1, 0.2, 0.4, and 0.8 (milligram per milliliter) and three rows, namely, Merge, Nuclear, and 488-Polystyrene microplastics. Figure 1B is a display of five columns titled minutes, ranging as 0, 5, 15, 30, and 60 and three rows, namely, Merge, Nuclear, and 488-Polystyrene microplastics (rows). Figure 1C is a set of twelve flow cytometry graphs. The first six flow cytometry graphs plot count of cells, ranging from 0 to 150 in increments of 50 (left y-axis) and 1 hour for the first three graphs and 2 hours for the other three graphs (right y-axis) across signal of side scatter (S S C)-A, ranging from 0 to 1,000 in increments of 200 (x-axis) for Polystyrene microplastics, concentrations of 0, 0.05, and 0.1 (milligram per milliliter), respectively. The second six flow cytometry graphs plot count of cells, ranging from 0 to 150 in increments of 50 (left y-axis) and 1 hour for the first three graphs and 2 hours for the other three graphs (right y-axis) across signal of side scatter (S S C)-A, ranging from 0 to 1,000 in increments of 200 (x-axis) for Polystyrene microplastics, concentrations of 0.2, 0.4, and 0.8 (milligrams per milliliter), respectively. Figure 1D is a clustered bar graph plotting scatter intensity per control percentage, ranging from 0 to 500 in increments of 100 (y-axis) across Polystyrene microplastics (0, 0.05, 0.1, 0.2, 0.4, and 0.8 milligrams per milliliter) (x-axis) for 1 hour and 2 hours.
Figure 1.
Uptake of PS-MPs by HK-2 cells. (A) Cells were treated with PS-MPs (yellow-green fluorescence) at concentrations of 0.05, 0.1, 0.2, 0.4, and 0.8mg/mL for 2 h. Scale bar: 20μm. (B) Cells were treated with 0.8-mg/mL PS-MPs (yellow-green fluorescence) for 0, 5, 15 30, and 60 min. DAPI (blue) was used for nuclear staining. Scale bar: 20μm. (C) Cells were treated with PS-MPs at concentrations of 0.05, 0.1, 0.2, 0.4, and 0.8mg/mL for 1 and 2 h and analyzed by flow cytometry. (D) Scatter intensity signals were graphed and analyzed after treatment with PS-MPs at concentrations of 0.05, 0.1, 0.2, 0.4, and 0.8mg/mL for 1 and 2 h. n=3. **p<0.01 and ***p<0.001 compared with the control group, as determined by two-way ANOVA with Sidak’s multiple comparisons test. Significance at 1 h: 0-mg/mL group vs. 0.4-mg/mL group: p=0.0025, 0-mg/mL group vs. 0.8-mg/mL group: p<0.001); 2 h: 0-mg/mL group vs. 0.2-mg/mL group: p=0.0039; 0-mg/mL group vs. 0.4-mg/mL group: p<0.001; 0-mg/mL group vs. 0.8-mg/mL group: p<0.001. The data are presented as the means±SDs. The mean and SD summary data for quantification of (D) are shown in Table S3. p-Values for all comparisons in (D) are reported in Table S4. Note: DAPI, 4,6-dimidyl-2-phenylindole; HK-2 cells, human kidney 2 cells; PS-MPs, polystyrene microplastics; SSC, side scatter light; SD, standard deviation.
Figure 2A is a clustered bar graph plotting cell viability percentage, ranging from 0 to 140 in increments of 20 (y-axis) across polystyrene microplastics 0, 0.05, 0.1, 0.2, 0.4, and 0.8 milligrams per milliliter (x-axis) for 1 day, 2 days, and 3 days. Figure 2B is a set of six flow cytometry graphs plotting Propidium iodide for Propidium iodide-A, ranging from 10 begin superscript 0 end superscript to 10 begin superscript 4 end superscript in unit increments (y-axis) across Annexin V-fluorescein isothiocyanate for fluorescein isothiocyanate-A, ranging from 10 begin superscript 0 end superscript to 10 begin superscript 4 end superscript in unit increments (x-axis) for Polystyrene microplastics, concentrations of 0, 0.05, and 0.1 (milligram per milliliter) for the first three graphs and 0.2, 0.4, and 0.8 (milligram per milliliter) for the last three graphs, respectively. Figure 2C is a set of two bar graphs plotting Necrosis index percentage and Apoptosis index percentage, ranging from 0 to 50 in increments of 10 (y-axis) across Polystyrene microplastics (0, 0.05, 0.1, 0.2, 0.4, and 0.8 milligram per milliliter) (x-axis), respectively. Figure 2D is a display of six columns, titled Polystyrene microplastics, concentration of 0, 0.05, 0.1, 0.2, 0.4, and 0.8 (milligram per milliliter) and three rows, namely, Merge, Nuclear, and Mitochondrial Reactive Oxygen Species (rows). Figure 2E is a bar graph plotting mean intensity per control percentage Mitochondrial Reactive Oxygen Species, ranging from 0 to 500 in increments of 100 (y-axis) across Polystyrene microplastics (0, 0.05, 0.1, 0.2, 0.4, and 0.8 milligram per milliliter) (x-axis). Figures 2F to 2H are bar graphs plotting Bad per Glyceraldehyde-3-phosphate dehydrogenase, ranging from 0.0 to 2.0 in increments of 0.5; 0.0 to 1.5 in increments of 0.5; and 0.0 to 1.5 in increments of 0.5 (y-axis) across Polystyrene microplastics (minutes), ranging from 0 to 10 in increments of 5, 10 to 30 in increments of 10, and 30 to 60 in increments of 30 (x-axis), respectively.
Figure 2.
Cell viability, apoptosis, necrosis, mitochondrial ROS levels, and apoptosis-related proteins expression in HK-2 cells treated with PS-MPs. (A) Cell viability was determined after treatment with PS-MPs at concentrations of 0.05, 0.1, 0.2, 0.4, and 0.8mg/mL for 1, 2, and 3 d. n=3. *p<0.05 compared with the control group, as determined by two-way ANOVA with Dunnett’s multiple comparisons test. Significance: Day 3, 0-mg/mL group vs. 0.8-mg/mL group: p=0.0241. The mean and SD summary data of (A) are shown in Table S3. For all p-values, see Table S4. (B) Apoptosis was detected by flow cytometry after treatment with PS-MPs at concentrations of 0.05, 0.1, 0.2, 0.4, and 0.8mg/mL for 24 h. (C) The necrosis and apoptosis indexes were graphed and analyzed. n=3. *p<0.05 and **p<0.01 compared with the control group, as determined by one-way ANOVA with Dunnett’s multiple comparison test. Significance: necrosis index: 0-mg/mL group vs. 0.4-mg/mL group: p=0.0319, 0-mg/mL group vs. 0.8-mg/mL group: p=0.0026; apoptosis index: no significant differences (Table S4). The mean and SD summary data of (C) are shown in Table S3. (D) Mitochondrial ROS were detected with 5μM MitoSOX Red after treatment with PS-MPs at concentrations of 0.05, 0.1, 0.2, 0.4, and 0.8mg/mL for 6 h. DAPI (blue) was used for nuclear staining. Scale bar: 20μm. (E) Mitochondrial ROS levels were graphed and statistically analyzed. n=2. *p<0.05 and ***p<0.001 compared with the control group, as determined by one-way ANOVA with Dunnett’s multiple comparison test. Significance: 0-mg/mL group vs. 0.2-mg/mL group: p=0.0331, 0-mg/mL group vs. 0.4-mg/mL group: p<0.001, 0-mg/mL group vs. 0.8-mg/mL group: p=0.001. The mean and SD summary data of (E) are shown in Tables S3 and S4. The levels of apoptosis-related proteins, such as (F) Bad, (G) Bcl2, and (H) Bax, were assessed after treatment with PS-MPs at a concentration of 0.8mg/mL for 0, 5, 10, 20, 30, and 60 min. GAPDH served as an internal control. The data are presented as the means±SDs. The mean and SD summary data for quantification of western blots are shown in Table S3. The western blotting results were quantified and statistically analyzed as shown in Figure 2. Note: ANOVA, analysis of variance; DAPI, 4,6-dimidyl-2-phenylindole; GAPDH, glyceraldehyde 3-phosphate dehydrogenase; HK-2 cells, human kidney 2 cells; PS-MPs, polystyrene microplastics; ROS, reactive oxygen species; SD, standard deviation.
Figures 3A, 3C, 3D, and 3E are western blots plotting 0, 0.05, 0.1, 0.2, 0.4, and 0.8 (milligram per milliliter) (columns) across inositol-requiring transmembrane kinase or endoribonuclease 1 lowercase alpha, Activating transcription factor 6, phosphorylation of eukaryotic initiation factor-2 lowercase alpha, eukaryotic initiation factor-2 lowercase alpha, and glyceraldehyde-3-phosphate dehydrogenase; Cytosolic phospholipase A 2, Cyclooxygenase 1, and glyceraldehyde-3-phosphate dehydrogenase; Phosphorylated-mammalian target of rapamycin, mammalian target of rapamycin, Phosphorylated-Protein kinase B, Protein kinase B, and glyceraldehyde-3-phosphate dehydrogenase; and Sequestosome-1, Beclin-1, light chain 3-1, light chain 3-2, and glyceraldehyde-3-phosphate dehydrogenase (rows), respectively. Figure 3B is a western blot plotting 0, 5, 10, 20, 30, and 60 minutes (columns) across Phosphorylated-Extracellular signal-regulated kinases 1 and 2, Extracellular signal-regulated kinases 1 and 2, Phosphorylated-c-Jun N-terminal kinase, c-Jun N-terminal kinase, Phosphorylated-p 38 mitogen-activated protein kinases, p 38 mitogen-activated protein kinases, and glyceraldehyde-3-phosphate dehydrogenase (rows). Figure 3F is a display of six columns, namely, 0, 0.05, 0.1, 0.2, 0.4, and 0.8 (milligram per milliliter) and one row, namely, Polystyrene microplastics. Figure 3G is a bar graph plotting light chain 3-1 positive cells percentage, ranging from 0 to 40 in increments of 10 (y-axis) across Polystyrene microplastics (0, 0.05, 0.1, 0.2, 0.4, and 0.8 milligram per milliliter) (x-axis).
Figure 3.
ER stress-related proteins, MAPK signaling pathways, inflammation-related proteins, AKT/mTOR signaling pathways, and autophagosome-related proteins in HK-2 cells treated with PS-MPs. (A) Representative western blot showing the expression of ER stress-related proteins IRE1α, ATF6, p-EIF2α, and EIF2α after PS-MPs treatment at concentrations of 0.05, 0.1, 0.2, 0.4, and 0.8mg/mL for 24 h. (B) Representative western blot showing the expression of MAPK signaling pathway components p-ERK1/2, ERK1/2, p-JNK, JNK, p-p38, and p38 after treatment with PS-MPs at 0.8mg/mL for 0, 5, 10, 20, 30, and 60 min. (C) Representative western blot showing the expression of inflammation-related proteins cPLA2 and COX-1 after PS-MP treatment at concentrations of 0.05, 0.1, 0.2, 0.4, and 0.8mg/mL for 24 h. (D) Representative western blot showing the expression of AKT/mTOR signaling pathway components, such as p-mTOR, mTOR, p-AKT, and AKT after treatment with PS-MPs at concentrations of 0.05, 0.1, 0.2, 0.4, and 0.8mg/mL for 1 h. (E) Representative western blot showing the expression of autophagy-related proteins p62, Beclin 1, and LC3, after PS-MP treatment at concentrations of 0.05, 0.1, 0.2, 0.4, and 0.8mg/mL for 24 h. GAPDH served as an internal control. (F) LC3 expression (green) was detected after treatment with PS-MPs at concentrations of 0.05, 0.1, 0.2, 0.4, and 0.8mg/mL for 24 h in immunostaining. DAPI (blue) was used for nuclear staining. Scale bar: 25μm. (G) The results for LC3-positive cells were graphed and statistically analyzed. n=3. *p<0.05 and ***p<0.001 compared with the control group, as determined by one-way ANOVA, with Dunnett’s multiple comparison test. Significance: 0-mg/mL group vs. 0.1-mg/mL group: p=0.0265, 0-mg/mL group vs. 0.2-mg/mL group: p<0.001, 0-mg/mL group vs. 0.4-mg/mL group: p<0.001, 0-mg/mL group vs. 0.8-mg/mL group: p<0.0015. The data are presented as the means±SDs. The western blotting results were quantified and statistically analyzed, as shown in Figures S3–S7. The mean and SD summary data for quantification of western blots are shown in Table S3. Note: AKT, protein kinase B; ANOVA, analysis of variance; ATF6, activating transcription factor 6; COX-1, cyclooxygenase-1; cPLA2, cytoplasmic phospholipase A2; DAPI, 4,6-dimidyl-2-phenylindole; EIF2α, eukaryotic initiation factor 2 alpha; ERK1/2, extracellular signal-regulated kinases 1 and 2; GAPDH, glyceraldehyde 3-phosphate dehydrogenase; HK-2 cells, human kidney 2 cells; IRE1α, inositol-requiring enzyme 1α; JNK, c-Jun N-terminal kinase; MAPK, mitogen-activated protein kinase; mTOR, mitogen-activated protein kinase; p, phosphorylated; p-p38, phosphorylated-p38 mitogen-activated protein kinases; PS-MPs, polystyrene microplastics; SD, standard deviation.
Figure 4A is a display of five columns titled mitochondria-Tempo (micromolar) and Polystyrene microplastics, concentrations of 0 (negative), 0 (positive), 40 (positive), 80 (positive), and 100 (positive) and three rows, namely, Merge, Nuclear, mitochondria reactive oxygen species. Figure 4B is a bar graph plotting mean intensity per control percentage mitochondria reactive oxygen species, ranging from 0 to 400 in increments of 100 (y-axis) across mitochondria-Tempo (micromolar) and Polystyrene microplastics, ranging as 0 (negative), 0 (positive), 40 (positive), 80 (positive), and 100 (positive; x-axis). Figure 4C is a western blot plotting mitochondria-Tempo, depicting negative, positive, negative, and positive and Polystyrene microplastics, depicting negative, negative, positive, and positive (columns), respectively, across Bad and Glyceraldehyde-3-phosphate dehydrogenase (rows). Figure 4D is a western blot plotting mitochondria-Tempo, depicting negative, positive, negative, and positive and Polystyrene microplastics, depicting negative, negative, positive, and positive (columns), respectively, across inositol-requiring transmembrane kinase or endoribonuclease 1 lowercase alpha, Activating transcription factor 6, phosphorylation of eukaryotic initiation factor-2 lowercase alpha, eukaryotic initiation factor-2 lowercase alpha, and glyceraldehyde-3-phosphate dehydrogenase (rows). Figure 4E is a western blot plotting mitochondria-Tempo, depicting negative, positive, negative, and positive and Polystyrene microplastics, depicting negative, negative, positive, and positive (columns), respectively, across Phosphorylated-Extracellular signal-regulated kinases 1 and 2, Extracellular signal-regulated kinases 1 and 2, Phosphorylated-c-Jun N-terminal kinase, c-Jun N-terminal kinase, Phosphorylated-p 38 mitogen-activated protein kinases, p 38 mitogen-activated protein kinases, and glyceraldehyde-3-phosphate dehydrogenase (rows). Figure 4F is a western blot plotting mitochondria-Tempo, depicting negative, positive, negative, and positive and Polystyrene microplastics, depicting negative, negative, positive, and positive (columns), respectively, across Phosphorylated-mammalian target of rapamycin, mammalian target of rapamycin, Phosphorylated-Protein kinase B, Protein kinase B, and glyceraldehyde-3-phosphate dehydrogenase (rows). Figure 4G is a western blot plotting mitochondria-Tempo, depicting negative, positive, negative, and positive and Polystyrene microplastics, depicting negative, negative, positive, and positive (columns), respectively, across Sequestosome 1, Beclin-1, light chain 3-1, light chain 3-2, and glyceraldehyde-3-phosphate dehydrogenase (rows).
Figure 4.
Levels of Bad, ER stress-related proteins, MAPK-, and AKT/mTOR signaling pathway proteins and autophagy-related proteins after PS-MP treatment in HK-2 cells with mitochondrial ROS inhibition. (A) Mitochondrial ROS levels (red) using MitoSOX Red stain after pretreatment with MitoTEMPO at concentrations of 40, 80, and 100μM. After MitoTEMPO pretreatment, PS-MPs were added at a concentration of 0.8mg/mL. DAPI (blue) was used for nuclear staining. Scale bar: 20μm. (B) The mean intensity after inhibition of mitochondrial ROS production was normalized to that in the control group and graphed. n=3. *p<0.05 and **p<0.01 compared with the control group, as determined by one-way ANOVA with Dunnett’s multiple comparison test. Significance: 0.8-mg/mL PS-MPs group vs. 0 PS-MPs mg/mL group: p=0.0019, 0.8-mg/mL PS-MP–only group vs. 0.8-mg/mL PS-MPs+100μM MitoTEMPO group: p=0.0135. The mean and SD summary data of (B) are shown in Table S3. See Table S4 for p-values for all comparisons. (C) The expression of apoptosis-related protein Bad was examined. Cells were pretreated with MitoTEMPO (100μM) for 1 h, PS-MPs (0.8mg/mL) were added, and the cells were incubated for another 20 min. (D) The expression of ER stress-related proteins, such as IRE1α, ATF6, p-EIF2α, and EIF2α, was examined. Cells were pretreated with MitoTEMPO for 1 h, PS-MPs were added, and the cells were incubated for another 24 h. (E) The phosphorylation of MAPK signaling pathway components p38, ERK1/2, and JNK was examined. Cells were pretreated with MitoTEMPO for 12 h, PS-MPs were added, and the cells were incubated for another 30 min. (F) The phosphorylation of AKT/mTOR pathway components mTOR, and AKT was examined. Cells were pretreated with MitoTEMPO for 1 h, PS-MPs were added, and the cells were incubated for another 1 h. (G) The expression of autophagy-related proteins p62, Beclin 1, and LC3 was examined after pretreatment with MitoTEMPO for 1 h and treatment with 0.8mg/mL PS-MPs for 24 h. GAPDH served as an internal control. The data are presented as the means±SDs. The mean and SD summary data for quantification of western blots are shown in Table S3. The western blotting results were quantified and statistically analyzed, as shown in Figure S8. Note: AKT, protein kinase B; ANOVA, analysis of variance; ATF6, activating transcription factor 6; DAPI, 4,6-dimidyl-2-phenylindole; EIF2α, eukaryotic initiation factor 2 alpha; ER, endoplasmic reticulum; ERK1/2, extracellular signal-regulated kinases 1 and 2; GAPDH, glyceraldehyde 3-phosphate dehydrogenase; HK-2 cells, human kidney 2 cells; IRE1α, inositol-requiring enzyme 1α; JNK, c-Jun N-terminal kinase; MAPK, mitogen-activated protein kinase; mTOR, mitogen-activated protein kinase; p, phosphorylated; PS-MPs, polystyrene microplastics; ROS, reactive oxygen species; SD, standard deviation.
Figure 5A is a western blot plotting short hairpin ribonucleic acid, depicting void and Autophagy Related 5 knockdown for number 1 and number 2 (columns) across Autophagy Related 5 and glyceraldehyde-3-phosphate dehydrogenase (rows). Figure 5B is a bar graph plotting cell viability percentage, ranging from 0 to 200 in increments of 50 (y-axis) across Polystyrene microplastics (0, 0.4, and 0.8 milligram per milliliter) (x-axis) for void, Autophagy Related 5 knockdown for number 1, and Autophagy Related 5 knockdown for number 2. Figure 5C is a western blot plotting Polystyrene microplastics (0, 0.4, and 0.8 milligram per milliliter) (columns) expressing void and Autophagy Related 5 knockdown for number 1 and number 2 across Autophagy Related 5, light chain 3-1, light chain 3-2, Cyclooxygenase 1, and glyceraldehyde-3-phosphate dehydrogenase (rows). Figure 5D is a clustered bar graph plotting cell viability percentage, ranging from 0 to 160 in increments of 20 (y-axis) Polystyrene microplastics (0, 0.4, and 0.8 milligram per milliliter) (x-axis) for Autophagy Related 5 wild type Mouse Embryonic Fibroblasts cells and Autophagy Related 5 null Mouse Embryonic Fibroblasts cells. Figure 5E is a set of six flow cytometry graphs plotting Propidium iodide for Propidium iodide-A, ranging from 10 begin superscript 0 end superscript to 10 begin superscript 4 end superscript in unit increments (y-axis) across Annexin V-fluorescein isothiocyanate for fluorescein isothiocyanate-A, ranging from 10 begin superscript 0 end superscript to 10 begin superscript 4 end superscript in unit increments (x-axis) for Autophagy Related 5 wild type Mouse Embryonic Fibroblasts cells and Autophagy Related 5 null Mouse Embryonic Fibroblasts cells, respectively. Figure 5F is a set of two clustered bar graphs plotting Necrosis index percentage and Apoptosis index percentage, ranging from 0 to 50 in increments of 10 (y-axis) across Polystyrene microplastics (milligram per milliliter), ranging from 0 to 0.8 in increments of 0.2 (x-axis) for Autophagy Related 5 wild type Mouse Embryonic Fibroblasts cells and Autophagy Related 5 null Mouse Embryonic Fibroblasts cells, respectively.
Figure 5.
Cell viability and the levels of inflammation-related proteins and apoptosis in ATG5KD and Atg5/ cells treated with PS-MPs. (A) ATG5 protein expression in ATG5KD and control HK-2 cells. (B) Cell viability of the ATG5KD and control HK-2 cells after treatment with PS-MPs treatment at concentrations of 0.4 and 0.8mg/mL for 48 h. n=3. *p<0.05, **p<0.01, and ***p<0.001 compared with the control group, as determined by two-way ANOVA with Dunnett’s multiple comparison test. Significance: ATG5KD#1: 0-mg/mL group vs. 0.4-mg/mL group: p=0.0174, 0-mg/mL group vs. 0.8-mg/mL group: p=0.0047; ATG5KD#2: 0-mg/mL group vs. 0.4-mg/mL group: p<0.001, 0-mg/mL group vs. 0.8-mg/mL group, p<0.001. The mean and SD summary data of (B) are shown in Table S3. All p-values shown in Table S4. (C) ATG5, LC3, and COX-1 protein expression in the ATG5KD and control HK-2 cells after treatment with PS-MPs at concentrations of 0.4 and 0.8mg/mL for 48 h. (D) Cell viability of Atg5+/+ and Atg5/ MEF cells with PS-MPs at concentrations of 0.4 and 0.8mg/mL for 48 h. n=3. *p<0.05 and ***p<0.001 compared with the control group, as determined by two-way ANOVA with Sidak’s multiple comparisons test. Significance: Atg5+/+ MEF cells vs. Atg5/ MEF cells: 0.4-mg/mL group: p=0.0321, 0.8-mg/mL group: p<0.001. (E) Apoptosis of Atg5+/+ and Atg5/ MEF cells was analyzed after PS-MPs treatment at concentrations of 0.4 and 0.8mg/mL for 48 h. The mean and SD summary data of (D) are shown in Table S3. All p-values shown in Table S4. (F) Necrosis and apoptosis indices in Atg5+/+ and Atg5/ MEF cells after treatment with PS-MPs at concentrations of 0.4 and 0.8mg/mL. n=3. *p<0.05 compared with the control group, as determined by two-way ANOVA with Sidak’s multiple comparisons test. Significance: necrosis index: no significant differences (Table S3); apoptosis index: Atg5+/+ MEF cells vs. Atg5/ MEF cells: 0.4mg/mL: p=0.0426, 0.8mg/mL: p=0.003. The mean and SD summary data of (F) are shown in Table S3. All p-values are shown in Table S4. The data are presented as the means±SDs. The western blotting results were quantified and statistically analyzed, as shown in Figure S9. Note: ANOVA, analysis of variance; Atg5/, autophagy related gene 5 knockout; Atg5+/+, autophagy related gene 5 wild type; ATG5KD, ATG5KD, autophagy related gene 5 knockdown; COX-1, cyclooxygenase-1; HK-2 cells, human kidney 2 cells; MEF, mouse embryonic fibroblast; PS-MPs, polystyrene microplastics; SD, standard deviation; shRNA, short hairpin RNA.
Figure 6A is a set of two line graphs plotting body weight (gram), ranging from 22 to 30 in increments of 2 and 20 to 32 in increments of 2 (y-axis) across 4 weeks of oral gavage, ranging from 0 to 4 in unit increments and 8 weeks of oral gavage, ranging from 0 to 8 in unit increments (x-axis) for sham, 0.2 milligram per day Polystyrene microplastics, and 0.4 milligram per day Polystyrene microplastics. Figure 6B is a set of two clustered bar graph plotting Blood Urea Nitrogen (milligram per day), ranging from 0 to 50 in increments of 10 and Creatinine (milligram per day), ranging from 0.0 to 0.5 in unit increments (y-axis) across Polystyrene microplastics (milligram per milliliter) expressing sham, 0.2, and 0.4 (x-axis) for 4 weeks and 8 weeks, respectively. Figure 6C is a display of three columns, namely, sham, 0.2, and 0.4 (milligram per day) and two rows, namely, 4 weeks and 8 weeks. Figure 6D is a bar graph plotting tubular injury scores, ranging from 0.0 to 2.0 in increments of 0.5 (y-axis) across Polystyrene microplastics (milligram per milliliter) expressing sham, 0.2, and 0.4 (x-axis) for 4 wk and 8 wk. Figures 6E to 6G are each a display of three columns, namely, sham, 0.2, and 0.4 (milligram per day) and two rows, namely, 4 weeks and 8 weeks.
Figure 6.
Body weights, blood biochemistry index values, H&E staining in kidney sections, tubulointerstitial injury, and IHC for ER stress-, inflammation-, and autophagy-related proteins in kidney sections for mice treated with PS-MPs. (A) The body weights of mice were measured after PS-MPs were administered with concentrations of 0.2 and 0.4mg/d for 4 and 8 wk. The data are presented as the means±SDs, n=5. The mean and SD summary data of (A) are shown in Table S3. (B) Blood biochemistry was analyzed via assessment of BUN and creatinine. The data are presented as the means±SDs. n=5. **p<0.01 and ***p<0.001 compared with sham group, as determined by two-way ANOVA with Tukey’s multiple comparisons test. Significance: BUN: no significant differences (Table S3); creatinine: 4 wk: sham group vs. 0.2-mg/d group: p=0.001, sham group vs. 0.4-mg/d group: p=0.0026; 8 wk: sham group vs. 0.2-mg/d group: p=0.0068, sham group vs. 0.4-mg/d group: p<0.05<0.001, 0.2-mg/d group vs. 0.4-mg/d group: p=0.0026. The mean and SD summary data of (B) are shown in Table S3. All p-values shown in Table S3. (C) H&E staining of representative kidney sections. Hematoxylin stained the cell nuclei blue, and eosin stained the extracellular matrix and cytoplasm pink. Scale bar: 30μm. The arrows indicate lesions. (D) Tubulointerstitial injury analyses in kidneys. The data are presented as the means±SDs. Twenty fields of view per kidney (5 mice per group). *p<0.05 and ***p<0.001 compared with sham group samples, as determined by two-way ANOVA with Dunnett’s multiple comparisons test. Significance: 4 wk: sham group vs. 0.2-mg/d group: p=0.0342, sham group vs. 0.4-mg/d group: p<0.001; and 8 wk; sham group vs. 0.2-mg/d group: p<0.001, sham group vs. 0.4-mg/d group: p<0.001. The mean and SD summary data of (D) are shown in Table S3. All p-values reported in Table S4. (E) IHC of IRE1α expressed in the kidney sections. Scale bar: 30μm. (F) IHC of COX-1 expressed in the kidney sections. Scale bar: 30μm. (G) IHC of LC3 expressed in the kidney sections. Scale bar: 30μm. n=2. The quantified IHC data were graphed and statistically analyzed, as shown in Table S5. Note: ANOVA, analysis of variance; BUN, blood urea nitrogen; COX-1, cyclooxygenase-1; CREA, creatinine; ER, endoplasmic reticulum; H&E, hematoxylin and eosin; IRE1α, inositol-requiring enzyme 1α; IHC, immunohistochemistry; PS-MPs, polystyrene microplastics; SD, standard deviation.
Figure 7A is a Raman spectroscopy plotting 1,000 (count) (y-axis) across Raman shift (centimeter begin superscript negative end superscript), ranging from 400 to 1,600 in increments of 200 (x-axis) for sham group with 8 milligrams per gram kidney of Polystyrene microplastics, sham group with 4 milligrams per gram kidney of Polystyrene microplastics, sham group with 1.6 milligrams per gram kidney of Polystyrene microplastics, sham group with 0.4 milligrams per gram kidney of Polystyrene microplastics, and sham group. Figure 7B is line graph plotting Raman intensity (count), ranging from 0 to 1,200 in increments of 200 (y-axis) across concentration of Polystyrene microplastics (milligram per gram kidney), ranging from 0 to 8 in increments of 2 (x-axis) for linear trendline. Figure 7C is a Raman spectroscopy plotting 5,000 (count) (y-axis) across Raman shift (centimeter begin superscript negative end superscript), ranging from 400 to 1,600 in increments of 200 (x-axis) for Sham group 5 and Polystyrene microplastics 5; Sham group 4 and Polystyrene microplastics 4; Sham group 3 and Polystyrene microplastics 3; Sham group 2 and Polystyrene microplastics 2; and Sham group 1 and Polystyrene microplastics 1. Figure 7D is a bar graph plotting estimated concentration (milligram per gram), ranging from 0 to 4 in unit increments (y-axis) across sham and Polystyrene microplastics (x-axis). Figure 7E is a transmission electron microscopy analysis of the kidney tissues in mice. The sham group and Polystyrene microplastics treatment group (0.4 milligram per day Polystyrene microplastics for 8 weeks) including basal lamina, nucleus, tubular epithelial cell, epithelial cell, and collagen fibril were observed.
Figure 7.
Raman analysis and TEM of kidney tissue from mice treated with PS-MPs. (A) Raman signals for ground kidney samples containing PS-MPs at 0, 0.4, 1.6, 4, and 8mg/gkidney. (B) Raman signal for ring breathing mode. (C) There were no Raman peaks at 1,000cm1 for the ground kidney samples of the sham-treated mice (sham group 1–5), in contrast to the samples from the mice treated with 0.4mg/d PS-MPs for 8 wk (PS-MPs group 1–5) (Table S2). (D) Statistical results of Raman analysis for each mouse. The estimated concentrations of PS-MPs in each kidney are shown in Table S2. The mean and SD summary data of (D) are shown in Table S3. n=5. ***p<0.001 compared with the sham group, as determined by t-test. Significance: sham group vs. PS-MPs group: p<0.001. (E) TEM analysis of the kidney tissues (n=3). The sham group and PS-MPs treatment group (0.4mg/d PS-MPs for 8 wk) were observed. Scale bar: 500 nm. Note: BL, basal lamina; cnt, count; CO, collagen fibril; EP, epithelial cell; N, nucleus; PS-MPs, polystyrene microplastics; TEC, tubular epithelial cell; SD, standard deviation; TEM, transmission electron microscopy.
Figure 8 is a schematic diagram, depicting the proposed mechanism by which Polystyrene microplastics induced mitochondrial reactive oxygen species production, Bad expression, endoplasmic reticulum stress, inflammation, and autophagy. The data obtained in human kidney 2 cells and a mouse model states that Polystyrene microplastics were taken up by kidney cells and that Polystyrene microplastics induced mitochondrial reactive oxygen species production and Bad protein expression. Polystyrene microplastics increased the expression of the endoplasmic reticulum stress-related proteins Inositol-requiring transmembrane kinase or endoribonuclease 1 lowercase alpha and phosphorylation of eukaryotic initiation factor-2 lowercase alpha and the inflammation-related proteins Phospholipases A2 and Cyclooxygenase 1 in kidney cells. Polystyrene microplastics also increased the autophagy-related protein expression of Beclin 1, and light chain 3 in kidney cells and affected endoplasmic reticulum stress, inflammation, and autophagy in the kidney cells via mitogen-activated protein kinase and Protein kinase B or mammalian target of rapamycin signaling pathways. Mitochondrial reactive oxygen species-mediated regulation of Bad, Inositol-requiring transmembrane kinase or endoribonuclease 1 lowercase alpha and light chain 3 in kidney cells can occur via Protein kinase B or mammalian target of rapamycin signaling pathways. An autophagy may be an adaptive stress response that inhibits inflammation and apoptosis.
Figure 8.
Schematic diagram indicating the proposed mechanism by which PS-MPs induced mitochondrial ROS production, Bad expression, ER stress, inflammation, and autophagy. Based on the data obtained in HK-2 cells and a mouse model, we propose that PS-MPs were taken up by kidney cells and that PS-MPs induced mitochondrial ROS production and Bad protein expression. Furthermore, we propose that PS-MPs increased the expression of the ER stress-related proteins IRE1α and p-EIF2α and the inflammation-related proteins cPLA2 and COX-1 in kidney cells. We propose that PS-MPs increased the autophagy-related protein expression of Beclin 1, and LC3 in kidney cells and affected ER stress, inflammation, and autophagy in the kidney cells via MAPK and AKT/mTOR signaling pathways. Mitochondrial ROS-mediated regulation of Bad, IRE1α, and LC3 in kidney cells can occur via AKT/mTOR signaling pathways. Furthermore, autophagy may be an adaptive stress response that inhibits inflammation and apoptosis. Note: AKT, protein kinase B; COX-1, cyclooxygenase-1; cPLA2, cytoplasmic phospholipase A2; EIF2α, eukaryotic initiation factor 2 alpha; ER, endoplasmic reticulum; HK-2 cells, human kidney 2 cells; MAPK, mitogen-activated protein kinase; mitoROS, mitochondrial reactive oxygen species; mTOR, mitogen-activated protein kinase; PS-MPs, polystyrene microplastics; ROS, reactive oxygen species.

References

    1. Abbasi S, Soltani N, Keshavarzi B, Moore F, Turner A, Hassanaghaei M. 2018. Microplastics in different tissues of fish and prawn from the Musa Estuary, Persian Gulf. Chemosphere 205:80–87, PMID: 29684694, 10.1016/j.chemosphere.2018.04.076. - DOI - PubMed
    1. Barboza LGA, Vieira LR, Branco V, Figueiredo N, Carvalho F, Carvalho C, et al. 2018. Microplastics cause neurotoxicity, oxidative damage and energy-related changes and interact with the bioaccumulation of mercury in the European seabass, Dicentrarchus labrax (Linnaeus, 1758). Aquat Toxicol 195:49–57, PMID: 29287173, 10.1016/j.aquatox.2017.12.008. - DOI - PubMed
    1. Baxmann AC, Ahmed MS, Marques NC, Menon VB, Pereira AB, Kirsztajn GM, et al. 2008. Influence of muscle mass and physical activity on serum and urinary creatinine and serum cystatin C. Clin J Am Soc Nephrol 3:348–354, PMID: 18235143, 10.2215/CJN.02870707. - DOI - PMC - PubMed
    1. Belibi F, Zafar I, Ravichandran K, Segvic AB, Jani A, Ljubanovic DG, et al. 2011. Hypoxia-inducible factor-1α (HIF-1α) and autophagy in polycystic kidney disease (PKD). Am J Physiol Renal Physiol 300(5):F1235–1F1243, PMID: 21270095, 10.1152/ajprenal.00348.2010. - DOI - PMC - PubMed
    1. Birben E, Sahiner UM, Sackesen C, Erzurum S, Kalayci O. 2012. Oxidative stress and antioxidant defense. World Allergy Organ J 5(1):9–19, PMID: 23268465, 10.1097/WOX.0b013e3182439613. - DOI - PMC - PubMed

Publication types

LinkOut - more resources