. 2021 May 6;17(5):e1008849.
doi: 10.1371/journal.pcbi.1008849. eCollection 2021 May.

Modelling optimal vaccination strategy for SARS-CoV-2 in the UK

Affiliations

Modelling optimal vaccination strategy for SARS-CoV-2 in the UK

Sam Moore et al. PLoS Comput Biol. .

Abstract

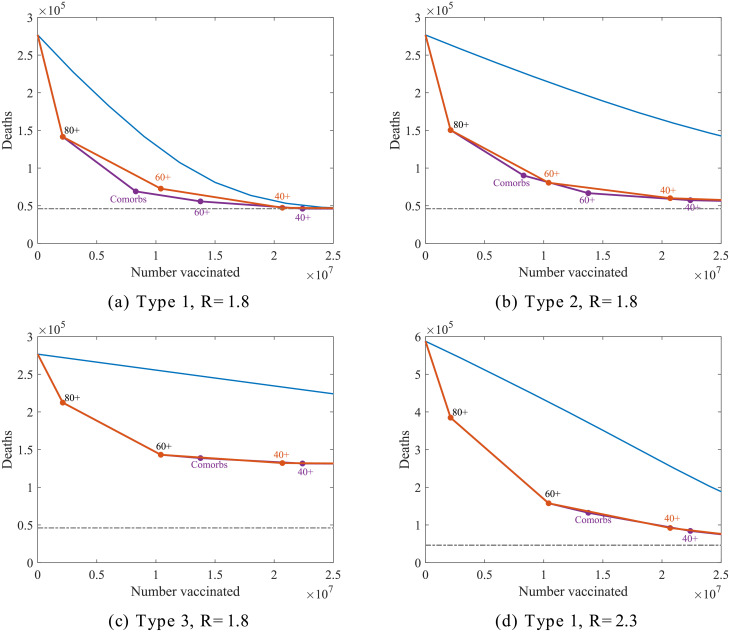
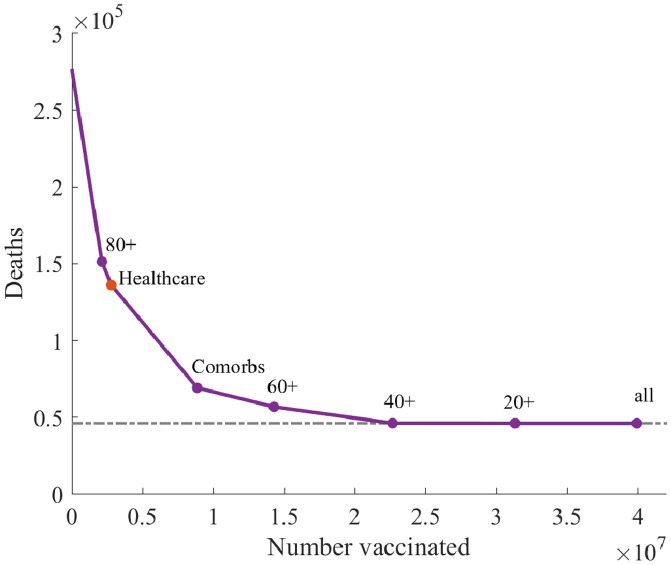
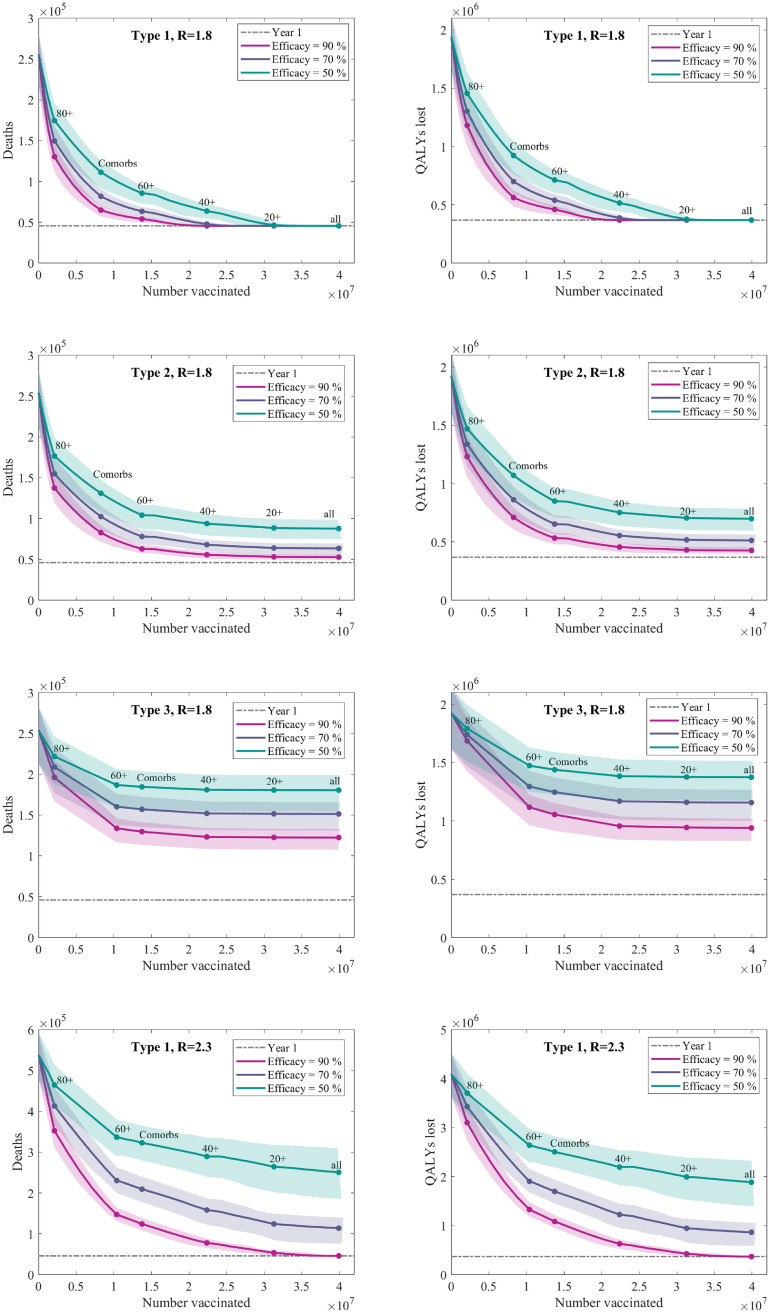
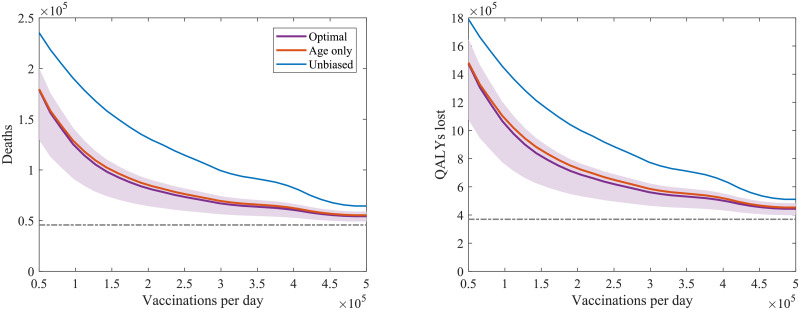
The COVID-19 outbreak has highlighted our vulnerability to novel infections. Faced with this threat and no effective treatment, in line with many other countries, the UK adopted enforced social distancing (lockdown) to reduce transmission-successfully reducing the reproductive number R below one. However, given the large pool of susceptible individuals that remain, complete relaxation of controls is likely to generate a substantial further outbreak. Vaccination remains the only foreseeable means of both containing the infection and returning to normal interactions and behaviour. Here, we consider the optimal targeting of vaccination within the UK, with the aim of minimising future deaths or quality adjusted life year (QALY) losses. We show that, for a range of assumptions on the action and efficacy of the vaccine, targeting older age groups first is optimal and may be sufficient to stem the epidemic if the vaccine prevents transmission as well as disease.


Conflict of interest statement

The authors have declared that no competing interests exist.

Figures

Fig 1
Fig 1. Representation of model states and transitions.
Descriptions of model parameters are given in Fig 2. Individuals starting from the S (susceptible-unvaccinated) or V (susceptible-vaccinated) states move through the model to conclude in the R (recovered) or Rd (dead) states. Those in the asymptomatic, U, state all eventually recover, those in the symptomatic, D, state may either recover or die directly, or move into hospital and/or ICU before either recovery or death. Three different possible types of vaccination are shown by green arrows and bracketed variables. These are:
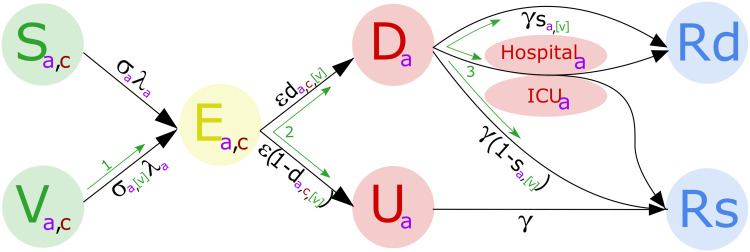
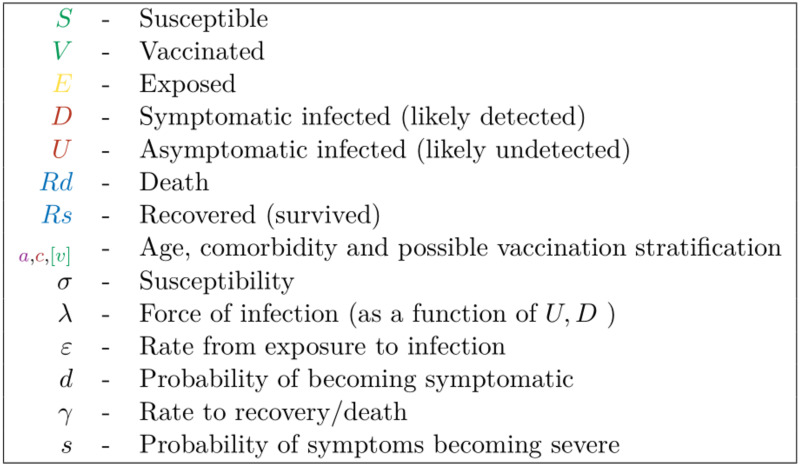
  1. Reduction in susceptibility.

  2. Reduction in becoming symptomatic.

  3. Reduction in experiencing severe symptoms.

Further model details may be found in the supporting information.
Fig 2
Fig 2. Description of model parameters.
Fig 3
Fig 3. The percentage of the population (left panel) and deaths (right panel) predicted by our model, within each five-year age band.
The proportions of each age group with health conditions are shown in red, with the proportion of each age group without health conditions (healthy) shown in purple.
Fig 4
Fig 4. Simulated daily deaths without vaccination.
(a) First wave of infection as observed from the start of 2020. (b) Subsequent wave of infection following relaxation to limited NPIs, sufficient to reduce the basic reproductive number to approximately R = 1.8(±0.1). (c) Subsequent infection wave following complete relaxation of all NPIs leading to R = 2.3(±0.2). Uncertainty is represented by the shaded region, within which 95% of simulations are found to fall.
Fig 5
Fig 5. Comparison of vaccination ordering for four different vaccination scenarios.
In each panel, the simulated points represent the number of subsequent deaths expected after vaccinating everyone up to a given group following an optimum strategy (identified by giving greatest reduction in deaths per vaccination in each instance) represented by the purple and orange connecting lines. Here the purple line shows the path of the optimum vaccination ordering of groups comprising of 20 year age bands together with comorbidities across all ages, and the orange line for age groupings only. The blue lines show an unbiased strategy with vaccinated numbers dispersed evenly across the population and the grey dotted line show the base level of morbidity from the first infection wave.
Fig 6
Fig 6. Optimal vaccination ordering for age, comorbidity and HCW groups in a scenario with a type 1 vaccination and low level social measures (R = 1.8).
Fig 7
Fig 7. Deaths and QALYs lost versus the proportion of the population vaccinated.
We use the optimal vaccination ordering with a maximum vaccine uptake of 70% across the population. The optimal vaccination ordering did not depend on the collection of considered vaccine efficacies. We display the mean values of 100 independent simulations for each vaccine efficacy (solid lines), with 95% prediction intervals (shaded regions). The grey dotted line shows the base level of mortality from the first wave of the pandemic.
Fig 8
Fig 8. The total number of (left) deaths and (right) QALYs lost following the start of vaccination vs speed of deployment for a type 1 vaccination with 70% uptake and 70% efficacy.
Vaccine deployment is started 2 months after stricter NPIs are relaxed to leave low level measures sufficient to keep R ≈ 1.8. The purple line (and shaded prediction region) represents projected outcomes under the identified optimal ordering with age and comorbidity groups, the orange line outcomes using the identified optimal ordering accounting for age groups only (without comorbidity), and the blue line outcomes with an unbiased population wide delivery. The grey dotted lines show the base level of mortality or QALYs lost, as applicable, from the first wave of the pandemic in the UK in the first half of 2020.
Fig 9
Fig 9. The effect of different levels of declining type 1 vaccine efficacy (R ≈ 1.8) on both the optimal vaccine ordering and success at limiting mortality.
A maximum efficacy value is applied to all individuals below the age of 45 and a minimum level to individuals above the age of 85. Efficacy is assumed to decay linearly between these two levels to give the efficacy for intermediary age groups. This distribution is represented by the inset in left panel. The left panel shows when, dependent on minimum and maximum efficacy, the two groups deemed most significant for vaccination impact vary. In the purple region it is optimal to vaccinate those above the age of 80 followed by comorbidities, in the red comorbidities followed by 80+ and in the yellow those in the 40-60 age group followed by comorbidities. The right panel shows the expected further mortality following vaccination with 70% of the whole population vaccinated for different minimum/maximum type 1 vaccine efficacies. The large dark blue region corresponds to less than 10,000 deaths following vaccination.

References

    1. Control for Disease Prevention EC. Covid-19 situation update worldwide, as of 16 august 2020. https://www.ecdc.europa.eu/en/geographical-distribution-2019-ncov-cases (accessed August, 2020).
    1. NHS UK. Check if you or your child has coronavirus symptoms (2020). https://www.nhs.uk/conditions/coronavirus-covid-19/symptoms/. [Online] (Accessed: 11 December 2020).
    1. News B. Coronavirus vaccine: Uk government signs deals for 90 million doses. https://www.bbc.co.uk/news/health-53772650 (accessed August, 2020).
    1. Graham SP, McLean RK, Spencer AJ, Belij-Rammerstorfer S, Wright D, et al.. Evaluation of the immunogenicity of prime-boost vaccination with the replication-deficient viral vectored covid-19 vaccine candidate chadox1 ncov-19. npj Vaccines 5(1):1–6 (2020). 10.1038/s41541-020-00221-3 - DOI - PMC - PubMed
    1. Folegatti PM, Ewer KJ, Aley PK, Angus B, Becker S, et al.. Safety and immunogenicity of the chadox1 ncov-19 vaccine against sars-cov-2: a preliminary report of a phase 1/2, single-blind, randomised controlled trial. The Lancet (2020). - PMC - PubMed

Publication types

Substances