

Clinical factors associated with rapid treatment of sepsis
- PMID: 33956846
- PMCID: PMC8101717
- DOI: 10.1371/journal.pone.0250923
Clinical factors associated with rapid treatment of sepsis
Abstract
Purpose: To understand what clinical presenting features of sepsis patients are historically associated with rapid treatment involving antibiotics and fluids, as appropriate.
Design: This was a retrospective, observational cohort study using a machine-learning model with an embedded feature selection mechanism (gradient boosting machine).
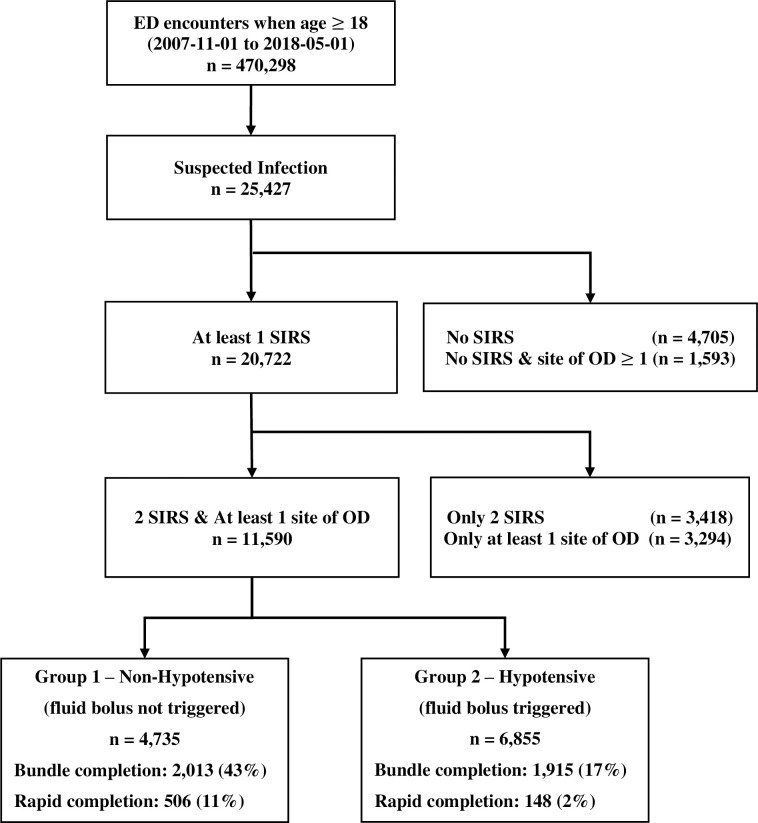
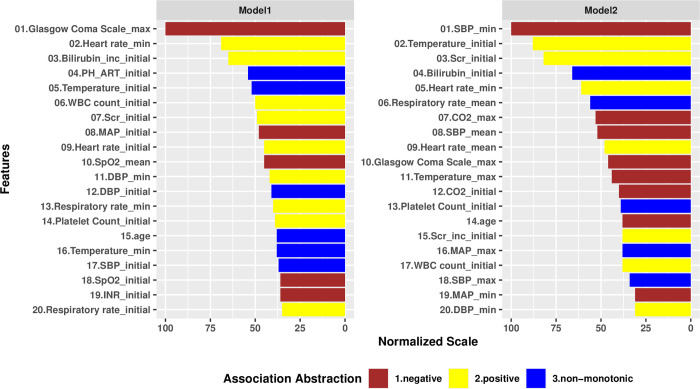
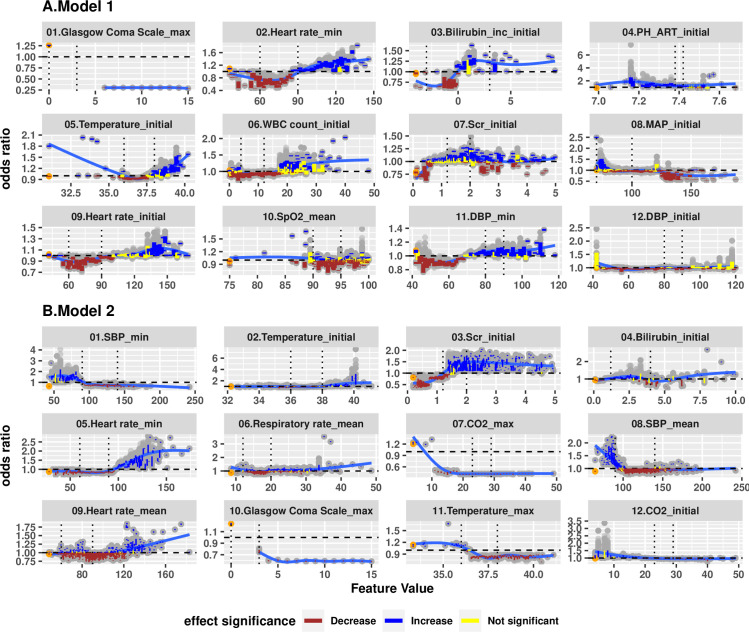
Methods: For adult patients (age ≥ 18 years) who were admitted through Emergency Department (ED) meeting clinical criteria of severe sepsis from 11/2007 to 05/2018 at an urban tertiary academic medical center, we developed gradient boosting models (GBMs) using a total of 760 original and derived variables, including demographic variables, laboratory values, vital signs, infection diagnosis present on admission, and historical comorbidities. We identified the most impactful factors having strong association with rapid treatment, and further applied the Shapley Additive exPlanation (SHAP) values to examine the marginal effects for each factor.
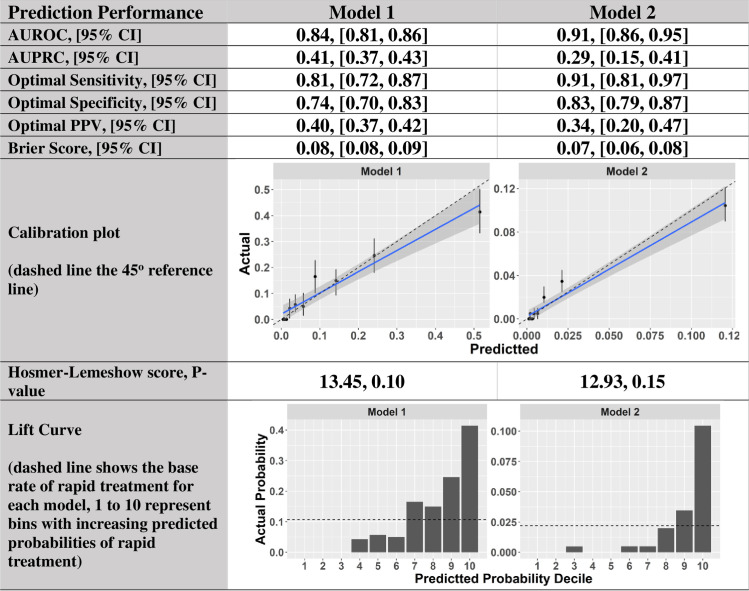
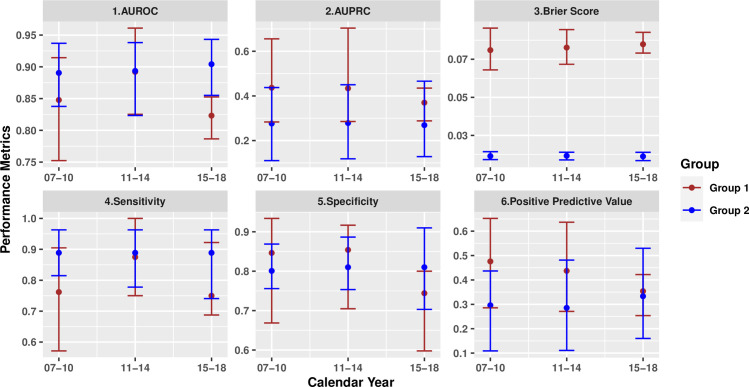
Results: For the subgroups with or without fluid bolus treatment component, the models achieved high accuracy of area-under-receiver-operating-curve of 0.91 [95% CI, 0.86-0.95] and 0.84 [95% CI, 0.81-0.86], and sensitivity of 0.81[95% CI, 0.72-0.87] and 0.91 [95% CI, 0.81-0.97], respectively. We identified the 20 most impactful factors associated with rapid treatment for each subgroup. In the non-hypotensive subgroup, initial physiological values were the most impactful to the model, while in the fluid bolus subgroup, value minima and maxima tended to be the most impactful.
Conclusion: These machine learning methods identified factors associated with rapid treatment of severe sepsis patients from a large volume of high-dimensional clinical data. The results provide insight into differences in the rapid provision of treatment among patients with sepsis.
Conflict of interest statement
AP’s affiliation to Anurag4Health does not alter our adherence to PLOS ONE policies on sharing data and materials.
Figures
References
-
- Churpek M, Snyder A, Han X, et al.: Quick sepsis-related organ failure assessment, systemic inflammatory response syndrome, and early warning scores for detecting clinical deterioration in infected patients outside theintensive care unit. Am J Respir Crit Care Med 2017; 195:906–911. 10.1164/rccm.201604-0854OC - DOI - PMC - PubMed
Publication types
MeSH terms
Substances
Grants and funding
LinkOut - more resources
Full Text Sources
Other Literature Sources
Medical
